HODLing versus Day Trading. aka Hoping versus ControlFrom my experience I've learned that I prefer control of my profit rather than holding and hoping.
With there being over 14,000 crypto projects to choose from, there is no guarantee that each market will go back up.
The marker caps are already rather expensive, so to double your money on Bitcoin for example it has to go to $200k, whereas with prop firm day trading I can double my position's size in within an hour.
I have created a trading strategy to support my desire of control. If you too like control over your profit, then stay close to my work.
Bitcoin-trading

ADAUSD - pricesCertain arguments will certainly make a difference, but they are unlikely to change the course.

BTCUSD - Projection I'm leaving it here as a bearish view in the coming days.
Certain arguments will certainly make a difference, but they are unlikely to change the course.

Trading opportunity for ORDIUSDTBased on technical factors there is a Buy position in :
📊 ORDIUSDT
🔵 Buy Now
🪫Stop loss 39.50
🔋Target 1 62.00
🔋Target 2 74.00
🔋Target 3 93.50
💸RISK : 1%
We hope it is profitable for you ❤️
Please support our activity with your likes👍 and comments📝

CHZUSDT has comfortably broken the resistance ...going nice and smooth
good risk/reward
use only 5% of your capital
confidence intrade - high
this is not financial advoice just for educational purposes

$BTCUSDT is ready to break the ATHBINANCE:BTCUSDT.P
Ok. Early I published idea about correction. But now, it happen and we must be ready for this long.
I think that this entry point will perfect now.
Entry: 69575
SL: 68153
TP: 73783, 75120
Subscribe me for more signals by link below in Signarure!

Bitcoin retested its all-time high (ATH)Bitcoin retested its all-time high (ATH) area near $73,777 last night but faced a rejection, resulting in a slight retracement to its current trading level around $71,900. This price action is a pivotal point, as a successful retest of the ATH could either:
Break Through – capturing short sellers' stop losses above this level and potentially flipping the ATH area from resistance into new support. This could allow Bitcoin to push higher, continuing its upward momentum.
Reject and Retrace – if the ATH level holds as resistance, we may see a pullback to lower support zones before the next move.
Given Bitcoin's proximity to this critical level, traders should monitor the reaction closely, as a sustained breakout could signal strength in the overall market, whereas a rejection may indicate more consolidation ahead.

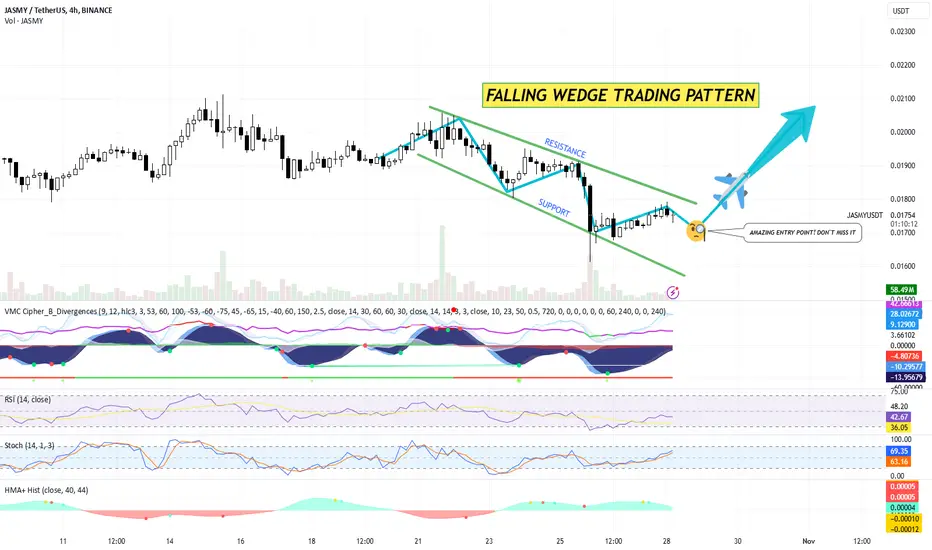
JASMY AT A PERFECT ENTRY POINT FOR A LONG POSITION! TRADE PLANTechnical Analysis by Blaž Fabjan
Pattern Identification:
The chart displays a falling wedge pattern , a bullish reversal pattern often signifying a potential trend change from bearish to bullish.
The price action is currently testing the upper boundary of the wedge pattern, indicating that a breakout could be imminent if there’s sufficient buying momentum.
Support and Resistance:
Support Line: The lower green line in the falling wedge acts as support. This line has been consistently respected, indicating strong buying interest at those levels.
Resistance Line: The upper green line marks the resistance level within the pattern. A breakout above this line would be considered a strong bullish signal.
Volume Analysis:
There’s a noticeable decrease in volume within the wedge, which aligns with typical falling wedge characteristics. Look for a volume increase on a breakout to confirm the move.
Indicators:
VMC Cipher: Divergences and buy signals have been detected, showing signs of potential momentum shifts.
RSI: At around 41.07, the RSI is approaching the neutral zone (50), suggesting the potential for further upside if it breaks above 50.
Stochastic: Currently around 60.48, indicating upward momentum and possibly further bullish action if it continues moving up.
HMA+ Histogram: Showing minor bullish signals that could align with a breakout confirmation.
Entry Signal:
The wedge breakout zone is highlighted as an “Amazing Entry Point.” The suggested entry is around the resistance line in the pattern, currently close to $0.01743.
Trading Plan
Entry:
Enter a long position once JASMY/USDT breaks and closes above the falling wedge resistance line with increased volume. This would be near or slightly above the $0.0175 level, depending on price action confirmation.
Stop Loss:
Place a stop loss slightly below the wedge’s recent support level or just below the most recent swing low at around $0.016 to mitigate risk.
Take Profit Levels:
First Take Profit (TP1): Set around the recent swing high near $0.019.
Second Take Profit (TP2): For a more extended target, aim around $0.0205, where the price previously found resistance.
Final Take Profit (TP3): Around $0.022, aligning with previous higher resistance levels.
Risk Management:
Calculate position size to risk no more than 1-2% of your trading account per trade.
Monitor volume closely, as a breakout with low volume may indicate a false breakout, in which case exiting the trade early could be advisable.
Alternative Scenario:
If the price fails to break the resistance and moves back within the wedge, refrain from entering. In this case, wait for a possible retest of the support level around $0.016 as a secondary entry point.
Summary
Pattern: Falling Wedge (Bullish).
Buy Zone: Above $0.0175, confirmed with volume.
Stop Loss: Below $0.016.
Take Profit Targets: $0.019 (TP1), $0.0205 (TP2), $0.022 (TP3).
btw: VERY GOOD ENTRY POINT AT THE MOMENT!
I`ll take long at 62400 or 60 500 key zoneI`ll take long at 62400 or 60 500 key zone
Bitcoin did big rise and price need to take SL of retails before GO on
best area for a new trade is at
- range low $62400
or
- Anchor vWAP 60 500 area
in both cases best confirmation would be SL hunt or big trap

BTC Bitcoin Brief Rise, But Correction LoomsIf you haven`t sold the top on Bitcoin:
Now you need to know that as the Federal Reserve's highly anticipated rate cut approaches, the market is bracing for potential volatility, and Bitcoin could be no exception. While many expect a modest 25 basis point cut, a more aggressive 50 basis point reduction is also on the table. This larger-than-expected move could trigger a “buy the rumor, sell the news” scenario, affecting not only traditional assets like the S&P 500 (SPY) and Nasdaq 100 (QQQ) but also risk assets like Bitcoin.
Initially, Bitcoin may see a slight uptick in price at the beginning of next week. This short-term rise could be fueled by optimism and increased demand for alternative assets as the market digests the Fed's decision. Bitcoin has historically benefited from periods of loose monetary policy, and in the immediate aftermath of the rate cut, it might experience some buying pressure.
However, this rally could be short-lived. With broader markets such as SPY and QQQ expected to correct following the Fed decision, Bitcoin is likely to follow suit. Given its high correlation with risk-on assets during periods of market stress, Bitcoin may see a sharp pullback as traditional equity markets start to sell off. Traders could also unwind their positions in Bitcoin alongside stocks, leading to a broader market correction in both traditional and crypto assets.
In the short term, a Fed rate cut that exceeds expectations might signal concerns about the underlying economy, leading to heightened volatility across the board. As risk appetite wanes, Bitcoin's upward momentum could quickly reverse, aligning with the expected correction in SPY and QQQ.

FAIR VALUE GAP REJECTION ON BTC ON THE 3 MONTH CHART.yes. I see... the 3 month chart... a fair value gap. this 3 month candle about to close soon. if this is a rejection then expect more upside on BTC.

Bitcoin, take a trade with me!Bitcoin, take a trade with me!
In a previus analysis, i shared that the best area for taking long is $57k area
Price follows our plan. Everthing looks like price will go up and take $62k or even $64400 key zone
I`ll take a trade in a case of SL hunt or Big oi rise
watch full plan to follow me

BTC/USDT IS BITCOIN READY FOR A NEW HIGH TO 74KBTC did a great increase from the bottom trend to around 68K as we also made an update about it from the bottom 53k.
68K is an important key level.. the next confirmation is important for the 74K trend
BTC should hold the 65K for a healthy trend. if the trends get confirmed we could see soon
74K.
BTC can take time before entering the end target.
we will follow the trend to see if there are confirmations.
New updates will come by this chart link.
This update is not trading advice. Trading and investing can be risky.

BTC Analisys Double bottom BOUNCE ! Just as predicted !
Bitcoin is doing exactly the double test we predicted in order to rebound with bullish momentum. We could see Bitcoin between 68 and 70 again in the coming days, maybe next week.
We are in the profit zone ! If you followed my analysis from weeks ago, you should be in the green with no problem! Congratulations!

THIS BTC CONFIRMATION CAN GET BTC TO 75KBTC looks interesting over the next time frames and it can show more increase. That's why we're keeping an eye on Bitcoin at this moment.
$68540 is a key confirmation zone. this level has already a confirmed, there's a high chance it could reach $75K - in the long term, and hype times can make the coin to the target faster.
Remember, there are no guarantees in the market. Always follow a consistent system based on your strategies and analysis.
Good times, everyone.
This update is not trading or financial advice.

GOLD/USD - Descending Triangle ( Bullish or Bearish Outcome) Good morning Traders ☕️
As we saw with the BTC/USD and Forex market the same counts for gold, the market is uncertain. This is due to war, inflation and some other factors slowing the bulls down. GOLD is no exception to this, we could potentially see either a bullish or bearish out break coming very soon. This break out will hopefully be upwards and this could spark a run to all time hime high on both gold and bitcoin.
Regardless I will be on the charts within these uncertain times, and I advise everyone to stay on the charts when they trade. It is imperative that you allow yourself to see shifts in the market.
Best of luck with your trading journey ❤️ and remember to follow the big 5 rules:
1.) Never enter a trade without a profit target and a stop loss.
2.) Always use multiple indicators to confirm a trade.
3.) Don't be greedy.
4.) If you lose take the day off and come back tomorrow.
5.) Do your own due diligence and analysis (market, technical and fundamental)

APT - trapped sellers after 36% dropAPT - trapped sellers after 36% drop
APT dropped 36% since high $19.33
at this moment open interest started rising a lot with the NEgative delta
In most cases after such a drop short sellers become trapped and prices go oppositely to take their SL
In a video i share with u 3 ideas of how to take trades and potential targets

USDCHF, Head and Shoulder PatternA break and close of price below neckline on the 4hr time frame would indicate a selling opportunity for this pair

DOGE-USDT | 4H | TECHNICAL CHART Hello traders, BINANCE:DOGEUSDT I have determined the formation target on the chart. I wish everyone success.
Like and comment if you find value in our analysis.
Feel free to post your ideas and questions at the comments section.
PS: Thank you very much that you support me with your likes and Comments
If you have another analysis at this pair, please share in comments, I will be glad to discuss with you.

BTC - Trading plan for todayBTC - Trading plan for today
Price did several SL hunts yesterday that's why we see a local reversal
In a video, i shared with you ideas for
- SHort
1) at 70k area
2) after range with SL hunts at high
Low possible after
1. Big liquidation even
2. Or range and break out
and watch the full plan

#Bitcoin Update Alert #Bitcoin Update Alert
#BTC just broke through a key support level.
➡️ Breakdown ✅
➡️ Retest ✅
Eyes on the Prize: If BTCUSDT doesn't crack $71,300, we might be zooming down to see $66,800 & $64,800 levels next.
Support Zones: $66,800/$64,800
Resistance Level: $71,300
Stay tuned and trade wisely.
#Crypto #BTCUSDT

It seems that Bitcoin is getting ready for a good jumpIf the cup handle pattern is completed and the resistance is broken at the indicated place, there is a high probability that Bitcoin will be bullish to reach the specified goals.
Please leave your comments for me.
#Bitcoin

Short btcBtc is taking rejection from supply zone
And have a rassistanc if
Not sustain bullish movement one can plan for short side in btc with strick stop loss
