BITCOIN Range Potential! Sell!
Hello,Traders!
BITCOIN is trading in what seems to be a bearish pennant
Which in itself makes me bearish on BTC
Even though the current price action is move on the bullish side
However, I think that a range between the two levels
Of support 28-30k and resistance 40-43k
Is more than possible at least for a while
Which would give us a great opportunity to trade it off the two levels
Sell!
Like, comment and subscribe to boost your trading!
See other ideas below too!
Bitcoin-trading

Bitcoin, Tests Main Trend-Line, Potential Scenarios Upcoming! Hi,
Welcome to this analysis about Bitcoin, we are looking at the 12-hour timeframe perspectives. Since Bitcoin in recent times has shown up with the high bearish volatility to the downside it has tested this major ascending-support-line marked in my chart in black from where it now initially bounced to the upside and is slowly building up. I mentioned already the triangle on the local perspective which is likely to break out to the upside and when this happens Bitcoin will move on to test the main upper support as shown in my chart after the likely pullback moves on from there Bitcoin will either have the ability to stabilize above and build upon it or move below the trend-line and form the wave-C-extension as shown in my chart. As Bitcoin has some solid supports lying in the structure the bullish stabilization after the wave-count and further continuation have a higher likelihood however it is highly necessary to keep patient on the final validations before moving into the direction.
In this manner, thank you for watching the analysis and great contentment for everybody supporting, all the best!
"The high destiny of the market is to explicate rather than to speculate."
Information provided is only educational and should not be used to take action in the market.

BTC, Continues Triangle-Development, How It Finally Completes!Hi,
Welcome to this update-analysis about Bitcoin, we are looking at the 4-hour timeframe perspectives. Since the origin-analysis Bitcoin continued with the wave-count within the triangle formation and almost completed it with the finalization of wave E. Now Bitcoin is building up in the structure and recently already moved above this descending-trend-line marked dashed, when Bitcoin now manages to continue to hold this zone and show up with further stabilization above this can lead to the final breakout and continuation above as marked in my chart, therefore it is highly necessary that Bitcoin does not fall below the orange supports as this will possibly invalidate the whole formation, it will be an important development ahead.
In this manner, thank you for watching the analysis and great contentment for everybody supporting, all the best!
"Good luck is when opportunity meets preparation."
Information provided is only educational and should not be used to take action in the market.

BITCOIN (BTCUSD) – Week 22 – Between S/R areasAccording to statistics from itBit, PayPal's custodian, bitcoin volumes have set a new high of more than $300 million. Volumes increased from about $80 million per day to surpass the previous high of $240 million in January. Last week, bitcoin briefly surpassed $30,000, indicating that retail investors purchased the dip with bitcoin presently ranging.
The Bank of Japan's governor, Haruhiko Kuroda, has joined the list of central bankers targeting Bitcoin (BTC) during the present turmoil. Kuroda argued against the value proposition of the biggest cryptocurrency by market capitalization, according to a Bloomberg story published on Friday.
The Chairman and Chief Executive Officer of JPMorgan Chase and Co, Jamie Dimon, stated in a recent testimony to the U.S House Financial Service Committee that his personal advice to people when he’s asked about Bitcoin is to “stay away from it”. Furthermore, Dimon added that cryptocurrencies can’t compare with traditional fiat currencies and gold and warned: “buyers beware.”
Technically, Bitcoin is still in the area between the resistance and the support levels marked on the chart. The higher probability move in our opinion is a continuation of the sharp downtrend that started in the middle of April. If there is an up move that breaks the resistance sharply and consolidates above, we shall make a decision about the potential reversal of this downtrend.
Trade with care.
Best regards,
Financial Flagship
Disclaimer: The analysis provided is purely informative and it should not be used as financial advice. Remember that you need a plan before you start trading; so, take this knowledge and use it as a guidebook that will ultimately help you understand the market and easily predict your next move.

Price action was too much! We need to cool down as well as BTCGold made a huge gain like ETH. We have seen a nearly parabolic rise with Gold, just as ETH did. For now I am waiting for a retest to go back to the "normal" price. The breakout form the bullish trend was really epic, and we managed to close half of our long position from 1750$ at the 1850$ level. Our 2nd target was at 1950$ but I had a feeling that we are ready to do a correction so we closed the other half of our position at 1900$. Right now I am looking for short and once we finished the corrective move. You can see our possible trade on the chart. To get more info please join our community to get some really deep level analysis about FX, Stocks, Crypto and Commodities.
community.protradersnetwork.com

BTC, Establishes Broadening-Wedge, How A Breakout Can Emerge!Hi,
Welcome to this analysis about Bitcoin, we are looking at the hourly timeframe perspectives. As Bitcoin recently initially bounced to the upside it is forming somewhat of a consolidational movement, such movements have the tendency to break out sooner or later to the upside or downside. Besides that I discovered the main broadening-wedge-formation Bitcoin is establishing with these movements and with the coherent wave-count within already completing waves A and B in the minor wave-count with the wave C remaining, when this wave C ending manages to bounce within the lower boundary it will be the completion of the major wave B in the structure and in this case is likely to be the origin of a breakout to the upside which will fully develop with a breakout above the upper boundary.
In this manner, thank you for watching the analysis and great contentment for everybody supporting, all the best!
"The key to success is to focus on goals, not obstacles."
Information provided is only educational and should not be used to take action in the market.

Bitcoin, Since Mingling In Range, Upcoming Perspectives!Hi,
Welcome to this analysis about Bitcoin, we are looking at the 12-hours timeframe perspectives. Since Bitcoin moved on with the bearish exaggeration it reached serious remaining support-zones in the structure especially determined by the ascending-trend-line marked in dashed grey where Bitcoin initially bounced. Besides that Bitcoin has established this main wave-count with the waves A to C almost already finished and now with the wave D to likely have its origins within the ascending-support-level as marked in my chart however this wave D will run directly into the upper resistance-cluster from where a pullback is very likely and therefore will be the origin of wave E which, this wave E has the ability to finish within the ascending-support and show up with a bounce from there otherwise when this does not happen Bitcoin will move on further with a wave-E-extension when it closes below the support as shown in my chart, it will be an important development ahead.
In this manner, thank you for watching the analysis and great contentment for everybody supporting, all the best!
"The high destiny of the market is to explicate rather than to speculate."
Information provided is only educational and should not be used to take action in the market.
Bitcoin, Develops Triangle-Formation, Upcoming Scenarios!Hi,
Welcome to this analysis about Bitcoin, we are looking at the 4-hour timeframe perspectives. As Bitcoin recently marked these initial lows in the structure it bounced initially to the upside however did not yet fully convert this into a sufficient reversal. Besides that, I discovered this main triangle-formation Bitcoin is now developing with the boundaries marked in blue and the coherent wave-count within the formation already completing the waves A to D in the structure, as Bitcoin approaches the upper-boundary this is likely to be the origin of the wave E to the downside that will move into the decision-cluster in the lower boundary after that the actual crucial price-actions will come with Bitcoin either forming the breakout to the upside which has a higher possibility with 65% or to the downside which has a possibility of 35%. These are the meaningful scenarios in the upcoming times and it is necessary to keep patient and wait for the final confirmation before moving in the direction.
In this manner, thank you for watching the analysis and great contentment for everybody supporting, all the best!
"There are many roads to prosperity, but one must be taken."
Information provided is only educational and should not be used to take action in the market.

DOGE COIN DAILY HEAD AND SHOULDERS PATTERNTHOUGHT I WOULD MAKE A CLEAN NAKED CHART FOR EVERYONE SO U CAN CLEARLY SEE THIS HUGE BEARISH PATTERN THAT WILL MOST LIKELY GO TO TARGETS AS LOW AS .8 CENTS, WOW sorry for all you dodgy bag holders, just remember buying oppertunity later and great short trade now for a win win double profits and double/triple your bags. SHA256BITTRADER

Bitcoin, On The Verge To A New Volatile Middle-Term-Cycle!Hi,
Welcome to this analysis about Bitcoin, we are looking at the 12-hour timeframe perspectives. Over the past years, Bitcoin and Cryptocurrency established as the most volatile asset-class seen in 21th century, it was the subject of high volatile price-moves and exaggeration both in the up as well as the downside, as traders it is important to properly keep track of that and take proper measures to advance further. Although the conditions change always and the market landscape alters with new market participants coming in as well as changing fundamentals it is likely that this high volatility will keep also in the future, in this case, it is of high necessity to properly prepare for such changing determinations as this is what is necessary in keeping a consistent trading-approach.
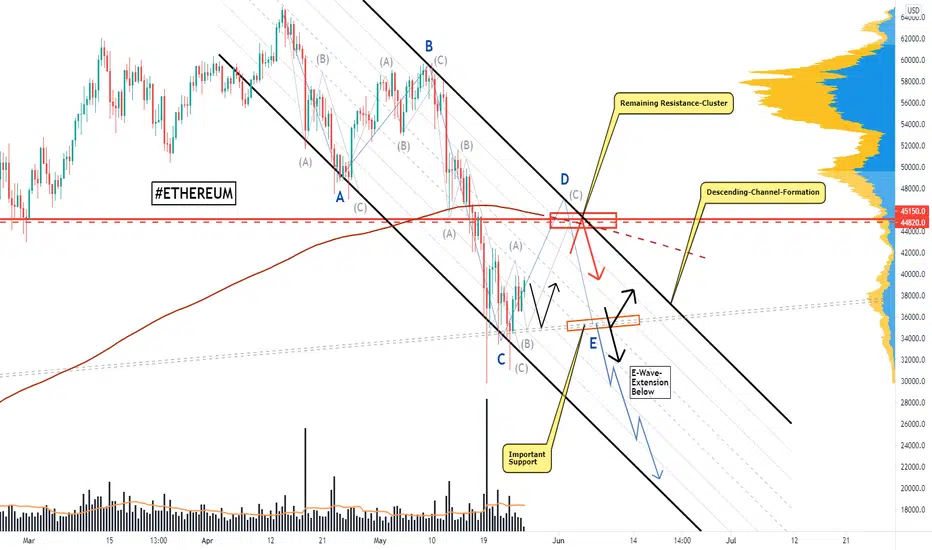
As when looking at my chart now we can watch there that Bitcoin has established this major descending-channel-formation marked with the black boundaries and the coherent wave-count within the formation with the waves A to C already completed and with the wave C recently moving into the lower boundary from where the origin of the wave D is likely to show up, this wave D will be crucial as it will run directly into the upper resistance-cluster from where the wave E development is not far away, when this wave E has finalized and Bitcoin moved to the downside to test the lower levels of support this will be the development where a reversal and continued stabilization gets highly likely especially as Bitcoin completed the wave-count and moved into a high overbought condition.
In this manner, thank you for watching the analysis and great contentment for everybody supporting, all the best!
"There are many roads to prosperity, but one must be taken."
Information provided is only educational and should not be used to take action in the market.

Bitcoin, Potential H-S-Formation, Here Is How It Completes!Hi,
Welcome to this analysis about Bitcoin, we are looking at the 45-minute timeframe perspectives. Since Bitcoin showed up with the heavy bearish volatility to the downside it somewhat managed to recover initially and bounce in the structure however did not yet rightly converted this into a sufficient reversal. Besides that now I discovered this potential inverse head-and-shoulder-formation with the left shoulder and the head already formed, therefore, currently Bitcoin is about to establish the right shoulder in the structure and when this right shoulder completes with Bitcoin moving finally above the neckline to close there as it is marked in my chart this will lie ground for further developments and especially the paramount remaining resistance to be tested.
In this manner, thank you for watching the analysis and great contentment for everybody supporting, all the best!
"Good luck is when opportunity meets preparation."
Information provided is only educational and should not be used to take action in the market.

Bitcoin First Resistance is 42000.Bitcoin's daily MACD is still oversold. I think it has made a big top, but the huge reversal candle yesterday has to be respected.

BTC Tests 3.7 Months Support, Recapitulation In Volatile Market!Hi,
Welcome to this analysis about Bitcoin, we are looking at the daily timeframe perspectives and what happened lastly with the objections of what possible scenarios we can expect in these circumstances now. Bitcoin lastly exaggerated and protracted with its bearishness moving into very very significant support determined by the blue support line marked in my chart at the 30000 USD level, this support was established almost 3.7 months ago and it is highly necessary to hold sustainably because below this support mainly stop loss are going to be triggered very likely. Therefore when Bitcoin manages the stabilization above the support it can be a good origin for possible further continuations with the wave-count to finish otherwise when this does not happen Bitcoin will move on with this wave-C-extension when closing below the dynamic ascending-support-line.
In this manner, thank you for watching the analysis and great contentment for everybody supporting, all the best!
"There are many roads to prosperity, but one must be taken."
Information provided is only educational and should not be used to take action in the market.

Bitcoin, Develops Channel-Formation, How A Breakout Can Emerge!Hi,
Welcome to this analysis about Bitcoin, we are looking at the 45-minute timeframe perspectives. Bitcoin lastly protracted its bearish developments to the downside and moved on to test important remaining support-zones especially on the more global perspective there is meaningful support between the 38.000 to 39.000 USD level where Bitcoin has the ability to initially increase with bullish price-action in the upcoming times and when this price-action is strong enough this can finally convert into a breakout after which Bitcoin closes above the upper-boundary of the channel, such a determination will be the indication for the further continuations and testing of the remaining upper-resistances from where the situation needs to be elevated anew.
In this manner, thank you for watching the analysis and great contentment for everybody supporting, all the best!
"There are many roads to prosperity, but one must be taken."
Information provided is only educational and should not be used to take action in the market.

Bitcoin, These Scenarios Necessary For A Determined Reversal!Hi,
Welcome to this analysis about Bitcoin, we are looking at the 12-hour timeframe perspectives. Bitcoin in recent times moved on with further legs to the downside, besides that now I discovered a major descending-channel-formation that Bitcoin has developed lastly marked with the black boundaries in my chart. Within this channel, Bitcoin has the coherent wave-count with the waves A to C completed, and now the wave D is likely to move on and test the upper main resistance-cluster from where a pullback and therefore origin of the wave E is highly likely after that the crucial developments will come when Bitcoin testing the lower levels of support and the back-up-cluster, when Bitcoin manages to emerge with a sustainable stabilization within there this can possibly lead to a channel breakout, however, therefore, it is highly necessary that Bitcoin manages this stabilization otherwise bearish pressures can increase further.
In this manner, thank you for watching the analysis and great contentment for everybody supporting, all the best!
"The key to success is to focus on goals, not obstacles."
Information provided is only educational and should not be used to take action in the market.

BITCOIN | Inside a Buying Area!Hi,
At the moment, the price of Bitcoin trades inside a possible buying zone. Criteria are quite good and at least a short-term bounce should come from the current area.
Considering long-term buyers then, we still might see lower prices so, be careful with that because 50% correction from the top can still happen ;)
Criteria:
1. Equal waves of AB=CD
2. Channel projection
3. Resistance becomes support
4. Daily EMA200 (haven't touched it over a year)
5. Round number 40k
6. Fibonacci rejection
7. Inefficiency around the current price
Target: 46-50k
Stay healthy,
Vaido

BITCOIN (BTCUSD) – Week 20 – Bigger correctionThe week that passed was full of news and volatility for the leading cryptocurrency of the world. According to a tweet from Tesla CEO Elon Musk on Wednesday, the company has “suspended car transactions using bitcoin” due to concerns about the “rapidly increasing use of fossil fuels for bitcoin mining.” The price of bitcoin dropped about 5% in the first minutes after Musk’s announcement.
However, there are also bullish signs ahead for the long-term future of Bitcoin. Square, the crypto-friendly digital payments provider, has confirmed to Decrypt that it has no intention to adjust its Bitcoin investment policy and MicroStrategy is undeterred by the $300 billion crypto market crash caused by Elon Musk, and continues to invest millions in Bitcoin.
Technically, it seems that Bitcoin is consolidating in the area of $50k USD for one move down. So, for this pair we are short term bearish. Potential target for reversal is the strong support area at $43k USD. Even if there is a possibility for a bigger correction with the price going higher, if the price stays below resistance on the chart, we expect one more down wave.
Trade with care.
Best regards,
Financial Flagship
Disclaimer: The analysis provided is purely informative and it should not be used as financial advice. Remember that you need a plan before you start trading; so, take this knowledge and use it as a guidebook that will ultimately help you understand the market and easily predict your next move.
🌍 Website: www.finflagship.com
👉 Youtube Channel: www.youtube.com

Bitcoin, Since Heavy Pullbacks, These Scenario To Consider!Hi,
Welcome to this analysis about Bitcoin, we are looking at the 2-hour timeframe perspectives. After the news yesterday came in that Tesla won't accept Bitcoin anymore because of the harmful emissions resulting from mining Bitcoin the price heavily moved to the downside with this volatile bearish price-action, which was expected sooner or later, and now the events exaggerated. At present Bitcoin is likely to move on to test the remaining upper resistance as marked in my chart and after that show up with the actual crucial decisions with either holding this main ascending-trend-line and stabilizing above it or moving below it which will result in a wave-C-extension to the downside. These are the two main scenarios important in the next times and it is necessary to wait for the proper validations before moving into the final right direction.
In this manner, thank you for watching the analysis and great contentment for everybody supporting, all the best!
"The high destiny of the market is to explicate rather than to speculate."
Information provided is only educational and should not be used to take action in the market.

This Is Why Bitcoin Can Jump To Test Crucial Resistance Anew!Hi,
Welcome to this analysis about Bitcoin, we are looking at the 3-hour timeframe perspectives. Bitcoin in recent times is holding its established range in the structure where it severely pulled back bearishly from the main upper-resistance marked in red. Now in the current structure Bitcoin is forming this main descending triangle-formation that has the ability to complete in the next times and when this happens Bitcoin will move on further with alignments to test the major upper-resistance anew where a next pullback is highly likely and should be expected after that it has to be elevated if Bitcoin finally breaks down bearish below its range or manages to hold the supports sustainably, it will be definitely interesting and important development.
In this manner, thank you for watching the analysis and great contentment for everybody supporting, all the best!
"There are many roads to prosperity but one must be taken."
Information provided is only educational and should not be used to take action in the market.

Bitcoin, Approaches Decisive Zones, These Scenarios Important!Hi,
Welcome to this analysis about Bitcoin, we are looking at the 4-hour timeframe perspectives. Bitcoin in recent times somewhat recovered from its heavy bearish downside price-action however did not yet manage to fully confirm to a sufficient finalized reversal with continuation-potentials. Now Bitcoin is trading within this main ascending-channel-formation where is has the coherent wave-count within and still, this important resistance-cluster above that should not be underestimated, when Bitcoin moves into these zones it is likely that a pullback firstly establishes rather than Bitcoin moving through these zones right away, when Bitcoin closes below the lower boundary this will indicate certainly lower levels to be tested firstly.
In this manner, thank you for watching the analysis and great contentment for everybody supporting, all the best!
"Trading effectively is about assessing possibilities, not certainties."
Information provided is only educational and should not be used to take action in the market.

Bitcoin, In Crucial Decision-Zone, Upcoming Perspectives!Hi,
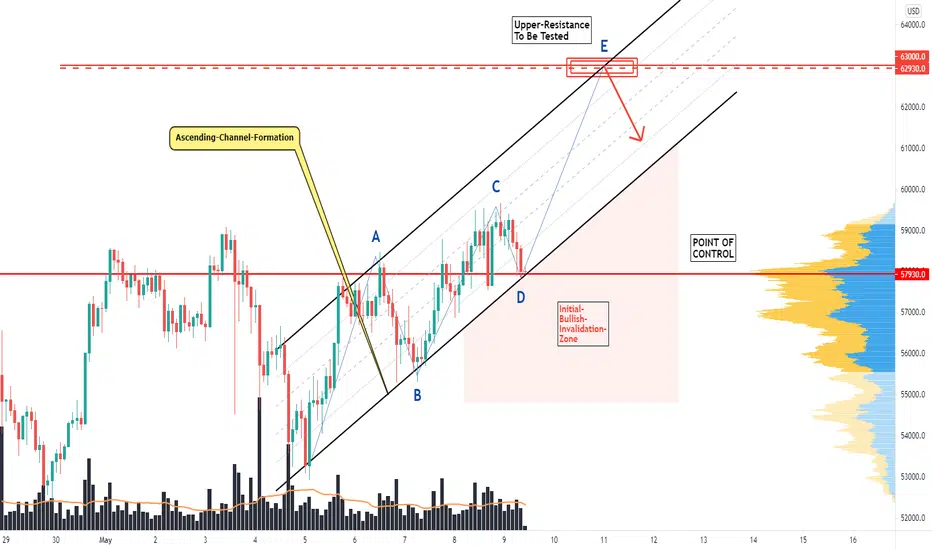
Welcome to this analysis about Bitcoin, we are looking at the 2-hour timeframe perspectives. Since Bitcoin has established somewhat of an initial bullish pace it moved on to test important remaining resistances in the structures. Besides that as I discovered now Bitcoin has developed this ascending-channel-formation where it has room to move on further however it will run directly into the remaining upper resistances marked in red where further decisions need to be made and it needs to be shown if Bitcoin manages to stabilize in these regions or firstly sets up to form pullbacks moving to lower levels. Taking all these factors into the consideration it is necessary that Bitcoin holds the lower boundary and does not visit the invalidation zone.
In this manner, thank you for watching the analysis and great contentment for everybody supporting, all the best!
"There are many roads to prosperity but one must be taken."
Information provided is only educational and should not be used to take action in the market.
BITCOIN - Shorterm #27TP1 collected...
MONSTER BOT — Today at 9:33 AM
#SM.DUNZA-BTCUSD-30min #BYBIT #BTCUSD
Close short position if opened.
OPEN NEW/ADD TO LONG POSITION
Enter around: 58237.5
TAKE PROFIT:
59169.5, 59693.5, 60974.5, 61790, 63420.5,
STOPLOSS:
54743.25,
We recommend moving stoploss to break even once the first TP is hit
Signal issued at 2021-05-08T07:00:00Z

Bitcoin, Triangle-Formation In The Structure, How It Completes!Hi,
Welcome to this analysis about Bitcoin, we are looking at the 2-hour timeframe perspectives. As expected previously Bitcoin managed to break out above its descending triangle I mentioned in the previous analysis and now moved on to test the remaining resistances in the structure. Now Bitcoin holds above the 55- as well as the 25-EMA and besides that is building this decisive triangle-formation there with the coherent wave-count within which will complete within the next times. When the wave-count completes and Bitcoin breaks out above the upper boundary with a solid bullish price-move as shown in my chart Bitcoin will be ready to move on further bullishly to the upside and at least appoint the upper-resistances remaining when the bullish edges establish rightly.
In this manner, thank you for watching the analysis and great contentment for everybody supporting, all the best!
"Trading effectively is about assessing possibilities, not certainties."
Information provided is only educational and should not be used to take action in the market.
