BITCOIN (BTCUSD) – Week 16 – Short-term correction?Coinbase, the largest cryptocurrency exchange in the U.S., became a public company this past week with the ticker COIN, driving the price of BTC past $65,000 USD. Bitfarms, a Canadian bitcoin mining firm, has announced that it is nearly finished with the procedures needed to be listed on the Nasdaq exchange. Bitfarms said in a press release that it is closely monitoring the listing and has filed the 2020 Annual Information with the Securities Exchange Commission. If the SEC approves Bitfarm's submission, it will become the latest crypto-focused company to list on the exchange.
Following months of economic turmoil that prompted locals to exchange their local currency for bitcoin and foreign currencies, Turkey would outlaw the use of cryptocurrency as a type of payment. Cryptocurrencies are excessively risky, according to Turkey's central bank, which may be used for illicit activities. Crypto funds are also “neither subject to any oversight and monitoring processes nor a single regulatory authority,” according to the bank.
Technically, on the 4h timeframe we are seeing a consolidation that has a high probability of breaking to the upside. One scenario however is a deeper pullback to the support area marked on the chart or the blue trendline and then shooting higher to new highs.
Trade with care.
Best regards,
Financial Flagship
Disclaimer: The analysis provided is purely informative and it should not be used as financial advice. Remember that you need a plan before you start trading; so, take this knowledge and use it as a guidebook that will ultimately help you understand the market and easily predict your next move.
Bitcoin-trading

(1H) S.TRIANGLE LOOKING TO BREAK RESISTANCE BULLISHI’m looking to put in a long after a bullish break and candle close above (resistance) of the symmetrical triangle on the (1H) time frame, if it breaks and closes above 62,500.00 then I’m looking to put in a long position, put my stop loss below the support 61,700.00 aprox (1 ATR) below , we’re looking for price to hit target of highs 65k but we have 2 resistance at 63,946 and 62,588.00 if we are successful in breaking both resistance levels we should be looking at a target of price at bitcoins high and possibly a new ATH, I’m using a new strategy using both Alexander elders (IMPULSE) system using his 13-EMA and replacing it with a 15-EMA trigger , I’m using 3-4 of his indicators/strategy and also CHRIS MOODYS indicators like his MACD, EMA TRENDBARS, and PSAR As well as TORYS Hidden divergence, with using the ATR for stop losses and using support/resistance linear regression Chanel’s , I believe the sweat spot is the 15-EMA right in between the 9-EMA AND 21-EMA , waiting for a bullish cross just gives me a lot of confirmation and confidence in my position. Anyway if u want to know more about my new strategy for bitcoin trading “THE MOODY ELDERLY 15-EMA X STRATEGY “ the X is for how much maximum and sweat spot again 15X leverage , anymore you will have hard time getting a good risk/reward and to be able to us the ATR average true range correctly and successfully,

Bitcoin, Descending-Channel, How Decisive Breakout Determines!Hi,
Welcome to this analysis about Bitcoin, we are looking at the hourly timeframe perspectives. As already mentioned in previous analysis Bitcoin had some sufficient supports lying in the 60500 regions which now confirmed as such and Bitcoin initially bounced there, besides that I discovered Bitcoin forming the descending-channel-formation with the coherent wave-count from A to C already completed as marked in my chart. Now when Bitcoin manages to stabilize further below the boundary to finally show up with a breakout as shown in my chart this will lead to further continuations and testing of remaining resistance, it will be important how Bitcoin approaches these as there can come further bullish developments when Bitcoin closes above resistance.
In this manner, thank you for watching the analysis and great contentment for everybody supporting, all the best!
"Trading effectively is about assessing possibilities, not certainties."
Information provided is only educational and should not be used to take action in the market.

Correction for BTCUSDT 4hMy upcoming analysis for BTC. This white trend line is indicating 2 possible correction to Blue Trend line. Purple arrow is the final part of this correction. Let's hope BTC rise after touching blue trend line.
Comments are welcome. I am new and learning. :)

BITCOIN | Buying Opportunity!Hi,
Sorry, I don't have much time but I wanted to point out a possible buying area - quite a decent criteria matching around the round number 60k. Technically a great zone is inside "the box"
1. Channel projection
2. AB=CD
3. Different Fibo levels
4. Round number
5. Strong horizontal prize zone
6. The trendline
Stay healthy,
Vaido

BTC, Completes Prospected Alignements, Next Perspectives Now!Hi,
Welcome to this update-analysis about Bitcoin, looking at the 6-hour timeframe perspective. If you did not see the origin-analysis already I highly recommend it to watch to have a full-depth-overview. Now as Bitcoin rightly completed the bullish breakout and continuation into the upper dynamic-target-zone where it completed the wave-count and shown up with the expected pullbacks it is pointing to the lower levels of support marked in my chart with the blue box where several supports coming together, when Bitcoin manages to bounce in this zone it will be the great source for the next wave E to the upside however it is necessary that Bitcoin really holds and bounces in this level because a close below can indicate further bearish pressure.
In this manner, thank you for watching the analysis and great contentment for everybody supporting, all the best!
"Trading effectively is about assessing possibilities, not certainties."
Information provided is only educational and should not be used to take action in the market.

Bitcoin, In The Channel-Formation, Crucial Scenarios Upcoming!Hi,
Welcome to this analysis about Bitcoin, we are looking at the 4-hour timeframe perspective. In recent times Bitcoin managed to form new highs however every time also showed up with new bearish pullbacks in the schedule which are normally indicating a more or less supply moving into the market every time Bitcoin forms new highs which should definitely not underestimated as I discovered now Bitcoin is moving in this main ascending-channel with the confirmational-bounce-cluster likely to be the origin of the wave E that will approach the upper zones and the upper-boundary from where a new short-entry can be considered more. What comes up we are prepared in the channel we managed to execute solid trades in the last times.
In this manner, thank you for watching the analysis and great contentment for everybody supporting, all the best!
"There are many roads to prosperity but one must be taken."
Information provided is only educational and should not be used to take action in the market.

Bitcoin, Completes Head-Shoulder-Formation, Further Objections!Hi,
Welcome to this analysis about Bitcoin, we are looking at the local 15-minute timeframe perspective. As Bitcoin recent times has shown up with some strong bullish volatilities to the upside it moved into an overbought condition and now as I discovered has formed a head-and-shoulder-formation marked with the neckline in blue. This head-and-shoulder-formation already completed with this bearish move below the neckline which it is now confirming as it is shown in my chart, this confirmation activates the downside targets between 61200-61400 which are als supports, when Bitcoin reaches out there it has to be elevated if it manages to stabilize or sets up for further bearish continuations.
In this manner, thank you for watching the analysis and great contentment for everybody supporting, all the best!
"Trading effectively is about assessing possibilities, not certainties."
Information provided is only educational and should not be used to take action in the market.

BITCOIN | Possible Targets & How To Identify Them!?Hi,
I get a lot of questions, and even I have seen a lot of bets, where the price of Bitcoin goes? So, let's do it the same! Leave a comment and tell us your thoughts about where it goes, is it 70k or 80k or 120k, name it, and say why you think so - is it just a guess or you have some technical criteria to look for. The most accurate call will win free technical analysis of your favorite altcoins ;) The game ends after we have seen at least a 17-20% correction.
The target areas.
To predict and narrow the price levels above the ATH is quite tough, luckily I have some tools which have helped me to do that. Obviously, they aren't so precise to start to short from there but they can be a good partial take profit areas.
Tools that might help you to find take profit places:
1. Channels - the upper trendline of the channel can be very precise resistance level from time to time.
2. Channel projections - quite often the price moves in channels, as you see on the image, black lines form a perfect channel. Channel projection assuming that it starts to form a channel. You need two dots to draw the trendline below the candles and one dot above the candles to copy/paste the lower trendline to the high-dot. Channel projection is the orange lines in the chart. Short-term very good to predict bounces.
3. Equal waves of AB=CD, will not explain it but perfect if the AB=CD matching perfectly with channel projection.
4. Fibonacci Extensions are also quite good to predict take profit areas.
5. Round numbers, psychological numbers.
So, using these tools I found some areas to keep an eye on. The first target area will stay around 70k. There is a minor trendline, channel projection, 2x equal waves of AB=CD, Fibo Extensions and 70k will act as a round number. At the moment, they all act as resistance levels and matching quite perfectly with each other around 70.
Always look for several criteria to narrow the target area. If you can draw multiple criteria into one place it will give much more power to the potential target/resistance area
As said previously, it is only the target area - full target, partial target, or whatever. Never try to short from these levels. You can start to think about shorting only then when the price has stopped around your identified area, has stayed there to consolidate and lower timeframes offer some price action to keep an eye on. To try to short immediately after the price has reached the area, you will burn your fingers, hands, body and etc. entirely, especially in these market conditions.
The pre-mentioned target area is currently the strongest and nearest but I have put another one a bit higher. It is not the case atm but still, a good example of the channel and AB=CD crossing area. It says slightly above 80k.
Can you jump into the possible another leg upwards? Yes, around 60k will be technically a good place for a retest.
On the weekend I shared in the other site quite a step-by-step break and a retest, which took a bit more time than expected but worked out perfectly - break above 60k and retest afterward, and here we are.
Hopefully, you found something helpful for your further analysis, especially for identifying take-profit places.
Stay healthy,
Vaido

Bitcoin, Main Triangle About To Complete In The Next Time!Hi,
Welcome to this analysis about Bitcoin, we are looking at the 2-hour timeframe perspective. As Bitcoin like expected already completed the smaller triangle bullishly to the upside, it is now building a bigger one. In this triangle marked in my chart with the black boundaries, Bitcoin is about to complete the wave-count with the wave E within the next times when this wave E ends with a sufficient bounce from the lower boundary and above the upper-boundary, as seen in my chart it will be the proper continuation-setup for the projected targets marked in blue to be reached, additionally coinbase as the first cryptocurrency exchange will be listed in the stock market tomorrow which can indicate additional potential bullish fuel to determine.
In this manner, thank you for watching the analysis and great contentment for everybody supporting, all the best!
"The high destiny of the market is to explicate rather than to speculate."
Information provided is only educational and should not be used to take action in the market.

How Bitcoin Can Reach 70.000-USD-Valuation In Upcoming Times!Hi,
Welcome to this analysis about Bitcoin, we are looking at the daily timeframe perspective. In recent times Bitcoin severely tested the 60.000 USD level which is still a resistance however when Bitcoin manages to move sufficiently above it this can lead to further volatilities and continuations therefore it is necessary that Bitcoin rightly bounces in the structure with the completion of its wave-count within the main triangle-formation marked in my chart, in this case, it is important that Bitcoin does not close below the lower boundary because this will invalidate the triangle however when Bitcoin manages the breakout above the upper boundary and this is the more possible scenario it will lie ground for further developments and pointing of the 70.000 USD level.
In this manner, thank you for watching the analysis and great contentment for everybody supporting, all the best!
"Good luck is when opportunity meets preparation."
Information provided is only educational and should not be used to take action in the market.

Bitcoin, Develops Triangle-Formation, These Scenarios Possible!Hi,
Welcome to this analysis about Bitcoin, we are looking at the hourly timeframe perspective. Since Bitcoin recently managed to breakout the above important resistance zones it is about to develop a decisive triangle as marked in my chart with the black boundaries. As already mentioned Bitcoin has established a decent bullish edge from which it has the ability to build on this is why a bullish breakout out of the triangle has a greater possibility by 65% compared to the bearish one with a possibility of 35% nevertheless it is necessary to keep patient on the proper confirmation before finally moving into the direction, when this happened the percentage target can be projected from the breakout-zone.
In this manner, thank you for watching the analysis and great contentment for everybody supporting, all the best!
"There are many roads to prosperity, but one must be taken."
Information provided is only educational and should not be used to take action in the market.

Bitcoin, Maintains Bullish Breakout, Further Determinations Now!Hi,
Welcome to this analysis about Bitcoin, we are looking at the 6-hour timeframe perspective. As mentioned in previous analysis there was a high likelihood given that Bitcoin finally shows up with bullish conclusions when the time is ripe which now happened as Bitcoin formed the breakout above important remaining resistances with a highly volatile move. Now as this major bullishness has shown up I discovered some important structural developments that will determine the upcoming destinies and especially when Bitcoin manages to bounce in the structure this can convert into worthwhile developments, therefore I detected all the important levels and likely destinies we should consider in the established structure and upcoming movements.
Structural Developments:
The bullish breakout bitcoin has formed moved rightly above the main descending-resistance-line marked in my chart in black from where Bitcoin has shown up with the actual bullish volatility after moving above this line. It is not seldom seen that after such heavy breakouts a pullback emerges firstly testing the previous zones of resistance where the price-action can stabilize and back-up to move on with further bullish developments. This will also validate the main wave C that is forming in the structure and the wave-count Bitcoin is forming as the major wave A and wave B already completed this will be the coherent origin of the main wave major wave C to show up with its sub-waves.
Upcoming Determinations:
As Bitcoin has shown up with these very good bullish alignments now it is the time to validate these breakouts and show up with further conclusions. Therefore it is necessary that Bitcoin rightly bounces within the dynamic confirmational-bounce-cluster in my chart bullishly to the upside, it is necessary that Bitcoin does not fall below this zone again because such a price-action can also invalidate the bullishness firstly however this is not the most likely scenario for now and the bullish bounce with further continuations should be more expected, when Bitcoin then finally shows up with it this will point to the dynamic target-zone marked in blue within the upper-boundary from where a pullback firstly is more likely.
In this manner, thank you for watching the analysis and great contentment for everybody supporting, all the best!
"Good luck is when opportunity meets preparation."
Information provided is only educational and should not be used to take action in the market.

BTC, MACD-Divergence And H-L-Structure Indicate Key-Protraction!Hi,
Welcome to this analysis about Bitcoin, we are looking at the daily timeframe perspectives. Since a more or less long time Bitcoin is in a phase where it searches a trend in the proper determined direction, in such situations it is necessary to do not just into trades because that is barely satisfying when it is not done on the more local timeframes and in a less big frame. Now as Bitcoins contraction goes on I discovered some very interesting signs that can alter the dynamic into a more major volatile move that will approve further directions, therefore it is necessary to assess which direction has the higher possibility this means also keeping the reverse perspective in the watch.
High-Low-Structure And Hidden Bullish Divergence:
The main ascending-channel-formation Bitcoin is trading in that is marked in my chart by the dashed black trendlines has an important structure within because Bitcoin over the last weeks and months formed this volatile structure in which it marked several higher highs and higher lows in the schedule, such a structure is normally indicating a higher high to establish again after the next lower high formed. Additionally, Bitcoin has a coherent MACD structure underlining this pre assumption as the MACD is forming lower lows together with the high-low-structure by Bitcoins price-action this is marking a hidden bullish divergence that can indicate the volatile move upcoming to establish bullishly.
Important Scenarios And Upcoming Perspectives:
With Bitcoins established structures, there is a good possibility given that a major breakout will happen sooner or later as Bitcoin shows up with these abilities therefore when Bitcoin finally manages to break out above the local descending-resistance-line into the breakout range marked in green in my chart this will be the confirmation for the next bullish continuations and the next higher high to develop in the schedule. Therefore it is necessary that Bitcoin does not show up with increased exceptionally high bearish pressure which can invalidate these conclusions. For now, it will be important to elevate how Bitcoin shows up with potential volatility and how the breakout can primarily emerge, it will be an interesting development.
In this manner, thank you for watching the analysis and great contentment for everybody supporting, all the best!
"There are many roads to prosperity, but one must be taken."
Information provided is only educational and should not be used to take action in the market.

Bitcoin, Wedge-Formation, How It Converts Into A Breakout!Hi,
Welcome to this analysis about Bitcoin, looking at the local 2-hour timeframe perspective. As Bitcoin on the more global perspectives moved on to test important remaining resistances from where it firstly pulled back and is now somewhat setting up for further price-action I discovered a decisive formation Bitcoin is now developing that will be worthwhile in the upcoming determinations especially when it completes it can show up with some valuable breakouts that can possibly lead to new highs, therefore it is necessary that Bitcoin establishes further with the right alignments and does not indicate price-actions that can invalidate the whole structure and formation again.
Structural Developments:
When looking at my chart we can watch there how Bitcoin has now developed this main descending-wedge-formation marked with the boundaries in blue, in this formation Bitcoin has a coherent wave-count in which it already completed the waves A to C in the schedule and is now setting up to form the wave D that will move on and directly run into this remaining resistance-cluster Bitcoin primarily has in the upper-boundary of the formation, when Bitcoin pulls back in this cluster bearishly to the downside it will be the origin of the wave E to the downside which will finalize the whole wave-count and will approach the lower levels of support from where the whole formation can complete as the wave-count finalizes in supports.
Upcoming Determinations:
With Bitcoin trading in such a constellation, it is important to keep patient and wait for the conclusive price-actions that will finally complete this formation, therefore it is necessary that Bitcoin sufficiently bounces within the lower back-up-cluster and when this happens with Bitcoin bouncing above the upper boundary of the formation the whole formation will be completed with activation of further continuations and Bitcoin will move on to test the remaining upper resistances again. Taking all these factors into the consideration it is necessary that Bitcoin does not show up with increased bearish pressure again because such a price-action can invalidate the whole formation with Bitcoin moving below the lower levels of support.
In this manner, thank you for watching the analysis and great contentment for everybody supporting, all the best!
"Trading effectively is about assessing possibilities, not certainties."
Information provided is only educational and should not be used to take action in the market.

#NANOBTC - A Sleeping Giant - Going inIndeed it looks like a perfect bottom:
- Accumulation followed by a double-bottom underneath it;
- Exit the accumulation zone with a HH.
A perfect setup for a Long on $NANO
TP1 short/mid-term. TP2 long-term.

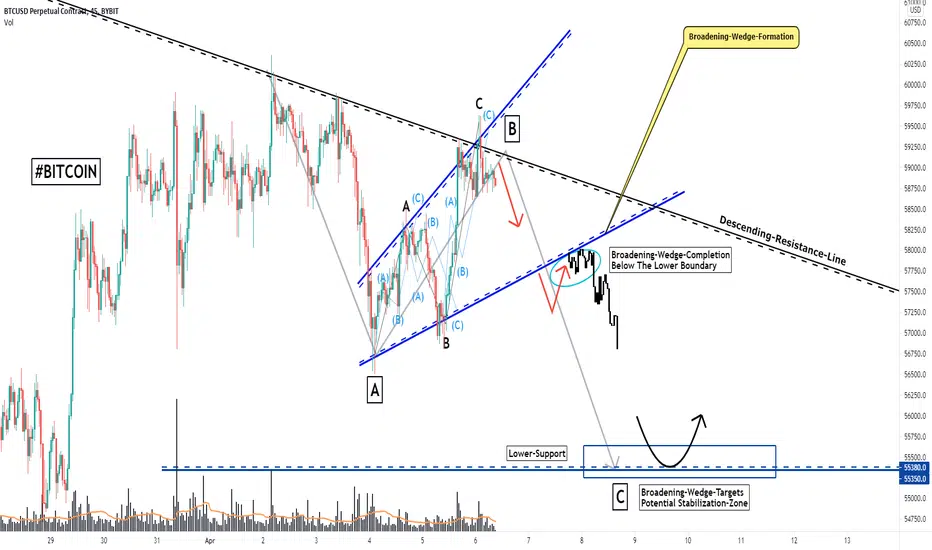
Bitcoin, Initial Broadening-Wedge-Formation, Important Levels!Hello Traders Investors And Community,
Welcome to this analysis about Bitcoin, we are looking at the 45-minute local timeframe perspective, the recent events, the established formational structure, and what we can expect in the upcoming times. Since Bitcoin initially pulled back from the 60.000 USD level due to bullish weakness it is struggling to maintain further bullish alignments and a proper bullish breakout in the schedule, this is why it is important to do not keep the bearish perspective out of sight now as in such bullish weakening pullbacks establish more easily and in this case, I discovered a decisive formation Bitcoin is forming now that will lie ground for the further determinations, therefore I detected all the important levels and likely destinies we should consider.
As when looking at my chart now we can watch there how Bitcoin is building this main broadening-wedge-formation marked with the boundaries in blue, within this formation Bitcoin has the coherent wave-count with the waves A to C almost already completed and with the ending of wave C Bitcoin ran directly into the remaining upper-resistance-zones from where it pulled back, this bearishness is likely to increase and protract the next times as the resistances lying in the structure are just too strong. Taking the continuation of the pullbacks into consideration Bitcoin will complete the whole broadening-wedge-formation with a bounce and close below the lower boundary this will lead to the pointing of the lower targets marked in my chart in blue. When Bitcoin completes this wedge-formation as suggested this does not mean Bitcoin is completely bearish as it has some solid supports lying lower in the target zones from where it has the ability to stabilize and back up again. In this case, it needs to be elevated then how Bitcoin reacts in these remaining zones and how it manages a potential back-up from there before moving further in the schedule, it will be an important and interesting development ahead.
Thank you everybody for watching the analysis, great contentment for everybody supporting, all the best!
"There are many roads to prosperity, but one must be taken."
Information provided is only educational and should not be used to take action in the market.
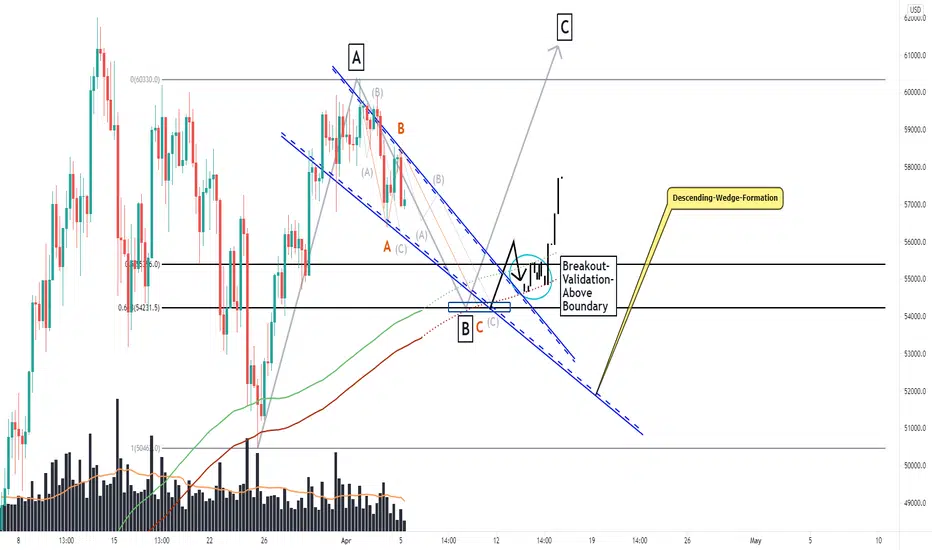
Bitcoin, Wedge-Formation, Potential Origin Of A Solid Breakout!Hello Traders Investors And Community,
Welcome to this analysis about Bitcoin, we are looking at the local 6-hour timeframe perspective, the recent events, the established formational structure, and what we can expect in the upcoming times. Since Bitcoin somewhat a little too early recovered from its bearish breakdowns it moved on to test upper resistance in which it is now mingling in the structure. In this case, now I discovered an interesting formation that can lie ground for a potential breakout and final attempts above remaining levels, therefore it is necessary for the confirmations and validations to show up before considering the direction sufficient, therefore, I detected all the important levels and likely destinies we should consider.
As when looking at my chart now we can watch there how Bitcoin is about to develop this main descending-wedge-formation marked with the boundaries in blue, within this wedge Bitcoin has the wave-count emerged with waves A and B almost completed and as Bitcoin recently pulled back from the upper-boundary already this is the origin of the wave C to the downside that will complete the whole wave-count and will run directly into this back-up-cluster marked in my chart in blue where several supports coming together and therefore has a high likelihood to show up with a bullish bounce that can convert into a breakout and completion of the triangle when Bitcoin finally bounces above the upper boundary and closes there, such a price-action as shown in my chart will activate the further continuations, developments, and the main wave C within the schedule. Nevertheless, it is highly important that Bitcoin shows up with the right price-actions and do not fall below the lower back-up-cluster with the supports lying within there because this will invalidate the whole formation, for now, it will be important on how Bitcoin approaches these zones, it will be an interesting development.
Thank you everybody for watching the analysis, great contentment for everybody supporting, all the best!
"There are many roads to prosperity, but one must be taken."
Information provided is only educational and should not be used to take action in the market.
Bitcoin, The Major Wedge-Formation Crucial In Upcoming Times!Hello Traders Investors And Community,
Welcome to this analysis about Bitcoin, we are looking at the 2-day timeframe perspective, the recent events, the established formational structure, and what we can expect in the upcoming times. Bitcoin in its established uptrend is still in an uptrend however this uptrend gets more and unstabilized with the several pullbacks Bitcoin has already shown up in recent times. This is why it is important to do not underestimate the bearish perspectives here as I also discovered the main formation that can lead to a reversal and bearish pressure firstly testing lower levels, especially in such volatile markets where prices move higher however with more volatile waves and pullbacks a major pullback can happen more swiftly than expected.
As when looking at my chart now we can watch there how Bitcoin established this major ascending-wedge-formation marked with the boundaries in blue, within this wedge Bitcoin has the coherent wave-count and already completed the waves A to D in the structure. With Bitcoin now bouncing from the lower boundary, this is the origin of the main wave E to the upside which will finalize the whole wave-count and run directly into the upper zones of resistance and Fibonacci-extension lying there which is a likely zone to be the source of a bearish pullback to the downside, when this pullback then moves on and closes below the lower boundary it will complete the whole formation and show up with further bearish continuations to test lower levels, this does not mean Bitcoin can not form new highs anymore however it means that bearish dynamics can increase more which should not be kept by side, for now, it will be important to elevate on how Bitcoin continues with the wedge-development.
Thank you everybody for watching the analysis, great contentment for everybody supporting, all the best!
"There are many roads to prosperity, but one must be taken."
Information provided is only educational and should not be used to take action in the market.

Bitcoin, Decisive Price-Action Ahead, This Scenario More Likely!Hello Traders Investors And Community,
Bitcoin recently moved into the main local resistance at the 59600 USD level and severely tested it without moving through it or pulling back in the structure, this is indicating a major move to come sooner than later and in such a situation, it is important to wage the possibilities properly to finally come to the right conclusions without overspeculating the market into one sighted direction because it is always necessary to also be prepared on the reverse-dynamic to do not get overwhelmed by circumstances, this is why I detected the underlying possibilities and main scenarios that will determine upcoming destinies, in this case, one scenario has a greater likelihood which should be more expected than the other one.
As when looking at my chart we can watch there how Bitcoin backed up since showing these bearish conclusions, since this bullish backup Bitcoin moved right away into this local resistance marked in black and testing it, this is a very important reference point because it is determining if bullish conclusions continue or not. Within this zone, Bitcoin is also developing this ascending-channel-formation marked with the dashed lines in my chart and basically, the breakout will decide the final direction. For now, the bullish breakout has a higher possibility of 65% as it is shown in my chart with the concluded mechanisms nevertheless it is necessary to keep the patient on the final validations before finally moving in this direction.
Thank you everybody for watching the analysis, great contentment for everybody supporting, have a good day and good trading, all the best!
"There are many roads to prosperity, but one must be taken."
Information provided is only educational and should not be used to take action in the market.

BTC, Elevation Of Crucial Zone, Given Potentials And Destinies!Hello Traders Investors And Community,
Welcome to this analysis about Bitcoin, we are looking at the 12-hour timeframe perspectives. In the last months and weeks, Bitcoin is highly volatile and formed several higher highs as well as higher lows with volatile moves to the up as well as to the downside which served as great moves for us in the channel to secure profits in the long as well as on the short-side. In such situations, it is important to determine what are possible realistic perspectives and what is not so likely. In this case, now I discovered an interesting formational structure Bitcoin is forming lying ground for the upcoming destinies. It is important to realize that the movements Bitcoin formed in recent times can continue as Bitcoin is still in this distribution-accumulation-dynamic.
Structural Developments:
As when looking at my chart now we can watch there how Bitcoin has formed this main ascending-channel-formation marked with the boundaries in blue. Within this channel, Bitcoin has also this major coherent wave-count with the waves A to D almost already finished and now setting up to form wave E in the schedule that will finalize the wave-count. As Bitcoin managed to bounce above this important local descending-trend-line it is the proper set-up for the continuation and protraction of wave E in the wave-count as shown in my chart. When Bitcoin manages to break out of the orange box in my chart this will be the origin for the further developments up into the distributional-range anew where the crucial decision will come up.
Upcoming Determinations:
Bitcoin is still in this main accumulational-distributional-channel-dynamic, as the recent accumulation was the origin of the current move above resistance this will lead into the distributional-range again, this is important because a next distribution, in this case, is more likely than Bitcoin right away moving through this zone, it can be a similar pattern as already shown in recent times. Therefore it will be highly necessary to elevate how Bitcoin reacts in these structures and especially as Bitcoin remains in this dynamics for now it is significantly meaningful to not underestimate the bearish scenarios and change of dynamics as it is not seldom seen in cryptocurrency.
Thank you everybody for watching the analysis, great contentment for everybody supporting, have a good day and good trading, all the best!
"There are many roads to prosperity, but one must be taken."
Information provided is only educational and should not be used to take action in the market.

BITCOIN | The Stairway to Heaven, 1 MILLION!Hi,
My well-known technical analysis (read: crystal ball) just revealed a major movement for permabulls.
YES, you see there $1.000.000 - one million - and Bitcoin will reach there at the end of October in 2023. Sorry, cannot say exact day and hour because it is free information and I have two rules of that:
1. If you know something do not share it for free.
2. Follow rule number one.
Today I'll make an exception and I will tell you step-by-step the road to the 1M.
First of all, a bigger correction comes after the price of BTC has reached to 100k, you can take ALL profits from there and the correction guides us back to 80s, wait sorry, back to 20k and obviously, you buy ALL back from there, if you can you can even borrow some more. Simple market strategy: sell high buy back from lower prices, easy!
Okay, we got our bags loaded from 20k, the price might get some corrections here and there, most likely there but the overall truth is the target. The prementioned one million per Bitcoin at the end of 2023. Simple market strategy: buy low sell high. KISS - keep it simple stupid!
Stay healthy and happy 1st of April :D
Vaido

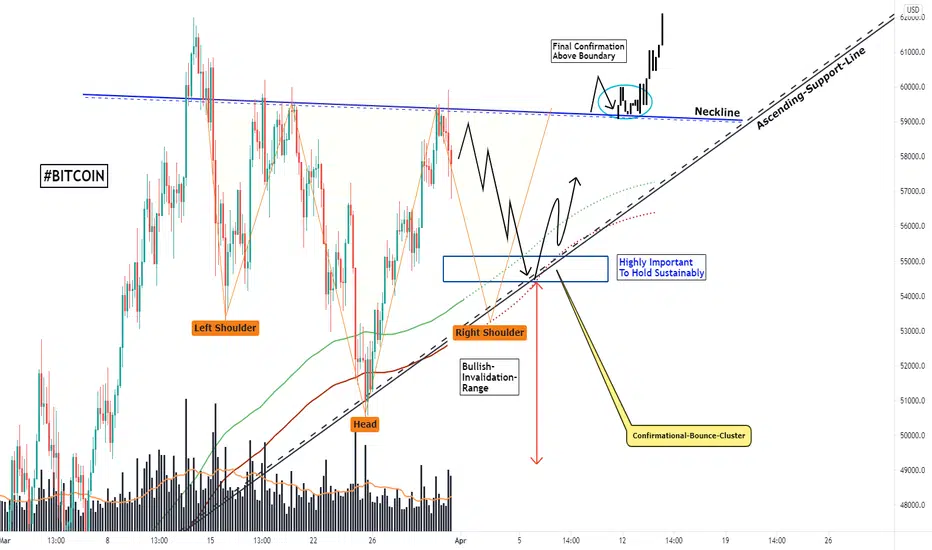
Bitcoin, Potential Inverse H-S-Formation, How It Completes!Hello Traders Investors And Community,
Welcome to this analysis about Bitcoin, we are looking at the 4-hour timeframe perspective, the recent events, the established formational structure, and what we can expect in the upcoming times. Recently Bitcoin managed to move above important resistance levels and close above them however did not yet fully shown a proper reversal in the schedule indicating further determinations nevertheless this can happen especially with the formation I discovered Bitcoin is forming that needs to show up with the proper confirmational price-action, therefore I detected all the important levels and likely destinies we should consider within the established structure and the upcoming movements ahead next times.
Structural Developments:
As when looking at my chart now we can watch there how Bitcoin is about to develop this major potential inverse head-and-shoulder-formation marked with the neckline in blue. The left shoulder as well as the head of the formation already fully completed and now Bitcoin is about to form the right shoulder within the schedule with the first move to the upside of the right shoulder already formed which will run directly into the neckline from where the rest of the right shoulder will likely have its origins. This move to the downside left will move on till there is proper support found in which Bitcoin has the ability to stabilize and back-up continuing with the development of the right shoulder and leading to a potential final confirmation.
Upcoming Determinations:
Taking all these factors into the consideration it will be important for Bitcoin to complete this right shoulder properly, therefore it is necessary that Bitcoin rightly bounces within the confirmational-bounce-cluster and do not fall below it because this can possibly invalidate the whole formation as it is shown in my chart with the bullish-invalidation-range. When Bitcoin then manages to bounce sufficiently within the supports this will lead to the breakout above the neckline, such a price-action will complete the whole formation bullishly and will show up with further continuations to the upside when Bitcoin finally closes above the neckline sustainably, it will be an interesting development ahead.
Thank you everybody for watching the analysis, great contentment for everybody supporting, have a good day and good trading, all the best!
"There are many roads to prosperity, but one must be taken."
Information provided is only educational and should not be used to take action in the market.