Bitcoin, Preliminary H-S-Formation, Upcoming Determinations!Hello Traders Investors And Community,
Welcome to this analysis about Bitcoin, we are looking at the 45-minute timeframe perspective, the recent events, the established formational structure and what we can expect in the upcoming times. Recently Bitcoin has shown up with some initial bullish moves to the upside however this bullishness ran directly into the remaining upper resistance from where a pullback to the downside initially is more likely than Bitcoin moving through this levels of resistance right away, nevertheless there is also the potential for a further recovery given, in this case now I discovered an important formation that will be worthwhile in the upcoming determinations and destinies Bitcoin will show up with, therefore I detected all meaningful levels and scenarios.
Structural Developments:
As when looking at my chart now we can watch there how Bitcoin is now about to develop this main head-and-shoulder-formation marked with the neckline in blue in my chart, within this formation Bitcoin already completed the left shoulder as well as the head within the schedule and is now about to finalize the right shoulder which is about to complete within the near times, when this right shoulder finalizes and Bitcoin moves below the neckline to close where it will complete the whole formation and activate downside targets with the alignments ahead in the structure. In this case it is necessary that the formation does not invalidate to the upside however with the established structure this is rather unlikely.
Upcoming Determinations:
Taking all these factors into the consideration now Bitcoin is trading in a situation in which the main head-and-shoulder-formation developing here is likely to confirm within the next times, it is necessary to do not keep the capability of such a formation out of sight as especially when it completes bearish price-action can gain significantly in pace. Nevertheless, Bitcoin has some good supports given also within the target-zone as there is the 61.8% Fibonacci-support as well as horizontal-support marked in my chart in blue, therefore, when Bitcoin manages to bounce within this zone it can be the origin of the main wave C that will fully validate with a breakout above the descending-resistance-line, it will be an interesting development ahead.
Thank you everybody for watching the analysis, great contentment for everybody supporting, have a good day and good trading, all the best!
"There are many roads to prosperity, but one must be taken."
Information provided is only educational and should not be used to take action in the market.
Bitcoin-trading

Bitcoin, Potential Breakout With Objections When This Happens!Hello Traders Investors And Community,
Welcome to this analysis about Bitcoin, we are looking at the 12-hour timeframe perspective, the recent events, the established formational structure, and what we can expect in the upcoming times. Bitcoin since marking its top at the 61.800 USD showed up with bearish pressure and movements to the downside, however, this established bearishness is not fully strong as Bitcoin several times tried to reverse and show up with bullish counter-bounces which did not yet fully convert into a sufficient reversal, in this case, I discovered how this can happen and with what price-action Bitcoin needs to show determining a complete reversal, therefore I detected all the important levels and likely destinies we should consider.
Structural Developments:
As when looking at my chart we can watch there how Bitcoin is trading within this major ascending-channel-formation on the global perspectives, within this major channel Bitcoin already established the main wave-count to the upside and already completed the waves A to C within this. Now Bitcoin is about to develop the main wave D within the structure that will run directly into the lower levels of support and the 140-EMA in red as well as the 120-EMA also matching with the lower-trend-line of this formation, when Bitcoin approaches these zones there is a high possibility given for a bounce to the upside and when this bounce is strong enough it can lie ground for a breakout and further continuations.
Upcoming Determinations:
Taking all these factors into consideration Bitcoin is trading in a situation in which it has the ability to reverse especially also when looking at the MACD structure that can indicate a potential crossover. Nevertheless, Bitcoin needs to show up with the right price-actions and do not show up with further bearishness and increase of bearish pressure because then the dynamics can change also and Bitcoin can continue with bearish dynamics when it closes below the lower boundary of the huge ascending-channel-formation. Therefore, we need to keep patient and elevate on how Bitcoin approaches these levels of support and how it reacts within to come up with further conclusions, it will be an interesting journey ahead.
Thank you everybody for watching the analysis, great contentment for everybody supporting, have a good day and good trading, all the best!
"There are many roads to prosperity, but one must be taken."
Information provided is only educational and should not be used to take action in the market.

BITCOIN (BTCUSD) – Week 13 – Watching the trendlineOne of the biggest news this week was that one New Zealand Wealth Management Fund Invests 5% of its assets in Bitcoin. The KiwiSaver development fund, which has $350 million in funds under administration, has invested the mentioned amount in Bitcoin. James Grigor, the chief investment officer, has promised that in the next five years, further KiwiSaver schemes would provide bitcoin exposure.
According to City AM, 113-year-old car maker General Motors (GM) may follow in the footsteps of Tesla and add Bitcoin to its treasury. The claim is focused on the findings of a recent survey in which the business asked its consumers whether they will be comfortable using cryptocurrency as a complete or partial payment tool.
Argo Blockchain and DMG Blockchain Technologies have partnered to work together on the first green Bitcoin mining pool driven by solar resources. The proposal by the two PLCs to build a safe means of mining blockchain comes after Bitcoin has been scrutinized by the environmental community due to the large quantities of energy needed for Bitcoin mining.
Technically, we can see a consolidation forming below the red trendline. The move with the higher probability is to the upside if the trendline is broken. The potential target for this move is the $58k resistance area and if that area is broken then we will be on our way for a new all time high.
Trade with care.
Best regards,
Financial Flagship
Disclaimer: The analysis provided is purely informative and it should not be used as financial advice. Remember that you need a plan before you start trading; so, take this knowledge and use it as a guidebook that will ultimately help you understand the market and easily predict your next move.

Bitcoin, Reaches Triangle-Targets, Moves On Testing Resistance!Hello Traders Investors And Community,
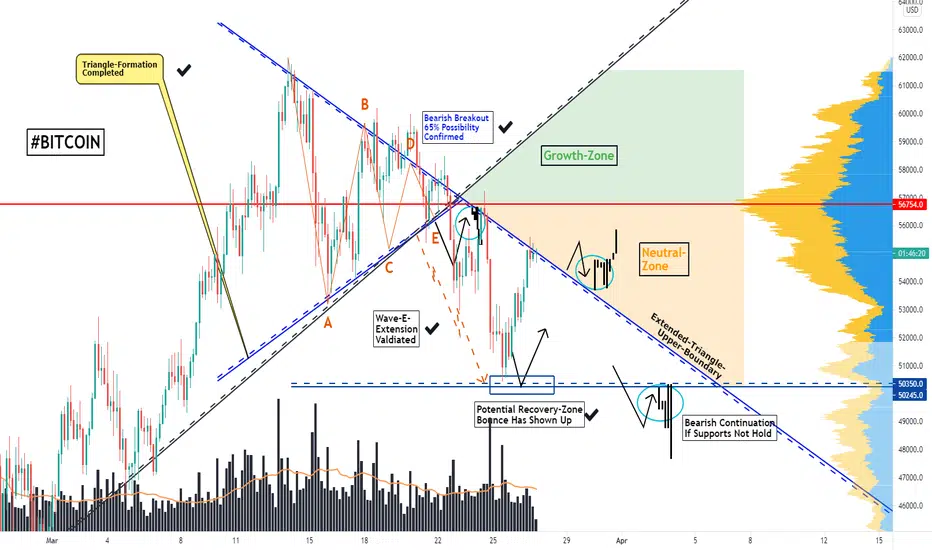
Welcome to this analysis about Bitcoin, we are looking at the 4-hour timeframe perspective, the recent events, the established formational structure, and what we can expect in the upcoming times. Since the former analysis Bitcoin has developed the more likely bearish triangle-breakout to the downside, has shown up with the wave-E-extension since then, and reached the downside-targets with the potential recovery-zone from where Bitcoin managed to bounce initially to the upside, if you did not see this analysis already I highly recommend it to watch to have a full-depth-overview, now since these events, I discovered the further signs Bitcoin developed and where the journey will move, important is now to look for the proper confirmations.
Structural Developments:
As when looking at my chart now we can watch there how Bitcoin just bounced from the potential recovery-zone bullishly to the upside confirming it as support, now Bitcoin moved on and what is meaningful now is that Bitcoin is testing this extended-upper-boundary of the previously established triangle-formation marked in blue. Currently, Bitcoin is about to test this resistance-line and the next time it will be important to elevate on if Bitcoin manages to move above this resistance right away or it firstly reverses and tests lower levels in the structure, when this happens it can also indicate the further bearish pressure to continue.
Upcoming Determinations:
Taking all these factors into consideration Bitcoin is trading in a situation in which it needs to decide how it continues its way further in the next times, when Bitcoin then manages to break out above this main descending-resistance-line it can initially lie the ground for further continuations. The main resistance than will be the point-of-control of the volume-profile that Bitcoin needs to test and it is more likely that a pullback shows up firstly. Otherwise, when Bitcoin does not move above the descending-resistance-line it will test lower levels, it has to be elevated then if Bitcoin manages to hold these levels or the bearish pressure increases, when this happens Bitcoin can also continue bearishly firstly, these are the scenarios important to assess next times.
Thank you everybody for watching the analysis, great contentment for everybody supporting, have a good day and good trading, all the best!
"There are many roads to prosperity, but one must be taken."
Information provided is only educational and should not be used to take action in the market.
TESTING INDICATOR COMBINATIONS. OPEN TO IDEAS AND SUGGESTIONS.I'm trying to develop an overall big picture high timeframe information chart comprised of several different indicators providing an overall comprehensive big picture of money flow and money flow changes, momentum and momentum changes, real-time indicators and not lagging indicators. I'm open to ideas and suggestions to indicators and combinations of indicators. thanks. CryptoRhino

Bitcoin, In Channel-Formation, How A Breakout Can Emerge!Hello Traders Investors And Community,
Welcome to this analysis about Bitcoin, we are looking at the 12-hour timeframe perspective, the recent events, the established formational structure, and what we can expect in the upcoming times. Since Bitcoin reached out above the 61.000 USD level it has shown up with strong bearish pullbacks that should not be underestimated, especially in the last weeks Bitcoin has seen several such pullbacks. Now in this case it is important to elevate if Bitcoin has the ability to reverse and back-up again or continues with its bearish alignments. In this case, now I discovered all the important levels and likely destinies we should consider within the established structure and the upcoming movements ahead in the next time.
Structural Developments:
As when looking at my chart we can watch there how Bitcoin builds this major ascending-channel-formation in the global timeframe perspectives, in which it emerged with a wave-count to the upside consisting so far of the waves A to C and now Bitcoin is about to form the wave D in the schedule. In this major global channel, Bitcoin is forming this main local descending-channel-formation in which it also has a wave-count with the waves A to C collected and with the upcoming wave D directly running into the resistance which will be a likely origin for the wave E to the downside as it still serves as strong resistance. This wave E will run directly into the blue back-up-cluster from where a bounce can show up.
Upcoming Determinations:
Taking all these factors into consideration Bitcoin is in a situation in which it needs to show how it approaches the back-up-cluster and how a potential bounce from there can look like. What is highly important in this case is that Bitcoin sustainably holds this cluster and does not falls below it and closes below the lower-boundary because this will invalidate potential bullishness and show up with further bearish pressure. Otherwise when Bitcoin manages to bounce within it can lead to a great channel-breakout and indicated continuations. For now, these scenarios need to be elevated and it is necessary to keep patient on the proper validations showing up before finally moving in the right direction.
Thank you everybody for watching the analysis, great contentment for everybody supporting, have a good day and good trading, all the best!
"There are many roads to prosperity but one must be taken."
Information provided is only educational and should not be used to take action in the market.

Bitcoin, In Channel, How Dynamics Can Alter, Important Zones!Hello Traders Investors And Community,
Welcome to this analysis about Bitcoin, we are looking at the 4-hour timeframe perspective. Since Bitcoin has shown up with initial bearish declines the last times after completing the main head-and-shoulder-formation I mentioned previously it moved into the target-zones and into remaining supports, it was great for us within the channel to secure profits on the short-side. Now as Bitcoin reached these zones I discovered an interesting formational structure Bitcoin is actually forming that can indicate an alteration of the dynamics and potential reversals when Bitcoin shows up with the right price-actions, therefore I detected all the important levels and likely destinies we should consider.
Structural Developments:
As when looking at my chart we can watch there how Bitcoin is now about to develop this major descending-channel-formation marked with the blue boundaries, within this channel Bitcoin has a coherent wave-count in which it already completed almost fully the waves A to C with the wave C moving directly into the lower boundary which is likely to be the origin of the wave D to the upside, this wave D will run into the descending-trend-line from where the wave E will follow-through. The upcoming wave E will finalize the whole wave-count and will approach directly into the main back-up-cluster which is also an important cluster to hold and back-up because below bearish pressure is likely to increase and continue.
Upcoming Determinations:
Taking all these factors into consideration Bitcoin is in a situation in which it has shown up with main bearish encounters which in any case should not be taken by side, however with the current structure, there is the possibility given that Bitcoin firstly reverses when only at first place to test the remaining resistances which are still there. In this case, basically, it will be meaningful on how Bitcoin manages the bounce from the back-up and how it forms a breakout above the descending-resistance-line, when this is strong enough it can indicate further bullish continuations and testing of the resistance. For now, it will be important how Bitcoin approaches the proper zones and how it continues from there.
Thank you everybody for watching the analysis, great contentment for everybody supporting, have a good day and good trading, all the best!
"There are many roads to prosperity, but one must be taken."
Information provided is only educational and should not be used to take action in the market.

Bitcoin, Completes H-S-Formation, Further Alignements!Hello Traders Investors And Community,
Welcome to this update-analysis about Bitcoin, we are looking at the 6-hour timeframe perspective, the recent events, the established formational structure, and what we can expect in the upcoming times. The main head-and-shoulder-formation mentioned in the former analysis fully completed in the schedule and Bitcoin showed up with initial heavy bearish conclusions that should not be kept by side. If you did not watch this analysis already I highly recommend it to watch to have a full-depth-overview. Now as Bitcoin has moved on with these confirmations I discovered further signs and structures that will be important in determining Bitcoin's upcoming destinies and further movements.
Structural Developments:
As when looking at my chart now we can watch there how Bitcoin fully completed this main head-and-shoulder-formation with the bearish pullbacks below the neckline moving below the previously established support at 53230 and for now somewhat bounced a little and mingling in the structure, these movements Bitcoin showed up with are building this ascending-channel-formation marked in blue in my chart where Bitcoin has still strong resistance determined by this descending-resistance-line in black and also by the upper-boundary of the ascending-channel as well as the 20-EMA in red, this is why a pullback here is more likely than an immediate move above, nevertheless, it is necessary to elevate the proper validation of this pullback.
Upcoming Determinations:
Taking all these factors into consideration Bitcoin is in a situation in which the pullbacks may not yet end fully, therefore when Bitcoin shows up with initial pullbacks from the current resistance and after that moves below the lower boundary it will likely lie ground for the continuation and testing of the lower supports. Now, this does not mean Bitcoin is completely bearish as it will be important on how Bitcoin approaches the lower supports and how it manages a potential bounce from there, when this bounce can sustain strong enough it can lead to further stabilization and also a potential reversal. For now, these scenarios need to be developed, it will be an interesting journey ahead.
Thank you everybody for watching the analysis, great contentment for everybody supporting, have a good day and good trading, all the best!
"The high destiny of the market is to explicate rather than to speculate."
Information provided is only educational and should not be used to take action in the market.

Bitcoin, Approaches Major Trend-Line Again, Upcoming Scenarios!Hello Traders Investors And Community,
Welcome to this analysis about Bitcoin, we are looking at the 6-hour timeframe perspective, the recent events, the established formational structure, and what to expect in the upcoming times. Recently Bitcoin formed this main double-top on the local timeframe perspective, confirmed it, and already fully reached the downside targets within the schedule, now these bearish pressures initially became omnipresent and with Bitcoins current situation I discovered the main structure that will be the determining part within the next times, therefore it is highly important to wait on the proper validations and confirmations within the schedule, in this case, I detected all the important levels and likely destinies we should consider.
As when looking at my chart we can watch there how Bitcoin now with these bearish price-actions recently tested this main ascending-trend-line marked in blue in my chart, Bitcoin already bounced two times previously within this line, when zooming out and looking at the structure this can be seen. Now as this trendline is a major reference-point within Bitcoins established structure it is necessary to elevate how Bitcoin proceeds further from here, basically, when Bitcoin manages to bounce further and increase with bullish price action to test the upper boundary of this descending-channel this can lead to further bullish stabilization and a potential breakout incoming otherwise when this does not happen bearish continuation will follow when Bitcoin stays in the current range and also closes below the ascending-trend-line. Therefore, Bitcoin has two main scenarios upcoming of which the bearish has a greater possibility of 65% compared to the bullish with a possibility of 35%.
Taking all these factors into consideration, what is of high importance in this situation is to elevate how Bitcoin proceeds and how it comes up with the final confirmations before finally moving in the right direction. In this case, it is necessary to keep patient and wait for the proper opportunities to come up with as we have also managed within the VIP channel making great profits with the recent bearish declines. Although scenario B has a higher possibility it is important to wait on the confirmation rather than over speculating the market into one-sighted illogical directions as it is seen too often these times. It will be an interesting development ahead.
Thank you everybody for watching the analysis, great contentment for everybody supporting, have a good day and good trading, all the best!
"There are many roads to prosperity, but one must be taken."
Information provided is only educational and should not be used to take action in the market.

Bitcoin, Formed Double-Top, Likely Perspectives Now!Hello Traders Investors And Community,
Welcome to this update-analysis about Bitcoins situation, now we are looking at a more local timeframe perspective which is the 2-hour timeframe and from a different angle. As the head-and-shoulder-formation Bitcoin formed on the 6-hour timeframe perspective lastly formed a breakout to the downside which Bitcoin now consolidates I mentioned the double-top also, if you did not see the analysis already I highly recommend it to watch having a full-depth-overview. This analysis is coherently building upon it and as I discovered the main double-top Bitcoin formed there are some very important levels that need to be considered, for now, it is necessary to do not keep the bearish possibilities by side.
As when looking at my chart we can watch there how Bitcoin recently formed this main double-top marked in my chart after which it pulled bearishly below the neckline, besides that Bitcoin has this coherent descending-channel-formation in which it tested the lower boundary and then bounced to confirm the breakout and the neckline now. Such a double-top can also have a dynamic-neckline like it is the case here, as Bitcoin moves into the higher resistances determined by the neckline a pullback is likely to show up within the next times. When the pullback moves below 56900 the double-top is fully completed and Bitcoin will approach the lower targets which are lying within the 53400 - 53650 level marked in my chart from where the situation needs to be elevated anew. For now, it is important to do underestimate the bearish perspective and be prepared on it for not getting overwhelmed by circumstances and pushed out of position by the smart money operators and market makers.
Thank you everybody for watching the analysis, great contentment for everybody supporting, have a good day and good trading, all the best!
"There are many roads to prosperity, but one must be taken."
Information provided is only educational and should not be used to take action in the market.

BTC, Crucial H-S-Formation, Correction Protracts When Completed!Hello Traders Investors And Community,
Welcome to this analysis about Bitcoin, we are looking at the 6-hour timeframe perspective. Since Bitcoin formed the main bull-traps and pulled back bearishly into previous levels it is mingling in the structure and did not show the proper abilities to determine a complete bullish stabilization and continuation, this is important to notice because the longer Bitcoin tests previous resistances the higher the possibility becomes that these are finally moved apart and Bitcoin sets up for a much heavier and more protracted bearish move, it is not important to keep such volatilities still omnipresent in the market not by side and in this case I discovered a decisive formation Bitcoin is forming which will be the crucial factor in the next times.
Structural Developments:
As when looking at my chart now we can watch there how Bitcoin is about to complete this main head-and-shoulder-formation it developed with the neckline marked in blue, the left shoulder and the head almost already fully completed and now Bitcoin is about to finish the right shoulder which will finalize the whole head-and-shoulder-formation. As Bitcoin already moved into the neckline and testing it will not be that long till the formation finally completes. Such formations have also the ability to break out to the upside however as Bitcoin has also an important double-top in the more local timeframe the bearish breakout is more likely and should be expected.
Upcoming Determinations:
Bitcoin now is in a situation in which it will show up with heavy bearishness once it fully closed below the neckline, what comes together, in this case, is also the double-top-confirmation which will show up together. When Bitcoin completed these developments it will continue with its correction and protract bearishness till there is support found in which stabilization is possible, this can be within the lower-support marked in blue however when this support does not hold and Bitcoin continues with further bearish pressure a continuation will follow below these levels. For now, it is necessary to be prepared for these upcoming volatilities to not get astonished and lie open food for the smart money operators and market makers.
Thank you everybody for watching the analysis, great contentment for everybody supporting, have a good day and good trading, all the best!
"There are many roads to prosperity, but one must be taken."
Information provided is only educational and should not be used to take action in the market.


Bitcoin, Is Forming Main Broadening-Wedge, Important Scenarios!Hello Traders Investors And Community,
Welcome to this analysis about Bitcoin, we are looking at the 45-minute timeframe perspective, the recent events, the established formational structure, and what we can expect in the upcoming times. Bitcoin since some time now is moving in somewhat of an indecisive zone in which it is looking for a proper trend to align, in such situations, it is necessary to keep properly patient and do not just rush into trades that do not satisfy, it is necessary to look for the proper signs to develop before finally moving into one direction, in this case now I discovered the main formation that will show up with the decisive factors within the next times, therefore I detected all the important levels and likely destinies we should consider.
Structural Developments:
As when looking at my chart now we can watch there how Bitcoin is forming this main broadening-wedge-formation marked with the boundaries in blue, within this formation Bitcoin has already completed the ABC-wave-count that can be the finalization of the wave-count however there is also the possibility to protract this wave-count with an additional wave D and then the wave E that will run into higher levels anew otherwise when this does not happen and Bitcoin increases with bearishness further it will mark the completion of the main broadening-wedge bearishly to the downside which will lead Bitcoin to approach lower levels, such a confirmation can also happen after Bitcoin moves on with the additional waves D and E.
Upcoming Determinations:
Taking all these factors into consideration now it will be important the next times explicitly on how Bitcoin approaches the decisive lower boundary and how it reacts to it, when there comes a solid bullish bounce within the boundary this will lead to the final wave E to develop when Bitcoin emerges above the descending-resistance-line as it is shown in my chart otherwise when Bitcoin does not shows up with such a bounce the whole formation will complete bearishly when Bitcoin finally closes below the lower boundary, in this case, the lower levels of support will be pointed to test, these are the major scenarios important to elevate in the upcoming times to get the proper factors adding into the circumstances.
Thank you everybody for watching the analysis, great contentment for everybody supporting, have a good day and good trading, all the best!
"There are many roads to prosperity but one must be taken."
Information provided is only educational and should not be used to take action in the market.

Bitcoin, Next Bull-Trap Developed, Important Considerations Now!Hello Traders Investors And Community,
Welcome to this analysis about Bitcoin, we are looking at the 4-hour timeframe perspective, the recent events, the established formational structure, and what we can expect in the upcoming times. Bitcoin is in a situation where it is searching for a trend more or less the last days, this is important to notice because in such phases the potential for traps increases which already happened with Bitcoin big bull-trap above the 59.000 USD level pulling back bearishly into the structure, it shows one more time how volatile and swiftly the cryptocurrency market is and that it is inevitable to properly line-up and be prepared in these cases, therefore I detected all the important levels and likely destinies we should consider.
Structural Developments:
As when looking at my chart now we can watch there how Bitcoin has this main bull-trap-resistance marked in red in my chart, after Bitcoin moved above this line which is also the previous all-time-high-resistance Bitcoin showed up with the main first bull-trap pulling back into the range anew, now recently Bitcoin somewhat managed to recover a little bit, however, moved anew into this main bull-trap-resistance where it pulled back to the downside, this determination is also matching to the wave B within the major descending-channel-formation and as Bitcoin approaches this serious resistance anew it is likely to be the origin of the wave C to the downside which should be expected here.
Upcoming Determinations:
Taking all these factors into the consideration it is inevitably to not underestimate the underlying bearish alignments here especially the next times it is necessary to elevate how this bearishness and the upcoming pullback will establish, therefore, when this pullback manages to bounce within the lower back-up-cluster marked in blue where several supports coming together this can be a great source of a channel-breakout otherwise when this does not happen and Bitcoin increases with bearishness further to close below the ascending-trend-line within the bearish-continuation-zone this will indicate further bearish pressure to show up and lower levels to be reached, it will be an important development.
Thank you everybody for watching the analysis, great contentment for everybody supporting, have a good day and good trading, all the best!
"There are many roads to prosperity, but one must be taken."
Information provided is only educational and should not be used to take action in the market.

Bitcoin, Develops Triangle, Bearish Breakout More Likely!Hello Traders Investors And Community,
Welcome to this analysis about Bitcoin, we are looking at the 4-hour timeframe perspective, the recent events, the established formational structure, and what to expect in the upcoming times. Lastly Bitcoin has shown up with strong bearish pullbacks in the structure since marking its top at the 61.300 USD level it pulled back bearishly, this initial pullback should not be underestimated in any case here and now it is so much more important to elevate on where these dynamics going, in this case, I detected the underlying formation and what is the preferred scenario we should consider here, therefore I detected all the important levels and likely destinies in the upcoming times.
Structural Developments:
As when looking at my chart now we can watch there how Bitcoin is now developing this main symmetrical-triangle formation, within this formation Bitcoin has the coherent wave-count and already completed the waves A to B fully in the structure with the wave B recently running into the upper-boundary which is still a strong resistance and therefore likely origin for the wave C which is also establishing now, this wave C will run into the lower-boundary anew and test it, Bitcoin will then continue with its wave-count till it is finished and the final decision of the crucial direction will be made, in this case now it is important to elevate which scenario is more likely which is the bearish one here.
Upcoming Determinations:
Taking all these factors into consideration Bitcoin is trading in a situation in which it will show up with the important confirmations after this whole wave-count has finished, therefore we should keep the focus on the more likely bearish scenario which has a possibility of 65% compared to the bullish one with a possibility of 35% the bearish is more likely nevertheless it is necessary to wait on the proper validations before finally going into the right direction as this is most often the case. When the more likely bearish scenario shows up with Bitcoin moving below the lower-boundary this will complete the whole formation bearishly and move into the lower zones from where the situation needs to be elevated anew.
Thank you everybody for watching the analysis, great contentment for everybody supporting, have a good day and good trading, all the best!
"Trading effectively is about assessing possibilities, not certainties."
Information provided is only educational and should not be used to take action in the market.

Bitcoin, Established Ascending-Channel, Potential Scenarios!Hello Traders Investors And Community,
Welcome to this analysis about Bitcoin, we are looking at the hourly timeframe perspective, the recent events, the established formational structure and what to expect in the upcoming times. Bitcoin since showing up with heavy exaggerated bearishness to the downside somewhat managed to recover within the structure, this recovery however is not yet fully sustainable and Bitcoin did not manged a full reversal yet, in this case I discovered the underlying formation and what scenarios are possible, therefore it is inevitably necessary to properly elevate the directions and wait on the right validations before finally moving into the direction, therefore I detected all the important levels and likely destinies we should consider.
Structural Developments:
As when looking at my chart now we can watch there how Bitcoin has now established this main ascending-channel-formation marked in my chart with the blue boundaries, within this formation Bitcoin has developed the coherent wave-count already completed the main wave A in the structure, as Bitcoin is now approaching the upper-boundary that is still a serious resistance it is likely that Bitcoin pulls back from this zone, such a price-action will be the origin of the major wave B to move on in the schedule, this wave B will run directly into the lower back-up-cluster marked in blue where several supports lying and therefore likely to show up with the final wave C that will complete the whole wave-count.
Upcoming Determinations:
Taking all these factors into consideration Bitcoin is in a situation where it will show up with the crucial decisions once the wave-count completed, there are two possible scenarios to consider, once is when Bitcoin manages to bounce within the lower support to the upside and possibly form a breakout above the upper-boundary to continue with a wave-C-extension, otherwise when this does not happen and Bitcoin increases with bearishness further this will lead to a bearish continuation and confirmation of the formation as a bear-flag when Bitcoin moves below the lower-boundary, currently the bear-flag-scenario has a higher possibility and these are the two scenarios important to watch out the next times.
Thank you everybody for watching the analysis, great contentment for everybody supporting, have a good day and good trading, all the best!
"The high destiny of the market is to explicate rather than to speculate."
Information provided is only educational and should not be used to take action in the market.


LITECOIN BIG PICTUREGood morning folks!
In the past I have already made a post about Litecoin, but in my opinion it deserves more attention.
Fundamental basics:
Litecoin is an early alternative coin (altcoin) developed by a former Google engineer Charly Lee in 2011. It has been called the silver to Bitcoin’s gold. Litecoin is a fork of BTC. Like Bitcoin, Litecoin is based on an open-source global payment network that is not controlled by any central authority. Litecoin differs from Bitcoin in aspects like faster block generation rate and use of Scrypt as a proof of work scheme. Unlike other altcoins, LTC is here to stay and in my opinion also considered a bluechip when it comes to cryptocurrencies.
Technical aspect:
You can see Litecoin on the weekly bar chart from BITSTAMP exchange. I like to keep things simple. This is the reason why I wanna give you a big picture about what's next for this altcoin. I used the fibonacci extension tool to visualize potential targets. On the right side, I tried to go more in detail for you in case of showing you the gain in percentage. Litecoin is currently consolidating in terms of volume, like you can see on the OBV (On balance volume). It is a good volume indicator. I also pinned the basic volume visualization in this chart, shown in candles, marked with the bubble and the arrow. There you can see the biggest volume intake in Litecoins history. High density and a big spike.
Conclusion:
I am highly bullish on Litecoin, because it has not gone parabolic yet and is still trading below it’s all time high. What Bitcoin did, Litecoin will also do. And as you may have recognized, altcoins go even more parabolic, so should LTC. Around $1000 is my conservative target for this old school boy. My range is set from $1000-$5000 (This is not financial advice)
Let me know in the comments below if you have any questions or simply, what you think about LTC!
Have a nice day,
Amo

Bitcoin, Since Bearish Pullbacks, These Levels Are Important!Hello Traders Investors And Community,
Welcome to this analysis about Bitcoin, we are looking at the 2-hour timeframe perspective. Recently Bitcoin shown up with heavy serious bearish pullbacks that should not be underestimated here nevertheless the potential for stabilization and ongoing bullish continuation is given, in this case, I discovered all the important levels and likely destinies we should consider within the established structure and upcoming movements ahead.
As when looking at my chart we can watch there how Bitcoin moved into this ascending-trend-line marked in blue which is also matching with the horizontal supports and the 200-EMA in red lying there making it a good zone for Bitcoin to move initially to the upside and test the 65-EMA in green and this descending-resistance-line in grey, when Bitcoin then manages a sustainable stabilization within this range between the descending-resistance-line and the ascending-support-line this can lead to a great upside-breakout when Bitcoin increases with bullishness further, therefore, Bitcoin needs to close above the descending-resistance-line properly and do not increase with bearish pressure again. Mainly it is inevitable that Bitcoin stays within the range considering an upside-breakout and do not fall below the ascending-support-line because this will invalidate the whole bullishness and move to lower levels to be reached.
Thank you everybody for watching the analysis, great contentment for everybody supporting, have a good day and good trading, all the best!
"There are many roads to prosperity but one must be taken."
Information provided is only educational and should not be used to take action in the market.

BTC Short Playing Out As Predicted!The BTC short I wrote about yesterday is playing out exactly as predicted :) Based off the sell signal from my Whales Buy-Sell indicator and the MFI Pro, we accurately predicted that BTC would fall to at least the $57,853 support level which it broke and went to our next support of $54,180. Currently BTC is holding that support but if the 8hr candle closes below $54,180 then I can definitely see us going to $50,918. I can see at least 1 more day of downside (based off of the MFI Pro taking time to break below 30) before we consolidate for a couple days and try for another leg up.
If you have any questions about the indicators used, my technical analysis, or want to buy the Whales Buy-Sell indicator, please PM me :)

Bitcoin-Update, Further Developments In The Wedge-Formation!Hello Traders Investors And Community,
Welcome to this update-analysis about Bitcoin, we are looking at the daily timeframe perspective, the recent events, the established formational structure, and what we can expect in the upcoming times. Since the former analysis Bitcoin moved on with the wedge-development as expected and developed the bounce from the main back-up-cluster confirming to the major wave E within the wave-count, if you did not see this analysis already I highly recommend it to watch to have a full-depth-overview as this analysis is coherently following up on it, therefore I detected all the important levels and likely destinies we should consider with Bitcoin in the established structure and upcoming movements.
Structural Developments:
As when looking at my chart now we can watch there how Bitcoin moved into the new all-time-high-regions since bouncing to the upside from the back-up-cluster which was the origin of the wave E within the underlying wave-count, now since Bitcoin slightly advanced in the new all-time-high-region and pulled back anew Bitcoin is testing previous levels of support from where a back-up is possible within the local back-up-cluster marked in my chart in blue, when this level holds sustainably and Bitcoin manages the proper bounce from this zone Bitcoin will move on with its wave-development and approach the upper zones of resistance from where the crucial developments will show up and pullbacks should not be kept by side.
Upcoming Determinations:
Taking all these factors into consideration Bitcoin is trading in a situation with which it will likely complete the wave-count within the next times running into the strong upper resistance-cluster I mentioned already in the former analysis, this will be crucial as Bitcoin has a high likelihood to show up with a bearish pullback from there and since Bitcoin is still trading within this major ascending-wedge-formation this can be the decisive turning-point for completion of the whole formation which will happen when Bitcoin finally moves below the lower-boundary as it is shown in my chart, therefore, in sight of this strong massive formation this bearish perspective should not be kept by side in any case.
Thank you everybody for watching the analysis, great contentment for everybody supporting, have a good day and good trading, all the best!
"There are many roads to prosperity, but one must be taken."
Information provided is only educational and should not be used to take action in the market.

Bitcoin, Breakout In A-T-H-Dynamics, Determined Objections Now!Hello Traders Investors And Community,
Welcome to this analysis about Bitcoin, we are looking at the 12-hour timeframe perspective, recent events, the established formational structure, and what we can expect in the upcoming times. Bitcoin recently made the main breakout into the new all-time-high-regions where it has shown up with great bullish volatility, now as these events emerged I discovered the underlying structure Bitcoin is forming and what will determine Bitcoins further outcomes within the next times, therefore, it is necessary to elevate what is possible and what is not possible, in this case, I detected all the important levels and likely destinies we should consider with Bitcoins established structure and the upcoming movements ahead next times.
Structural Developments:
As when looking at my chart now we can firstly see that Bitcoin is trading within this massive ascending-channel-formation marked with the boundaries in blue, secondly as Bitcoin recently developed the new highs with the breakout it moved on with the established wave-count and the wave C within this wave-count. Therefore it is likely that Bitcoin will form wave D within the next times that will confirm to the EMA-supports and the equilibrium-range given from where the possibility for wave E to the upside is given. This wave E will complete the whole wave-count and it will run directly into this dynamic-resistance-zone marked in orange in my chart where the potential for a pullback is increased.
Upcoming Determinations:
Taking all these factors into consideration Bitcoin has established a good pace from where it can build up and show up with further determinations, it shows one more time how volatile the cryptocurrency market is and that it is important to be prepared for such dynamics. Now when Bitcoin approaches this main dynamic-resistance-zone and pulls back there which is likely this does not mean Bitcoin is completely bearish, therefore, when Bitcoin manages a sustainable stabilization within the major ascending-channel-formation it can approve the set-up and origin for the next waves to the upside, for now, it will be important how Bitcoin approaches the dynamic-resistance and how it moves on further from there.
Thank you everybody for watching the analysis, great contentment for everybody supporting, have a good day and good trading, all the best!
"Good luck is when opportunity meets preparation."
Information provided is only educational and should not be used to take action in the market.

Bitcoin, Developed Channel-Formation, Important Scenarios!Hello Traders investors And Community,
Welcome to this analysis about Bitcoin, we are looking at the 4-hour timeframe perspective, the recent events, the established formational structure, and what we can expect in the upcoming times. Recently Bitcoin managed to back-up from its heavy bearish downside volatility and formed some initial up-moves testing the previous all-time-high-condition-resistance, now in this case I discovered interesting signs that can indicate a potential breakout above the all-time-high-condition-resistance and further determinations in the new all-time-high-regions, therefore I detected all the important levels and likely destinies we should consider with Bitcoin in the established structure and upcoming movements ahead next times.
Structural Developments:
As when looking at my chart now we can watch there how Bitcoin is moving within this major ascending-channel-formation marked with the boundaries in blue, furthermore Bitcoin has the coherent wave-count within the formation and almost already completed the waves A to C in the structure with the wave D about to develop now in the next times, this wave D will move on and test the lower levels of support with the back-up-cluster lying there marked in my chart in blue, this is a very important cluster to hold for Bitcoin and bounce to the upside when considering the sufficient origin of wave E otherwise when this does not happen and Bitcoin increases with bearish-pressure the bullish dynamic can also be invalidated below the lower-boundary as shown.
Upcoming Perspectives:
Taking all these factors into the consideration now Bitcoin is in a situation in which it developed some worthwhile price-action, now it is the times to validate these price-actions and form a continuation, when Bitcoin properly manages to bounce within the back-up-cluster as suggested this will move on to test the main all-time-high-condition-resistance again and when Bitcoin then finally manages a breakout above and stabilization above the resistance such a price-action will indicate the wave E to develop further ahead, the main zone to be approached then will be the wave-E-determination-zone from where the situation needs to be elevated anew as a bearish pullback is likely in this case it will be an important determination.
Thank you everybody for watching the analysis, great contentment for everybody supporting, have a good day and good trading, all the best!
"There are many roads to prosperity, but one must be taken."
Information provided is only educational and should not be used to take action in the market.
