Bitcoin, Wedge-Completion Built Ground For Further Continuation!Hello Traders Investors And Community,
Welcome to this important update-analysis in which we are looking at Bitcoins 4-hour timeframe perspective, the recent events, the established formational structure, and what we can expect in the upcoming times. As mentioned in previous analysis Bitcoin has formed this major decisive ascending-wedge-formation below several important bearish resistances and as suggested the bearish wedge-confirmation was more likely and should have been expected which now finally happened in the schedule as Bitcoin made the breakout below the lower boundary, if you did not see this analysis I highly recommend to watch it to have a full-depth-overview as this one is building a coherent follow-up to the previous, therefore I detected all the important levels and likely destinies we should consider now.
Structural Developments:
As when looking at my chart we can watch there how Bitcoin finalized this ascending-wedge-formation mainly in the schedule and already moved into the 300-EMA in green from where it now initial marginally bounced to the upside, also Bitcoin moved into the ascending-wedge-confirmation-range which is a bearish range here and Bitcoin has still serious resistances lying above in the structure which when touched will likely show up with a bearish pullback to the downside, this is also what is possible here within the next times and should not be underestimated as Bitcoin has shown up with this bearish edge it is more likely that the pullback shows up rather than Bitcoin rightly moving above the descending-resistance-line and forming a new bullish paradigm.
Main Considerations:
Taking all these factors into consideration it is important to note here that Bitcoin has established these serious bearish signs that in any way can not be taken by the side, in the channel we already prepared long before this happened as we executed the first short 8th of January and managed to hedge accordingly during this time till today also. It shows one more time that the cryptocurrency market is a very volatile market with many ups and downs confirmed in the past and omnipresent in the present, this is why we should be prepared on such changes as sophisticated traders in direction to do not lie open food for market makers and smart money operators because this is the essence, especially in the volatile cryptocurrency market place.
In this manner, thank you for watching the analysis, have a good day and good trading, its a great contentment for everybody supporting, all the best!
"There are many roads to prosperity, but one must be taken."
Information provided is only educational and should not be used to take action in the markets.
Bitcoin-trading

Bitcoin, In Flag-Formation, How It Completes In The Schedule!Hello Traders Investors And Community,
Welcome to this analysis about Bitcoin, we are looking at the 30-minute timeframe perspective, the recent events, the established formational structure, and what we can expect in the upcoming times. Bitcoin on the more global perspectives has still some important bearish edges which should not be underestimated at this point and now I discovered an important formation in the short-term that can lie determining ground in the upcoming outcomes especially firstly on the local timeframe perspective this can also provide a possible opportunity, therefore I detected all the important levels and likely outcomes we should consider with Bitcoins established structure and the upcoming movements ahead.
Structural Developments
As when looking at my chart we can watch there how Bitcoin is now trading in this ascending-channel-formation marked in my chart with the blue boundaries, furthermore Bitcoin has established this coherent wave-count within the formation already completing waves A and B within the schedule and now setting up to form the wave C with the origin within the lower boundary, this wave C will directly run into the major resistance-cluster marked in my chart in red where several resistances coming together consisting of the 500-EMA in red, the upper-boundary-resistance and also the horizontal Fibonacci-resistance all together forming this strong resistance-layer in which Bitcoin is likely to show up with a bearish pullback when moving into it.
Upcoming Perspectives:
Taking all these factors into consideration Bitcoin will complete the ascending-channel as a bear-flag when closing below the lower-boundary as it is marked in my chart, such price-action will lie ground for further continuations and will also activate the downside targets marked in my chart in blue at the 29200 levels. This whole mechanism can be traded either aggressively with the immediate entry within the channel or conservative with entry after the final confirmation has shown up, although the aggressive entry is also possible the conservative will be much better as it will point to the final setup. After Bitcoin reached the downside targets it has to be elevated if there comes a potentials recovery or further declines follow up.
In this manner, thank you for watching the analysis, have a good day, great contentment for everybody supporting, all the best!
"Trading effectively is about assessing possibilities, not certainties."
Information provided is only educational and should not be used to take action in the markets.

Bitcoin, Important Levels For A Upcoming Bull-Development!Hello Traders Investors And Community,
Welcome to this analysis about Bitcoin in which we are looking at the daily timeframe perspectives, the recent events, the established formational structure, and what we can expect in the upcoming times. Bitcoin has shown up with strong upside volatility almost exaggerating in the new all-time-high region with a bullishness never seen before now as this trend firstly stopped and Bitcoin showed up with initial bearish encounters to the downside it is an important question if Bitcoin somewhat can manage to take up the bullishness again sooner or later or the conditions alter to a more bearish interface which more unlikely nevertheless should not be underestimated here, therefore I detected all the important levels and likely outcomes we should consider.
Structural Developments:
As when looking at my chart we can watch there how Bitcoin is now forming this important descending-wedge-formation to the downside marked in my chart in black, furthermore Bitcoin has established these three dynamic trend-lines marked in my chart in blue, each one of them signaling a bullish reference-point holding the trend to the upside, when the next ones are broken to the downside this means the bearishness gets constantly higher, in this case, it is of high importance that Bitcoin at least manages to hold the last blue ascending-trend-line which will also match with the finalization of the descending-wedge-formation in terms of a strong bounce from this level that can move on to finalize the formation and show up with the next bullish wave.
Upcoming Perspectives:
In terms of taking all these factors into consideration, Bitcoin has a good potential given to show up with a bullish wave to the upside when it manages to bounce within this back-up-cluster marked in my chart in blue were the several supports coming together, in this case, it is necessary that Bitcoin really bounces here because when this does not happen and Bitcoin moves below the cluster it will indicate further bearish pressure and visiting of lower levels however when Bitcoin manages the bounce and the breakout above the upper boundary it will indicate the next wave to establish and pointing to higher levels possibly into the upper-extension-target-zone marked in my chart at the Fibonacci-extension from where the situation needs to be elevated anew.
In this manner, thank you for watching the analysis, have a good day, great contentment for everybody supporting, all the best!
"Good luck is when opportunity meets preparation."
Information provided is only educational and should not be used to take action in the markets.

BITCOIN | Strong Resistance, Don't Rush, Wait For a Break!Hi,
During the weekend the price of BTC got a small rejection downwards but climbed "up" pretty quickly. Do you think it is a good time to buy it for mid, - long-term? I will say no, it is not a good time to buy it because the area just above the current price is pretty strong and actually it will be a deciding point for further BTC movement.
At the moment, I can see that the price of BTC might climb higher to retest the area around $35000. Currently, it fights with 4-hour EMA50 which acting as a resistance and if the price manages to break above it then the strongest zone/resistance will be there pretty quickly.
The strong resistance consists of two types of trendline ; the higher one will act as a resistance waiting for a third touch and the second one, lower, will also act as resistance but the type is a bit different.
We have a strong 4-hour candle break below of it. Strong candle break means it is definitely a line to keep an eye on because the price needed a strong volume to break below and now it acts as resistance because the price comes to retest it.
The crossing area consists of:
* Prementioned trendlines
* Mid-number $35000 acting as a resistance, worked previously multiple times
* Strong area around 35k, several rejections upwards and downwards, it shows that currently, it is a pretty psychological level for investors/traders
* Different Fibonacci levels
As said, currently, I don't recommend buying BTC for the mid-, long-term. Wait for the breakout of it. Wait, let the price shows that it is ready to climb higher and THEN you can act.
It is not worth taking a risk from current prices because the down pressure is still alive.
It can be also a possible selling area but we need a candlestick pattern confirmation to make another short-term sell from it. Bearish candlestick patterns what I will wait for are here
Regards,
Vaido

Bitcoin, Decisive Pattern Showing Final Conclusions Upcoming!Hello Traders Investors And Community,
Welcome to this analysis about Bitcoin in which we are looking at the 4-hour timeframe perspectives, the recent events, the established formational structure, and what are likely scenarios we can expect in the upcoming times. Bitcoin as moving below the 33.000 USD level with this strong bearish volatility and then bouncing to the upside again from the 29.000 USD level recently is in a decisive situation which will show the conclusions within the incoming destinations, in this case, I detected a very worthwhile formation and underlying structure that will a huge determining factor with Bitcoin, therefore I detected all the important levels and likely possibilities we should consider here.
Structural Developments:
As when looking at my chart we can watch there in what circumstances Bitcoin is trading in as it recently tested two times this important ascending-resistance-line marked in black in my chart with the wave A and the wave C in the schedule, this is a meaningful ascending-resistance-line as it was supporting previously several times, furthermore, Bitcoin is also testing the other descending-resistance-line in red already confirmed several times bearishly as such. Overall Bitcoin is now forming this ascending-wedge-formation in the structure marked in my chart in orange which is normally a bearish formation however there is the possibility given that the formation breaks out to the upside when Bitcoin manages to gain enough bullish strength.
Upcoming Perspectives:
Taking all these factors into consideration there are two possible scenarios Bitcoin will show up the next times either the ascending-wedge-confirmation scenario with a breakout and completion of the formation to the downside or the ascending-wedge-invalidation scenario with Bitcoin gaining bullish strength and breaking out to the upside. At the moment the bearish scenario has a higher possibility as the strong resistances are just to omnipresent for now and should not be underestimated, nevertheless it is necessary to wait for the proper validation in any case here before moving into the final direction showing up bearishly with a breakout below the lower boundary of the formation and bullishly with a breakout and stabilization to the upside, it will be an interesting development.
In this manner, thank you for watching the analysis, have a good day, great contentment for everybody supporting, all the best!
"There are many roads to prosperity but one must be taken."
Information provided is only educational and should not be used to take action in the markets.

Bitcoin, Forms The Crucial Developments, Next Assessments!Hello Traders Investors And Community,
Welcome to this important update-analysis about Bitcoin's situation from a 12-hour timeframe perspective. Since the previous analysis Bitcoin moved on with the wave 3 establishment and bearish prospects initially within the structure, to have a full-depth-overview I highly recommend watching the origin-analysis as this analysis is coherent following up the previous one, as I discovered already on the more local 4-hour timeframe perspective Bitcoin is already forming this decisive descending-triangle-formation, now with looking at the more global 12-hour perspective I detected more evidence for the wave-development as previously expected as more factors come into the cluster-zone, therefore we are looking at the crucial levels and destinies.
Structural Developments:
As when looking at my chart now we can watch there how Bitcoin now showed up with the bearish encounters and also recently tested the 100-EMA in green from where it firstly bounced to the upside, furthermore we can watch the meaningful descending-wedge-formation I mentioned previously also in this timeframe in a good manner which is also likely to continue to develop the next times, recently Bitcoin has shown up with some up moves within the structure these moves, however, were not yet strong enough to completely validate a full reversal this is why the triangle-development upcoming next times is likely in which Bitcoin will test this significant strong support-cluster marked in my chart in blue.
Upcoming Perspectives:
Bitcoin is in a situation in which it developed a bearish trend initially on the short-term-perspective, this trend however is not completely strong as we have seen it with others in the past, this is why a reversal with such a trend is more likely, in this case, Bitcoin has a good possibility given to reverse within the back-up-cluster when showing up with the right bullish price-action from there which will then indicate the major wave 5 to establish ahead upcoming times however it is inevitably important that Bitcoin rightly bounces in this zone because when moving below this will activate further bearish pressure however this possibility is not that big for now and the reversal should be more expected, it will be an interesting development ahead.
In this manner, thank you for watching the analysis, have a good day, great contentment for everybody supporting, all the best!
"There are many roads to prosperity, but one must be taken."
Information provided is only educational and should not be used to take action in the markets.
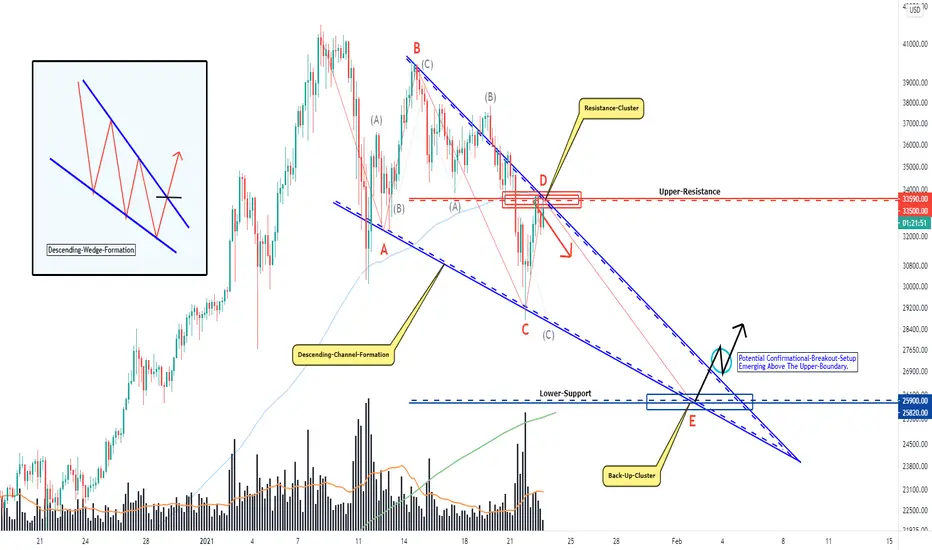
Bitcoin, Why And How A Recovery Potentially Establishes!Hello Traders Investors And Community,
Welcome to this analysis about Bitcoin, we are looking at the 4-hour timeframe perspective. Bitcoin since a longer period is trading in a downtrend, this fact should not be kept by side here, especially the last time's Bitcoin has shown up with serious bearishness to the downside, in this case now I discovered a worthwhile formation Bitcoin is currently forming that can possibly indicate a recovery within the schedule, this formation is also matching with the descending-channel I have recently shown within my analysis nevertheless it is from high importance that Bitcoin shows up with the right price-actions ahead, therefore we are looking at all the important levels and likely outcomes we should consider.
Structural Developments:
As when looking at my chart we can watch there how Bitcoin is now forming this major descending-triangle-formation marked in my chart in blue, within this triangle-formation Bitcoin has established a coherent wave-count already completing the waves A to C within the schedule and recently moving on to finalize the wave D which directly ran into this strong resistance-cluster marked in my chart in red which is now likely to be the origin for the next wave E to the downside that will then complete the whole wave-count and also test the lower back-up-cluster marked in my chart in blue in which Bitcoin has some supports lying possibly indicating a bounce to the upside and therefore completion of the formation.
Upcoming Perspectives:
Taking all these factors into consideration Bitcoin is in a situation in which it is still in a downtrend however there are potentials given that this downtrend reverses sooner or later when the proper confirmational price-actions show up, in this case, Bitcoin rightly needs to bounce within the back-up-cluster decisively and do not fall below it again because this can possibly invalidate the reversal however when this happens and Bitcoin bounces to breakout above the upper-boundary this will indicate further bullishness and activation of upper-targets, for now it will be important how Bitcoin establishes further with the wave E and how it then moves on into the back-up-cluster, it will be an interesting development.
In this manner, thank you for watching the analysis, have a good day, and of course good trading, all the best!
"Good luck is when opportunity meets preparation."
Information provided is only educational and should not be used to take action in the markets.
Bitcoin, Bearish Encounters, Important Determinations Now!Hello Traders Investors And Community,
Welcome to this analysis about Bitcoin, we are looking at the 2-hour timeframe perspectives, the recent events, the recent bearish encounters that showed up, and what we can expect the next time. Recently Bitcoin has formed this significant bearishness to the downside almost moving below several supports which was initially expected as I mentioned in the previous analysis, it was also good for us within the channel to secure profits within the market and protect out positions, now Bitcoin is forming interesting structures as I discovered that will be worthwhile for upcoming determinations, therefore we are looking at all the important levels and likely outcomes we should consider with Bitcoin and upcoming destinies.
When looking at my chart we can watch there Bitcoin clearly moved below this 30100 support it has previously which is initially bearish and should not be kept by side in this case however Bitcoin firstly bounced after moving below which is nor extremely bearish, furthermore, Bitcoin has established this huge descending-channel-formation marked in my chart with the black boundaries in which it established this important coherent wave-count to the downside already completing waves A to C in the schedule and now moving into the wave D that will run directly into the strong upper resistance-cluster and therefore likely to be the origin of a bearish pullback and final wave E to develop in the structure completing the wave-count.
With Bitcoin established this descending-channel-formations there are some possibilities given with a reversal when Bitcoin manages to show up with the proper price-action this is when Bitcoin manages to bounce within the lower support decisively after completing the whole wave-count, when Bitcoin shows up with such a price-action then this can lead to a great channel-breakout and therefore the finalization of the formation and pointing to upside targets, taking this into consideration it is of inevitable high importance that Bitcoin does not increase with bearish pressure further and increase the bearish edge moving below the lower supports because this will invalidate the formation, for now, it will be important and illuminating how Bitcoin moves on into the resistances.
In this manner, thank you for watching the analysis, have a good day, and of course good trading, all the best!
"The high destiny of the market is to explicate, rather than to speculate."
Information provided is only educational and should not be used to take action in the markets.

BTCUSD - Possible correction pattern before the up moveToday, we present a possible correction pattern for BTCUSD. We see a flat pattern forming in the middle, we are predicting a small up move followed by a down impulse wave before it resumes the strong uptrend.
This correction should not break and close below the green rectangular box. If it does, then the forecast changes and we will want to see what the price is doing in that areas to submit to you our thesis.
Trade with care.
Disclaimer: The analysis provided is purely informative and it should not be used as financial advice. We do not recommend making hurried trading decisions. You should always understand the risk that trading implies and that PAST PERFORMANCE IS NOT NECESSARILY INDICATIVE OF FUTURE RESULTS.

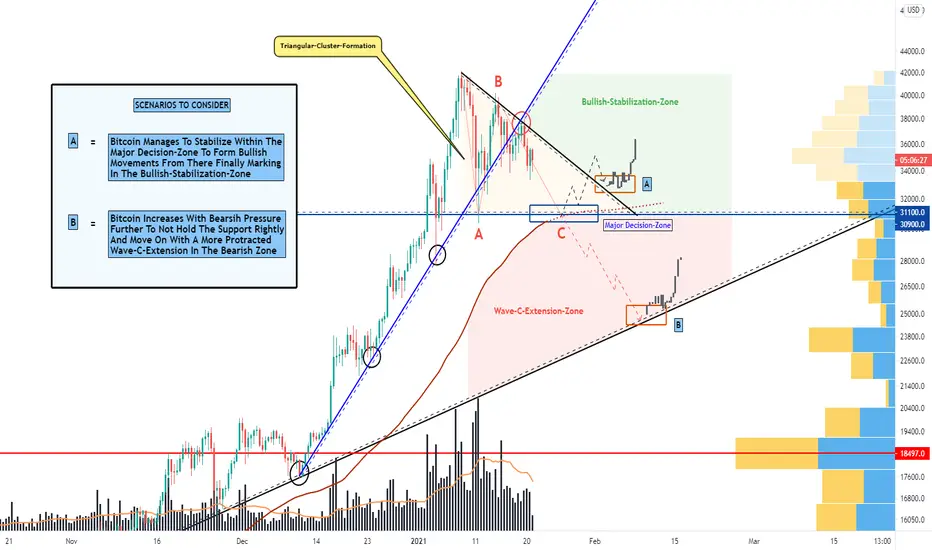
Bitcoin, In Decisive Triangle, Considerable Scenarios Ahead!Hello Traders Investors And Community,
Welcome to this analysis about Bitcoin, we are looking at the 12-hour timeframe perspective, the recent events, the formational structures, and what scenarios we can expect in the upcoming times. As Bitcoin stopped with its bullish uptrend and showed up with an initial bearish pullback that should not be underestimated I discovered a decisive formation Bitcoin is forming now which will show the further conclusions under the upcoming given conditions and individual scenarios to consider, therefore it is from high importance to elevate the further developments finally coming to the right conclusions, in this case, I detected all the important levels and likely destinies we should consider now.
Structural Developments:
As when looking at my chart we can watch there how Bitcoin initiated this bearishness moving into the established formational edge and important here is that Bitcoin broke below this long-lasting ascending-trend-line marked in blue, furthermore, we see how Bitcoin already bounced within the 31.000 USD and marked it as support. Together with the lower support in the 31.000 USD and this descending-trend-line marked in black in my chart Bitcoin is now developing this major triangular-cluster-formation marked in orange in my chart from where the next decisions will occur and either one of the given scenarios shown in my chart showing up, therefore, it is important to keep patient for the right confirmations before moving in the final direction.
Upcoming Perspectives:
Bitcoin is in a situation where it will show the final decision of either scenario A or B completing the next times within the major decision-zone marked in my chart, because Bitcoin has still more or less strong support within this area the bullish scenario has a slightly higher possibility to show up in comparison to the bearish one nevertheless it is inevitable to elevate the proper price-action to show up, therefore, when Bitcoin manages to bounce strongly in this decision-zone the bullish breakout above the trendline can be expected it will all depend on how the reaction within this level will be and how Bitcoin moves on then, it will be an interesting development ahead.
In this manner, thank you for watching the analysis, have a good day, and of course good trading, all the best!
"There are many roads to prosperity, but one must be taken."
Information provided is only educational and should not be used to take action in the markets.
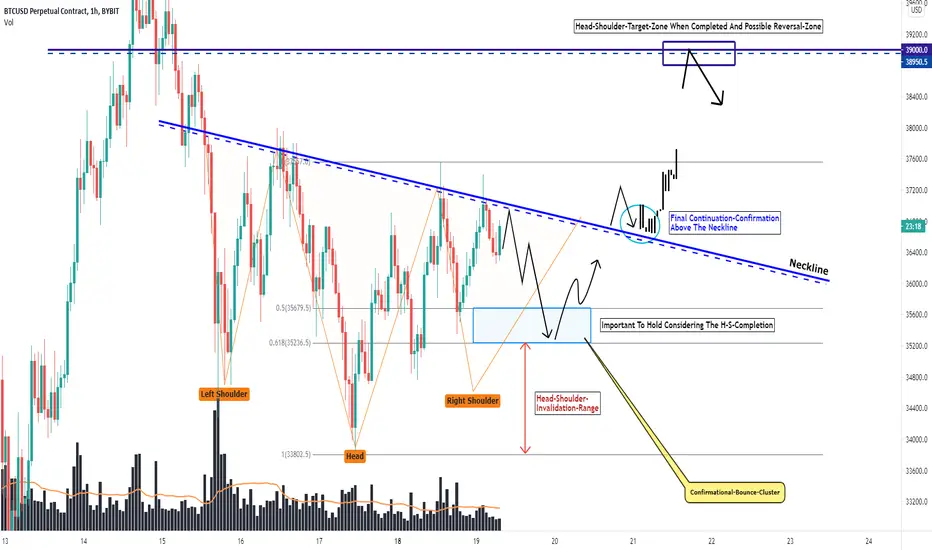
Bitcoin, Crucial Tests Of Upper-Resistance-Layers Incoming!Hello Traders Investors And Community,
Welcome to this analysis about Bitcoin, we are looking at the 4-hour timeframe perspective, the recent events, the established formational structure, and what we can expect within the upcoming times. As already mentioned in the previous analysis Bitcoin is about to complete this decisive inverse head-and-shoulder-formation that when finalized point to the upper-levels, besides that now I discovered other important levels worthwhile in determining upcoming destinations, for now, we should not in any case underestimate the bearish perspective here, therefore I detected all the important price-levels and likely outcomes we should consider with Bitcoin in the established situation and upcoming movements ahead.
As when looking at my chart we can watch there Bitcoin with forming this important head-and-shoulder-formation actually bounced recently with the head and right-shoulder-approach within the 100-EMA marked in black in my chart which is a meaningful sign as the 100-EMA was severely support/resistance in the developments in the past before. This is why the possibility for the right shoulder development and therefore finalization of the head-shoulder-formation increases here, which will show up with Bitcoin finally marking above the neckline in my chart in blue from where we can anticipate the further up moves however these up moves will run directly into the strong resistance layers above that will be extremely crucial at this point.
Taking all these factors into consideration Bitcoin will with a high likelihood pullback when reaching the major resistance-cluster marked in my chart in red there is a possibility given that Bitcoin moves above this resistance however it is very marginally. After this highly likely pullback to establish Bitcoin will move on to test the 200-EMA again and possibly confirm it as support nevertheless when Bitcoin does not hold this necessary EMA we will see more protracted bearish movements below it and within the bearish-continuation-zone, for now, these cases should not be kept by side here and we should be prepared on possible stronger and more protracted pullbacks ahead upcoming times to do not get overwhelmed by circumstances when these show up.
In this manner, thank you for watching the analysis, have a good day, and of course good trading, all the best!
"There are many roads to prosperity, but one must be taken."
Information provided is only educational and should not be used to take action in the markets.

BITCOIN | BUY Opportunity!Hi,
Long story short, we have a break above the strong area, we have a throwback, and go for it!
Regards,
Vaido

Bitcoin, Forms Preliminary H-S-Formation, Possible Opportunity!Hello Traders Investors And Community,
Welcome to this analysis about Bitcoin, we are looking at the local hourly timeframe perspective, the recent events, the current formation, what we can expect the next times, and how to possibly handle the situation. As I discovered Bitcoin is forming an interesting formation here that can show up with some worthwhile potentials firstly on this timeframe perspective when the proper price-action shows up however it is necessary to assess that Bitcoin on the more global perspectives is still not yet completely bullish and the possibilities for pull-backs are still present this is why the current formation can lie some good volatility firstly on the short-term, what happens after it has to be elevated anew.
As when looking at my chart we can watch there how Bitcoin is now trading within this possible inverse head-and-shoulder-formation marked in my chart in orange with the blue neckline. The left shoulder and the head already almost completed and now Bitcoin is about to form the right shoulder of the formation within the schedule moving into the completion of this important formation, therefore Bitcoin has the major support within the Fibonacci-levels marked in my chart in blue and the confirmational-bounce-cluster within my chart where a bounce to the upside needs to show up, taking this into consideration it is of inevitable high importance that Bitcoin does not move below the cluster again because this will invalidate the formation firstly.
The next time's Bitcoin will show how it completes this great formation and how the breakouts and continuation can look like, the final confirmation will show up when Bitcoin finally breaks out above the upper boundary and closes there as it is marked in my chart to show up with a continuation and pointing to the upside targets, when these are reached it needs to be elevated if Bitcoin continues with bullishness ahead or firstly forms a reversal visiting lower levels. The whole formation can be traded either aggressively with immediate entry or conservative with entry after confirmation, although the aggressive entry is also possible the conservative one will be much better as it will point to the finalized setup.
In this manner, thank you for watching the analysis, have a good day, and of course good trading, all the best!
"Trading effectively is about assessing possibilities, not certainties."
Information provided is only educational and should not be used to take action in the markets.
BTC BIG TRIANGLE FORMATION WILL DETERMINE UPCOMING DESTINIES!!!Hello Traders Investors And Community,
Welcome to this fundamentally important analysis about Bitcoin, we are looking at the 4-hour timeframe perspective. As Bitcoin has shown up with heavy gains to the upside in 2020 where it almost exaggerated and protracted with bullishness within the new all-time-high region despite the ongoing corona-pandemic it has now reached a high value where the volatility increased extremely which is good for us as traders as we also secured our profits within the channel consistently. Now Bitcoin is at a point where I discovered a decisive formation beside the head-and-shoulder-formation also forming that will lie the ground for the next destinations, therefore I detected all the important levels and likely outcomes we should consider here.
Structural Developments:
Besides the major head-and-shoulder-formation, I mentioned already previously Bitcoin is now about to form this huge triangle-formation marked in my chart, it has to be mentioned that the amplitude of the triangle upper-boundary to the lower-boundary largest point is just as large as 11.000 USD, imagining that this was the price Bitcoin had back in August last year at all and it shows what spheres Bitcoin reached now. As you can watch in my chart Bitcoin also developed this coherent wave-count within the triangle already completing waves A to C in the structure and now is already about to form the wave D on which the wave E will likely follow finalizing this whole wave-count and coming to the crucial decision-zone incoming.
Upcoming Perspectives:
Bitcoin now has reached a high value and is also in overbought condition and taking these technical factors into consideration the bearish breakout of the triangle has a higher likelihood of 65%, this does not mean the whole market is completely bearish however it can mean that Bitcoin will reach lower levels to form potential accumulations there, in this case, we should not underestimate the bearish perspective here and also be prepared when this triangle finally completes, however, it will be important to wait on the final confirmation before finally moving into this direction also because the same confirmation will complete the head-and-shoulder-formation simultaneously building, it will be an interesting development ahead.
In this manner, thank you for watching the analysis, have a good day and of course good trading, all the best!
"The high destiny of the market is to explicate rather than to speculate."
Information provided is only educational and should not be used to take action in the markets.

Bitcoin, Continues To Develop The Major H-S, Important Levels!Hello Traders Investors And Community,
Welcome to this update-analysis about Bitcoin, we are looking at the 4-hour timeframe perspective, the recent events, the established formational structure, and what we can expect within the upcoming times. As mentioned in previous analysis Bitcoin moved on to form the important right shoulder of this massive head-and-shoulder-formation I discovered with Bitcoin to pullback bearishly within the upper strong resistance-cluster, when you did not see this analysis already I highly recommend it to watch to have a full-depth-overview, also the right-shoulder situation is matching with the more local timeframes I illuminated, therefore we are looking at the underlying important levels and where the journey is heading now.
As when looking at my chart we can watch there how Bitcoin now pulled back bearishly exactly within the strong resistance-cluster which confirmed now fully as such, this gave Bitcoin the edge to continue with the right shoulder developments now and therefore we see Bitcoin moving below the 30-EMA in red which it also recently confirmed as resistance, the next meaningful EMA, in this case, will be the 140-EMA marked in blue in my chart also matching with the neckline and the major decision-zone lying there where Bitcoin will proceed to form the final decision whether the head-and-shoulder-formation completes bearishly to the downside or bullishly to the upside.
Taking all these factors into consideration now we will see Bitcoin moving into the major decision-zone upcoming times as it is marked in my chart, when Bitcoin moves into it has to be elevated if Bitcoin does not show up with serious bullishness there or not, when this does not happen and Bitcoin increases the bearish pressure possibly with high volume also this will indicate the bearish continuation, overall it will be important to keep patient and wait for the right confirmation, when Bitcoin closes bearishly below the neckline it will complete the formation to the downside otherwise with a stabilization above the neckline it can indicate a breakout to the upside, the right validation will be telling before moving into the final direction.
In this manner, thank you for watching the analysis, have a good day, and of course good trading, all the best!
"Good luck is when opportunity meets preparation."
Information provided is only educational and should not be used to take action in the markets.

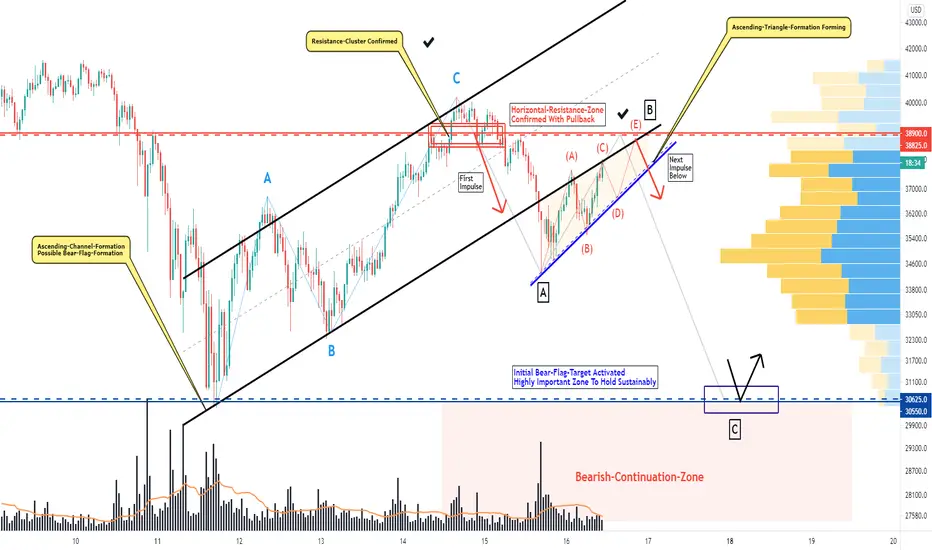
Bitcoin, Completes The Bear-Flag-Formation, Next Objections!Hello Traders Investors And Community,
Welcome to this update-analysis about Bitcoin, we are looking at the 45-minute timeframe perspective, the recent events, the established formational structure, and what we can expect in the upcoming times. The major bear-flag-formation I mentioned previously now fully developed with the coherent wave-count and completed bearishly to the downside with this decisive move below the lower-boundary, if you did not see this analysis already I highly recommend it to watch to have a full-depth-overview, now as this bearish volatility established it was good for us to secure profits on the short-side, now taking this further we should not underestimate the bearish edge here, therefore I detected all the important levels and likely destinies to expect.
As when looking at my chart now we see Bitcoin actually developed an interesting constellation with the bearish move below the lower boundary Bitcoin is now forming an ascending-wedge-formation marked in my chart in orange with the blue boundary, furthermore, Bitcoin initiated this wave-count within the formation already completing waves A to C and now setting up to form the further waves D and E, also this wedge-formation is the wave B of this larger downside swing with the wave C upcoming next times, when Bitcoin completes the wave-count here and finally moves below the lower boundary to the downside it will complete the wedge-formation and activate the further bearishness to form the wave C within the schedule.
Bitcoin is in a situation where it has completed a serious bearish formation that should not be underestimated in any way here especially as we have seen the strong bearish selling pressure last time we should be prepared for more of this to come. Therefore with the wedge-formation as suggested developing below the lower boundary of the bear flag this will move into a continuation when Bitcoin completes it especially as when the wave-count ends up again with this strong upper-resistance where a pullback is highly likely. When Bitcoin shows up with these decisive determining price-actions here it will move into the lower supports marked in my chart in blue which will be crucial in terms if Bitcoin manages to hold these or continues bearish further.
In this manner, thank you for watching the analysis, have a good day and of course good trading, all the best!
"Foresight is better than hindsight."
Information provided is only educational and should not be used to take action in the markets.
Bitcoin, Completes H-S-Formation, These Are Objections!Hello Traders Investors And Community,
Welcome to this analysis about Bitcoin, we are looking at the 30-minute timeframe perspective, the recent events, the established formational structure and what to expect the next times. As I discovered Bitcoin has formed an interesting formation within the schedule that also already fully completed and therefore activated downside targets, besides that there are some worthwhile objections for a possible recovery given that can especially determine a stabilization when Bitcoin shows up with the proper price-action, therefore I detected all the important levels and likely outcomes we should consider with Bitcoins established structure and the upcoming movements ahead.
Structural Developments:
As when looking at my chart we can watch there how Bitcoin just completed this major head-and-shoulder-formation within the structure, the formation is marked in orange in my chart with the blue neckline, recently Bitcoin already strongly formed the breakout below the neckline and showed up with increased selling pressure after it, the next times we can expect Bitcoin to move up some higher from here to test the remaining resistance marked in my chart between the 38600 and 38900 level in red where several resistances lying consisting of the neckline-resistance, the 30-EMA-resistance in red and also horizontal resistance all together forming this strong resistance-cluster where the pullback will be highly likely determined further.
Upcoming Perspectives:
Upcoming times as Bitcoin will likely firstly continue with the bearishness till there is support found this will move into the back-up-cluster marked in blue in my chart where Bitcoin has a solid possibility to recover, back-up and test upper resistances anew, in this case, it is from high importance that Bitcoin really stabilizes above this cluster and forms some substantial bull-moves because when this does not happen and Bitcoin increases with bearish pressure further this will invalidate the bullishness when moving below the cluster and below the several supports lying there, this bearish dynamic should in any case not be underestimated here and we should be prepared also for this and possible pullbacks when Bitcoin tests higher levels again.
In this manner, thank you for watching the analysis, have a good day and of course good trading, all the best!
"The high destiny of the market is to explicate rather than to speculate."
Information provided is only educational and should not be used to take action in the markets.

3/10 HEAD & SHOULDERS- BTC TO 39KHey guys,
We have had a big rally to over 40.000USD per BTC.
In the last days, the market notices a rejection combined with a recovery.
The bounce-back of these levels could lead Bitcoin to retest recent highs, finding 39.000USD as an important Level.
Hitting a temporary bottom with high volume turning into low volume could suggest a bounce back to higher levels for a slight 20% up!
RSI looks good as well while forming a Head & Shoulders pattern, which often appears when a change in trend is upcoming. It acts as a reversal pattern!
Let us see how this chart idea turns out.
Thank you for tuning in,
happy trading,
roman from ger-quality-trades

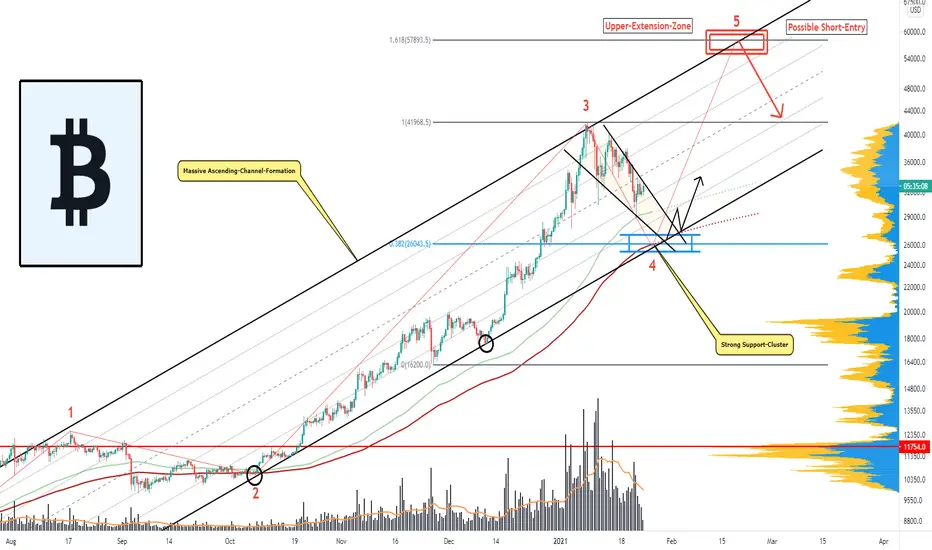
Bitcoin, Develops Massive Ascending-Channel, Important Zones!Hello Traders Investors And Community,
Welcome to this analysis about Bitcoin, we are looking at the 12-hour timeframe perspective, the recent events, the established formational structure, and what we can expect over the upcoming times. As Bitcoin, the last months and weeks has shown up with strong exaggerated bullish volatility to the upside almost gaining huge upside Bitcoin showed up with an initial bearish pullback to the downside that should not, in any case be underestimated here as the bearish downside volatility was just too strong and it is not seldom seen that the market continues after such initial moves, therefore I detected how this can look like and how Bitcoin can continue further within the next destinies.
As when looking at my chart we can watch there how Bitcoin now developed this massive ascending-channel-formation with the boundaries marked in black within my chart, currently Bitcoin is not only testing resistance within the channel but also moves into local resistance and Fibonacci-resistance lying there, furthermore, Bitcoin is within this coherent protracted wave-count with the waves 1 to 3 already completed therefore the wave 4 is outstanding the next times which will complete when Bitcoin forwards with the correctional wave-count within the wave 4, this will happen when Bitcoin moves below the middle line of the channel marked in my chart in dashed grey, in this case, the lower strong support-cluster will serve as solid support.
Bitcoin is trading in a situation where it has developed this massive formation with the huge volatile price-swings within the formation, such swings can provide good opportunities when this is done right as we have managed with trading the recent bearish wave all the way to the downside, now when Bitcoin should continue with this dynamic and proceed with forming the major wave 4 within the schedule it will run into the great support-cluster lying there possibly the origin of the final wave 5 to the upside completing the wave-count, however, this will be crucial as Bitcoin will run into the extension-level marked in my chart in red and also the resistance lying there, in this case, the zone can be a considerable short-zone as the wave-count will also be completed.
In this manner, thank you for watching the analysis, have a good day and of course good trading, all the best!
"There are many roads to prosperity, but one must be taken."
Information provided is only educational and should not be used to take action in the markets.

Bitcoin, Builds Massive H-S-Formation, Possibilities Given!Hello Traders Investors And Community,
Welcome to this analysis about Bitcoin, we are looking at the 4-hour timeframe perspective, the recent events, the established formational structure, and what we can expect in the upcoming times. As Bitcoin has shown up with strong protracted bearish volatility to the downside it has found some support in the structure which it still holds nevertheless this support is extremely crucial here because when Bitcoin closes below this results in further increased bearish pressure, besides that, I discovered a worthwhile formation that will be the determining source within the next times, therefore I detected all the important levels and likely outcomes we should consider with Bitcoins established structure and the upcoming movements.
Head-And-Shoulder Developments:
When looking at my chart we can watch there how Bitcoin is about to form this massive head-and-shoulder-formation with the left shoulder and the head already developed in the range with the neckline marked in blue in my chart. The last time's Bitcoin has found support within the neckline and also within the 100-EMA marked in blue in my chart this is why we can expect the right shoulder to establish further from here, in this case, Bitcoin has major resistance-levels lying higher in the structure marked in my chart between the 38400 and 38500 levels in red where several resistances coming together consisting of the descending-resistance-line, the horizontal resistance and also Fibonacci-resistance.
Upcoming Perspectives And Likely Possibilities:
Taking all these factors into consideration it will be determining how this right shoulder further establishes within the structure, with Bitcoin moving into the strong resistance-cluster we can expect a bearish pullback to show up from there finalizing the right shoulder and completing the whole formation, in this case, the crucial point will come with Bitcoin moving into the neckline from where the final decision will show up, therefore the bearish case has a higher likelihood as Bitcoin is still in a bearish edge and as such formations have the higher tendency to complete bearishly to the downside, also the volume is matching in this case, therefore it will be decisive how Bitcoin finally completes with this more likely expectations.
In this manner, thank you for watching the analysis, have a good day and of course good trading, all the best!
"Prospect is the ingredient of good fortune."
Information provided is only educational and should not be used to take action in the markets.

Here Is Why Bitcoin Forms A Potential Bear-Flag-Formation!Hi my friends,
Welcome to this analysis about Bitcoin, we are looking at the 45-hour timeframe perspective, the recent events, the established formational structure, and what we can expect in the upcoming times. As Bitcoin has shown up with these strong protracted bearish volatility to the downside after moving into the 41000 USD zone and pulling back there it has somewhat recovered marginally for now and it is a big question if Bitcoin manages to recover right away within this zone or if Bitcoin just sets up to form the next bearish volatility to the downside, therefore I detected all the important levels and likely outcomes we should consider with Bitcoin in the established structure and upcoming movements.
Structural Developments:
As when looking at my chart we can watch there how Bitcoin now bounced from the 30600 levels to the upside and formed these initial up moves in the structure, for now, this is not a concrete reversal and besides that Bitcoin is trading within this ascending-channel-formation marked in my chart in black where it is currently testing the lower-boundary, furthermore, Bitcoin has developed this coherent wave-count within the channel with the wave A and B almost completed in the structure and with the bounce into the lower boundary and the 600-EMA lying there found good support that can be the origin for the next wave C to the upside which will complete the whole wave-count and run into the strong resistance-layers remaining.
Upcoming Perspectives:
Taking all these factors into consideration the completion of the wave-count within the channel will be extremely crucial as Bitcoin will run into the strong upper resistance-cluster marked in my chart in red from where a pullback is highly likely when Bitcoin moves into this cluster, when the pullback then finally moves below the lower boundary of the channel and closes there as it is marked in my chart it will complete the channel as a bear-flag and activate lower levels to be reached, in this case, Bitcoin will first move into the bear-flag-target in blue which will be extremely important to hold because when this does not happen bearishness will increase further within the bearish-continuation-zone, for now, it will be determining how Bitcoin develops further within the channel-formation.
In this manner, thank you for watching the analysis, have a good day and of course good trading, all the best!
"Prospect is the ingredient of good fortune."
Information provided is only educational and should not be used to take action in the markets.

BITCOIN | Buying Areas!Hi,
Looks like some sort of correction has started with the price of Bitcoin and currently should have a perfect time to look up some buying areas.
Last week I did a technical analysis of 20 altcoins to find technically good buying areas. A lot of them needed a BTC correction to reach there, we got it, and some have already reached and some are starting to approach strongly the buying areas - you can look them up on related ideas, just down below of this post.
Okay, let's jump back to BTC, I have pointed out two major buying opportunities/areas, one is short-term and one is long-term.
Starting from the higher box, short-term, it stays around 30k and technical criteria:
1) Previously worked support level
2) The round/psychological number 30k
3) 4H EMA200, the price of Bitcoin hasn't touched it more than 3 months on the 4-hour timeframe and if it does it then there are quite good odds that we also get a rejection of it!
For me, it is a short-term opportunity (target 35k), because there might form a bearish chart pattern called Head and Shoulders and in general 35k level has played a role during the previous price action.
The lowe box, the major box, THE b-u-y-i-n-g area.
Obviously, it can take some time if it reaches there but you better be ready for it!! I consider it as a long-term buying area and the criteria are:
1) The famous previous ATH acting as a support level.
2) Round number 20k
3) 50% drop from the current ATH. IF the price of BTC reaches there without making a new all-time high then it would be PERFECT, because these 50% drops from ATH (or previous peak) are very powerful areas to make a buy.
4) Fibonacci retracement Golden ratio 62%
5) Daily EMA 200
“There is a time to go long, a time to go short and a time to go fishing.” - Jesse Livermore
Atm option A would be logical ;)
Regards,
Vaido

Bitcoin, Since Bearish Volatility, Decisive Formation Develops!Hi Traders,
Welcome to this analysis about Bitcoin, we are looking at the 2-hour timeframe perspective, the recent events, the current formational structure, and what we can expect the next times. Bitcoin recently has shown up with strong bearish declines after pulling back from the 41.500 USD level, this was a great opportunity for us within the channel to trade this major bearish move on the short-side giving us a great executed trade within the schedule, now as Bitcoin moved into the lower ranges and is somewhat testing the remaining support this can result in a decisive formation that will show the determinations when completed, therefore we are looking at all the important levels and likely outcomes to consider here.
As when looking at my chart we can watch there how Bitcoin now found support within this ascending-trend-line marked in blue and also within this important 200-EMA marked in light-blue, currently these supports are holding and when Bitcoin increases with bullishness from here it will move on to test the upper levels of resistances that are marked in my chart within the red level and the strong resistance lying there ase there are coming several resistances together this is a level that should not be underestimated and therefore we can expect a pullback to emerge from there firstly moving into the lower levels in the structure firstly and testing them, overall this will determine the major head-and-shoulder-formation.
Taking all these factors into consideration the formation Bitcoin is forming here will be the decisive factor in the upcoming times and it has to be noted that such a formation either completes bullishly or bearishly with a higher tendency to confirm bearishly, this is why the bearish perspective and breakout should be more expected here however it is from inevitable importance and necessary to wait on the proper confirmations before moving into the final direction of which one the bearish side has a higher possibility as already mentioned. Especially when this formation completes bearishly this will cause an increase of bearishness and point to lower levels to be reached, for now, it will be crucial how the right shoulder develops.
In this manner, thank you for watching the analysis, have a good day and of course good trading, all the best!
"Prospect is the ingredient of good fortune."
Information provided is only educational and should not be used to take action in the markets.
