BITCOIN CRASH INCOMING!!! (Brace Yourself Now???) I am breaking down MARKETSCOM:BITCOIN and the potential completion of the 4th wave on an leading diagonal which might work as an early warning of a crash towards $93k!
Wait for the confirmations, and play the market with a proper trading strategy that you have backtested enough to be able to say that you will be long-term profitable. That means make sure your trading system is good enough that you always have an edge and a great enough money management system to make sure that you are giving your edge enough space to play out in the long run and be robust against losing streaks!
Bitcoin (Cryptocurrency)

Is Bitcoin Working Out a New Leg Up? Onchain Data Says It May BeDiamond hands are waving goodbye and institutions are loading up — it’s why Bitcoin may be struggling to break out of its current consolidation range. How long can this accumulation phase continue?
And yes — we look at the trades of the decade — two transactions where each one moved a cool billie from a $7.8K investment in 2011.
Some people cling to their Bitcoin BITSTAMP:BTCUSD stash like it’s their last protein bar before a marathon. Others, apparently, wake up one day and decide to dump their coins and browse the market for islands.
Welcome to the silent shift that’s redefining the big players in the Bitcoin market, worth about $2.2 trillion as per data from our Crypto Coins Heatmap .
Old-school whales — the very early adopters and miners holding the OG wallets — are quietly selling, while institutional heavyweights sweep in to buy every dip (part of the reason why lately every breakout never breaks out).
Over the past year, these OG whales have shed about half a million Bitcoin — worth north of $50 billion — according to data from 10x Research. And guess who’s gobbling it all up? ETFs, corporate treasuries, and family offices that didn’t want anything to do with crypto five years ago.
Is it bullish? Is it bearish? Is it just Bitcoin being Bitcoin? Let’s pull up the charts, squint at the data, and see what the world’s most famous digital coin might be plotting next.
📈 A Record High — And Now What?
So here’s the setup. Bitcoin has been strutting under its record high of $111,000 for months now. You’d think the hype machine — from Trump’s pro-crypto administration, to corporate balance sheets going full Michael Saylor (looking at you, GameStop NYSE:GME ) — would send BTC blasting past the Moon and landing on Mars.
Instead? It’s just... chilling. Volatility’s drying up like the last drop of liquidity in a summer Friday session. And the reason is surprisingly simple: the massive handover happening between big, anonymous early adopters and the suit-and-tie institutional crowd.
😌 From Wild Ride to Easy Cruising?
You could argue this is exactly what Bitcoin needs: maturity, respectability, less drama. But don’t tell that to the day traders who want 20% swings before breakfast. As these whales get out and institutions get in, analysts say the upside could be capped at a chill 10% to 20% a year.
Good news for your retirement portfolio, maybe not so great for that “Lambo by Labor Day” dream.
Institutions now hold about 25% of all Bitcoin in circulation — and once these get in, they tend to sit tight for years.
🚀 The $1.1 Billion Time Capsule
Speaking of whales: ever wonder what happens when a Bitcoin wallet goes dark for 14 years? It pops back online to make your mind melt.
On April 3, 2011, a wallet labeled “1HqXB...gDwcK” moved 23,377 BTC to three addresses. At the time, Bitcoin was worth a mere 78 cents. Fast forward: two of those receiving wallets, each with 10,000 BTC, sat dormant for over a decade.
This month, both wallets moved their treasure troves — worth over $1.1 billion each — within 30 minutes of each other. Talk about a coordinated exit. What’s behind the move? Tax planning? A lost key finally found?
A savvy crypto thief who figured how to crack the earliest key generation method? We may never know. Also, OG guy, if you’re reading this — props for the all-at-once move without even a test transaction.
⛓️ What Onchain Data Says
Onchain data is like reading tea leaves for nerds with Bloomberg terminals. It says the supply is tightening — not because there’s less Bitcoin, but because fewer coins are actually available to trade.
When long-term holders move coins, that typically signals big-picture changes. Here’s the twist: the net effect has been… stability. Institutional demand, like Bitcoin exchange-traded funds , soaks up supply just as fast as whales drip it back in.
That’s why Bitcoin’s been stuck in this $100K–$110K limbo, ping-ponging while the accumulation phase is still going strong.
👀 So, Is a New Leg Up Coming?
This is where the optimists and realists start to bicker over the charts. On the one hand, the structural handover to institutions makes Bitcoin more credible, more regulated, and more boring.
But less volatility can mean steadier gains — especially if you believe that the world will always want an inflation hedge that no central bank can print into oblivion.
On the other hand, a sideways market can test your patience more than a typical drawdown. Some of the whales are gone, the suits have arrived, and the easy moonshots might not be so easy anymore.
🌱 The Trade-Offs of Growing Up
Bitcoin was born in the wild west of finance — an anonymous, volatile, meme-fueled phenomenon. Now, it’s drifting deep into the mainstream. That might limit the fireworks, but it also locks in its place as an asset class that’s not going away.
🌊 Closing Thoughts: The Next Billion-Dollar Move
Will we see another $7,800 investment turn into a cool $1 billion? Maybe not exactly like that. But the game isn’t over — it’s just evolving.
Keep your eyes on the whales, the ETFs, the Fed’s next move , and those onchain breadcrumbs.
Over to you , chart-watchers: does this calm consolidation make you bullish, bearish, or just plain bored? Share your thoughts in the comments!

111.65 against 105KMorning folks,
So we've got great entry with our H&S but it is early to relax. To avoid long explanations - BTC has to stay above 105K lows to keep current tendency valid. So, if you still plan to buy BTC here - you do not need to watch for too deep standing Fib levels.
If BTC will still drop below 105K, we could get extended downside action to 100K and maybe even deeper.
Nearest upside target with our current plan is 111.65K.

Bitcoin - Will Bitcoin record a new ATH?!Bitcoin is above the EMA50 and EMA200 on the four-hour timeframe and is in its medium-term ascending channel. Maintaining the specified support area will lead to the continuation of Bitcoin’s upward path and recording a new ATH. If it is corrected, we can look for Bitcoin buying positions from the specified demand zones.
It should be noted that there is a possibility of heavy fluctuations and shadows due to the movement of whales in the market and compliance with capital management in the cryptocurrency market will be more important. If the downward trend continues, we can buy within the demand area.
In recent days, Bitcoin has been stabilizing in a price range of around $107,000, with the market simultaneously witnessing a combination of short-term volatility and massive accumulation by institutional investors. A close examination of Bitcoin’s fundamental parameters shows that the market has entered a different phase than in the past; one that is no longer driven solely by momentary excitement, and that structured capital flows and on-chain data have formed its main axis. At the forefront of this trend are Bitcoin spot investment funds (Bitcoin ETFs), which reached their highest level of capital inflows in June. Total net inflows of these funds reached more than $4.5 billion last month, and on some days even approached more than $1 billion. Funds such as BlackRock’s IBIT and Fidelity’s FBTC now have billions of dollars in assets under management, a clear sign of increasing institutional participation in the Bitcoin market. These institutional investors are accumulating Bitcoin not with a short-term view, but with a long-term view and through legal means, which has reduced selling pressure and increased market stability.
On the other hand, the data from Anchin clearly shows that the market is in a steady accumulation trend. The amount of old Bitcoins held for more than 8 years experienced a significant growth of 5% in the second quarter of 2025. This statistic shows that long-term investors are not only reluctant to sell, but are still accumulating their assets. Also, the MVRV ratio, which indicates the relative profit or loss of the market, has decreased from 2.29 to 2.20, indicating mild and controlled profit taking by some investors, rather than widespread selling pressure or general panic. This rational behavior is a sign of market maturity and investors’ intelligence in managing short-term profits.
On-chain activity data also shows a similar trend. The average daily active addresses have reached around 1.02 million, indicating a decrease in market inflammation while maintaining overall dynamism. Other indicators such as Liveliness and Whale Accumulation also confirm that the amount of old transaction traffic has decreased and whales are mainly accumulating, not supplying. This trend is very valuable, especially in a market that has been far from explosive growth. From a macro perspective, the Bitcoin market is clearly in a consolidation and accumulation phase, but this consolidation is based on much stronger foundations than in previous periods. Institutional capital inflows via ETFs have reached over $50 billion, providing a strong foundation for continued growth. Also, some very old wallets that have been inactive for nearly 14 years have recently woken up and moved around $2 billion worth of Bitcoin. Although this could be a sign of potential supply, the market has not yet seen a significant negative reaction to it in the current market conditions and the market remains cautious.
Analysts believe that Bitcoin is in the third phase of its bullish cycle after the halving, which could bring gains of more than 120%. Some forecasts suggest a price range of $200,000-250,000 by the end of this year; however, the realization of such levels is subject to stable macroeconomic data, ETF performance and the absence of severe geopolitical shocks.
Finally, it can be said that the Bitcoin market has now reached a maturity where even periods of consolidation tend to strengthen its fundamentals rather than weaken the market. High-powered institutional investors are entering, whales continue to accumulate instead of selling, and long-term investors also see a bright outlook for the coming months. In this phase, price levels of $125,000 to $140,000 are likely by the end of the summer if the current trend continues, while in the event of severe economic or political pressures, key support for Bitcoin will be in the $95,000 to $100,000 range. Overall, Bitcoin is moving slowly but steadily towards higher targets, with stronger support than at any time in its history.

#BTC Update #4 – July 7, 2025🟠 #BTC Update #4 – July 7, 2025
Bitcoin has been trading inside a supply zone , and its last impulsive move happened right into that area. While it tried to push higher again, I now see signs of rejection.
If this rejection holds, the first level I’m watching is $107,850 . Below that, there's a key support around $106,350 . Should this level break, we could see a deeper drop toward $102,650 , where an imbalance zone remains untested.
At the moment, short setups look more reasonable than longs but from a risk/reward perspective, I don’t see enough edge to take action yet. So for now, I’m not entering any position and will simply watch BTC’s next move .

Bitcoin H4 | Rising into a swing-high resistanceBitcoin (BTC/USD) is rising towards a swing-high resistance and could potentially reverse off this level to drop lower.
Sell entry is at 111,747.48 which is a swing-high resistance that aligns with a confluence of Fibonacci levels i.e. the 78.6% projection and the 127.2% extension.
Stop loss is at 113,000.00 which is a level that sits above a confluence of Fibonacci levels i.e. the 100% projection and the 161.8% extension.
Take profit is at 108,698.22 which is an overlap support.
High Risk Investment Warning
Trading Forex/CFDs on margin carries a high level of risk and may not be suitable for all investors. Leverage can work against you.
Stratos Markets Limited (tradu.com ):
CFDs are complex instruments and come with a high risk of losing money rapidly due to leverage. 63% of retail investor accounts lose money when trading CFDs with this provider. You should consider whether you understand how CFDs work and whether you can afford to take the high risk of losing your money.
Stratos Europe Ltd (tradu.com ):
CFDs are complex instruments and come with a high risk of losing money rapidly due to leverage. 63% of retail investor accounts lose money when trading CFDs with this provider. You should consider whether you understand how CFDs work and whether you can afford to take the high risk of losing your money.
Stratos Global LLC (tradu.com ):
Losses can exceed deposits.
Please be advised that the information presented on TradingView is provided to Tradu (‘Company’, ‘we’) by a third-party provider (‘TFA Global Pte Ltd’). Please be reminded that you are solely responsible for the trading decisions on your account. There is a very high degree of risk involved in trading. Any information and/or content is intended entirely for research, educational and informational purposes only and does not constitute investment or consultation advice or investment strategy. The information is not tailored to the investment needs of any specific person and therefore does not involve a consideration of any of the investment objectives, financial situation or needs of any viewer that may receive it. Kindly also note that past performance is not a reliable indicator of future results. Actual results may differ materially from those anticipated in forward-looking or past performance statements. We assume no liability as to the accuracy or completeness of any of the information and/or content provided herein and the Company cannot be held responsible for any omission, mistake nor for any loss or damage including without limitation to any loss of profit which may arise from reliance on any information supplied by TFA Global Pte Ltd.
The speaker(s) is neither an employee, agent nor representative of Tradu and is therefore acting independently. The opinions given are their own, constitute general market commentary, and do not constitute the opinion or advice of Tradu or any form of personal or investment advice. Tradu neither endorses nor guarantees offerings of third-party speakers, nor is Tradu responsible for the content, veracity or opinions of third-party speakers, presenters or participants.

Bitcoin (BTCUSD) - Daily Price Uptrend, Resistance Breakout TestBitcoin (BTCUSD) has been in a recent Daily price Uptrend, rallying up from the $100,000 price support level.
A SMA Golden Cross printed on May 21st, 2025.
Bitcoin price is attempting a resistance zone test and has yet to breakout and hold above the $111,000 to $112,000 price zone.
Resistance levels: $110,000 , $112,000 , $117,000 , $121,000.
Support levels: $108,000 , $107,000 , $105,000 , $104,000 , $100,000.
Recent crypto industry, government legislation news, and institutional crypto purchases have helped to keep Bitcoin price above $100,000 support.
Stock market correlation volatility could also affect the crypto market and prices for the next 30 to 45 days.

Bitcoin BTC Trade Plan: Watching for Breakout or Pullback Entry📊 Currently watching BTC (Bitcoin) as price action remains bullish overall, but we're approaching a key decision point 🎯
💹 Price is pushing higher, but with some signs of exhaustion after the recent rally ⚠️ — and with the weekend approaching, we could either see a continuation higher or a healthy pullback
I’m keeping an eye on two potential trade scenarios:
1️⃣ A break and clean retest of the recent high, which could offer a continuation long if momentum follows through 🚀
2️⃣ A retracement into equilibrium — a deeper pullback toward fair value 📉 — which could also present a high-probability long setup if confirmed with structure and reaction 📈
Either way, I’m letting the market reveal its hand and waiting for one of these setups to play out before committing 💡
💬 Not financial advice — always assess your own risk and confirm with your own analysis.

Bitcoin: Breakout To 113K Refuses To Pull Back.Bitcoin is poised to test the 113K resistance over the coming week. It has broken the upper trend line resistance and simply refuses to retrace in any meaningful way. With a continuously weakening dollar and other economic inflationary pressures, it will take a surprise negative catalyst to turn this around at least to the point of testing a high probability trend support on this time frame. Here is the way to play this environment:
Buying this breakout for time horizons longer than a swing trade requires a big risk tolerance. While this leg is likely to be the Wave 5 of 5 that I have been writing for some time and can see Bitcoin test some major new highs, investing here still puts you at the mercy of the market. The nearest support is around the 103 to 105K area at minimum and just not worth the risk in my opinion at current levels for INVESTING.
Swing trades are a great way to participate in the breakout continuation. Risk can best be defined by the current candle low or previous candle low. Profit objective now is 113K or 120K area. The Trade Scanner Pro actually called a long and offered numerous opportunities to enter over a week and a half ago. I have been reviewing this regularly on my live stream forecast every Monday at 3 PM ET. It helps immensely to have levels and risk defined for these type of situations in advance so that you know how to adjust your size.
Otherwise the optimal way to go about this is trade the smaller time frames. I will always suggest this near highs and breakouts on larger time frames. The reason is simple: risk can be tightly controlled. This requires some kind of rules or guidelines to judge the market, along with a way to confirm. Using the Trade Scanner Pro for example, the analysis component is easy: trend is bullish on all small time frames. This means you wait for a trade suggestion on the time frame that you regularly trade (1 min or 5 min f or example).
No matter what type of trend following system or rules you use, by aligning with the bigger picture and confirming a setup in some way is what puts the probabilities on your side. The smaller the time frame you operate, the more precise your risk management can be.
Thank you for considering my analysis and perspective.

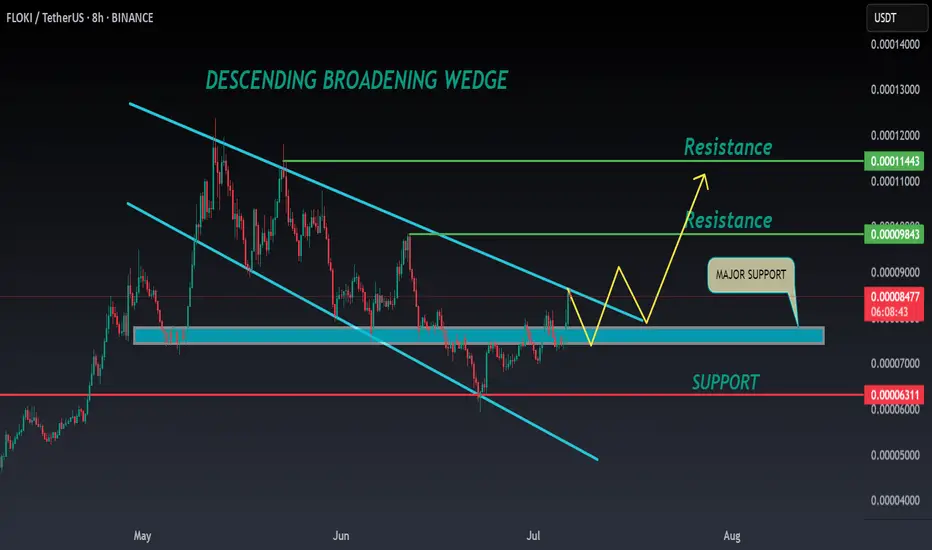
FLOKI ANALYSIS🔮 #FLOKI Analysis 🚀🚀
💲💲 #FLOKI was trading in a Descending Broadening Wedge Pattern, and trying to breakout the pattern. Also there is a instant support zone and after the breakout of resistance zone we will see a bullish move. 📈📈
💸Current Price -- $0.00008540
📈Target Price -- $0.00009840
⁉️ What to do?
- We have marked crucial levels in the chart . We can trade according to the chart and make some profits. 🚀💸
#FLOKI #Cryptocurrency #Breakout #DYOR
TradeCityPro | Bitcoin Daily Analysis #120👋 Welcome to TradeCity Pro!
Let’s dive into the Bitcoin analysis and key crypto indices. As usual, in this analysis I want to review the futures triggers for the New York session.
⏳ 1-Hour Timeframe
In the 1-hour timeframe, as you can see, Bitcoin has finally broken out of the range it formed yesterday and is now moving upward.
✔️ If this upward move continues, we can open a long position in these zones by getting confirmation in the lower timeframes. The main long trigger is still activated after breaking 110256.
💥 The RSI oscillator entered the Overbuy zone in the previous candle. We need to see how the price reacts to this move and what impact this oscillator will have on the price.
⚡️ In my opinion, this RSI move won't have much impact. Although the price is moving upward, the main trend has not yet formed, so there's no real momentum in the market, and RSI is basically useless for now.
✨ If this upward move turns out to be fake, we can enter a short position with the 107853 trigger.
👑 BTC.D Analysis
Let’s look at Bitcoin Dominance. Yesterday, dominance had an upward move and broke its ascending trendline but failed to stabilize above 65.52, resulting in a fake breakout and a move downward.
☘️ The fake breakout trigger for the trendline was the 65.38 zone, which was activated, and now the price is heading downward. If this move continues, the next target will be 65.04.
📅 Total2 Analysis
Alongside Bitcoin’s upward move, this index also activated the 1.14 trigger and is moving up, now reaching 1.15.
💫 If the move continues, the next entry trigger is at 1.17, which is still quite far from the current price.
📅 USDT.D Analysis
Looking at Tether Dominance, the 4.82 trigger was activated, and dominance is now moving down, having reached 4.78.
📈 If it stabilizes below 4.78, we can confirm the continuation of the downtrend in dominance, which could push it down to 4.72.
❌ Disclaimer ❌
Trading futures is highly risky and dangerous. If you're not an expert, these triggers may not be suitable for you. You should first learn risk and capital management. You can also use the educational content from this channel.
Finally, these triggers reflect my personal opinions on price action, and the market may move completely against this analysis. So, do your own research before opening any position.

Bitcoin can rebound from resistance level and start to declineHello traders, I want share with you my opinion about Bitcoin. Recently, the price broke above a local resistance and quickly approached the key resistance level at 110000, which also aligns with the upper boundary of the seller zone (110000 - 110700 points). This area has already proven its strength multiple times, causing sharp rejections in the past. Moreover, the price has tested it again recently and failed to break through. In addition, we can see a triangle structure, which fits the logic of a pennant pattern after a bullish wave. However, the latest move upward has already lost momentum near the apex, and the price is now trading just under the upper edge of this formation. That makes this zone technically overloaded and vulnerable to a downside reversal. Based on this, I expect Bitcoin to test the resistance level one more time and then roll back down toward TP 1 at 106000 points, a zone near previous liquidity accumulation and a local consolidation range. If selling pressure increases, the price might aim for the buyer zone (103800 - 103100). Given the current rejection at resistance, the structure of the triangle, and the reaction inside the seller zone, I remain bearish and expect further decline toward the support. Please share this idea with your friends and click Boost 🚀
Disclaimer: As part of ThinkMarkets’ Influencer Program, I am sponsored to share and publish their charts in my analysis.

BTC - Bulls Getting Ready!!Hello TradingView Family / Fellow Traders. This is Richard, also known as theSignalyst.
📈BTC has been bullish trading within the flat rising wedge marked in blue and it is currently retesting the lower bound of the wedge.
Moreover, the orange zone is a strong demand.
🏹 Thus, the highlighted blue circle is a strong area to look for buy setups as it is the intersection of demand and lower blue trendline acting as a non-horizontal support.
📚 As per my trading style:
As #BTC approaches the blue circle zone, I will be looking for bullish reversal setups (like a double bottom pattern, trendline break , and so on...)
📚 Always follow your trading plan regarding entry, risk management, and trade management.
Good luck!
All Strategies Are Good; If Managed Properly!
~Rich

BTC ANALYSIS🌸#BTC Analysis : Bullish Trend 🚀🚀
🚀As we can see that there is a formation of Flag & Pole Pattern in #BTC in daily time frame. Right now we can see that #BTC again retest from the resistance zone and we can see a bounce back from its support zone 💪
🔖 Current Price: $1,08,050
⏳ Target Price: $1,20,000
⁉️ What to do?
- We can trade according to the #BTC chart and make some profits. Keep your eyes on chart price action, observe trading volume. Always observe market sentiments and update yourself everyday.🔰🔰
#BTC #Cryptocurrency #Breakout #TechnicalAnalysis #DYOR
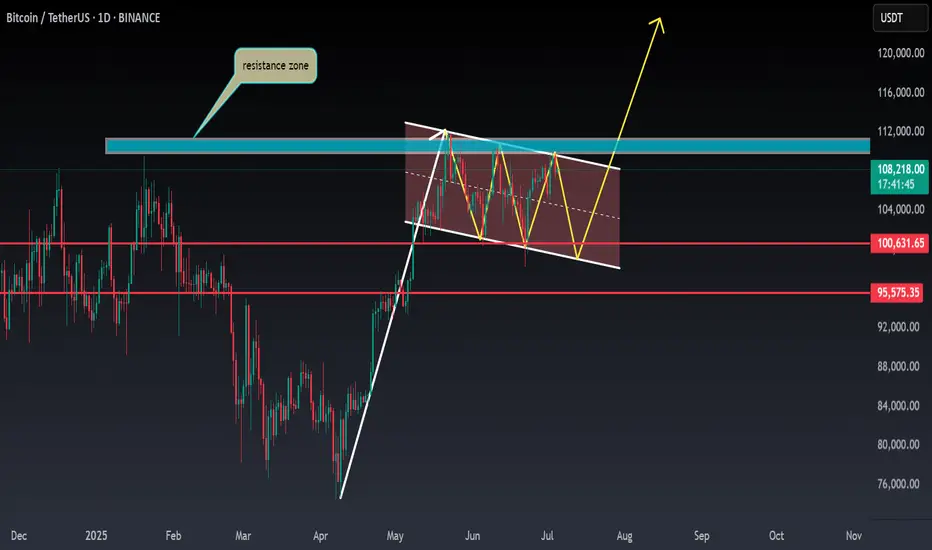
BTC - Bullflag Pattern points to new ATHMarket Context
Bitcoin has been trading within a well-defined descending channel for several weeks now, respecting both upper and lower boundaries with precision (3 touches on the top, 2 on the bottom). This structure suggests an orderly pullback after a strong impulsive leg to the upside in Q2. As price compresses within this flag-like pattern, market participants are watching closely for signs of breakout or breakdown.
Bullish Fair Value Gap Reaction
Recently, price dipped into a Daily Fair Value Gap (FVG) and bounced strongly — a key bullish signal indicating that demand stepped in at the inefficiency. The FVG also aligns with a retest of the channel’s resistance-turned-support, further validating the bounce. This confluence zone acts as a springboard for potential continuation.
Channel Breakout & Liquidity Above ATH
Price has now broken above the channel structure, shifting the market narrative from consolidation to potential expansion. The breakout zone is located just beneath the All-Time High (ATH) — an area that’s likely loaded with stop orders and breakout buys. A sweep or clean break above the ATH would not only invalidate the prior bearish structure but also trigger a fresh wave of bullish momentum.
Bull Flag Continuation Potential
Structurally, this chart presents a classic bull flag breakout. After a strong impulsive leg up and a controlled consolidation phase, we now see bullish continuation potential toward the 112,000–114,000 region. If the ATH gets breached and reclaimed, it could become strong support in the next leg higher.
Final Thoughts
This is the type of setup that blends both technical precision and market psychology — structure, liquidity, and momentum all coming together. Whether you're already long or watching for confirmation, this move could set the tone for Bitcoin’s next major rally.
If you found this analysis helpful or thought-provoking, please give it a like! And let me know in the comments — do you see this as a true breakout or a trap in disguise?

ES, SPY, SPX will be testing key support on Sunday After a welcome rally into new highs for the s&p, there appears to be a critical crossroad forming. Using the ES continuous contract I have placed 2 anchored VWAP's. The first being anchored to the last higher low on Thursday, June 19. And the the second, being anchored to this last Thursdays high on July 3rd.
For this post we will call the anchor from June 19 - VWAP1. And for the July 3rd anchor - VWAP2
VWAP1 r1 has acted as a key support line since the higher low was set. Successfully bouncing and holding support several times.
As we headed lower on this Thursdays July 3rd session, we remained between the center and r1 of VWAP2 indicating strong selling pressure for the day. With it being a shortened trading day with less liquidity however, I have less concern over the days price action. The forming crossroads and the upcoming Sundays open will be more telling for where we likely head this week.
The blue Horizontal Line at 6266 is placed directly on VWAP1s r1 (green line) which has acted as support. If we trade into this level on the Sunday open, it's a clear signal the sellers are still in control. If however, price can consolidate at that level (6266) and form structure, a breakout of the structure would be evidence of sellers backing off and buyers stepping in creating a good buying opportunity for the week.
Another possible scenario, if we first manage to trade up into s1 of VWAP2 (orange line) around the 6300 level, I will be looking for a short scalp down to the r1 of VWAP1 at 6266. From here it would be prudent to sit and wait for more confirmation on if this is a reversal, or just another pullback in the uptrend.
These are my two trade setups and ideas for Sunday's open. Hope this analysis helps. Happy trading 🤙💰📈

HelenP. I Bitcoin may correct to support level and continue growHi folks today I'm prepared for you Bitcoin analytics. If we look at the chart, the price has formed a clean upward channel after bouncing from the strong support zone at 103500 - 103000 points. This movement marked the beginning of a new bullish phase. Price continued to rise step by step, confirming the structure with higher highs and higher lows. After reaching above 110000 points, it made a minor pullback but still trades above Support 1 - 108800 points. This zone, 108800 - 108200 points, aligns well with the midline of the channel and may serve as a strong area for buyers to re-enter. The price is currently trading around 110382 points and is still respecting the channel structure. As long as BTCUSD stays above the support zone and inside the ascending channel, I expect a potential continuation toward the upper boundary. My current goal is 114000 points - near the resistance line of this bullish channel. Given the strong trendline support, clean reaction at each correction, and buyer activity on lows, I remain bullish and anticipate further growth. If you like my analytics you may support me with your like/comment ❤️
Disclaimer: As part of ThinkMarkets’ Influencer Program, I am sponsored to share and publish their charts in my analysis.

BITCOIN - Price can drop from resistance area to $103000Hi guys, this is my overview for BTCUSD, feel free to check it and write your feedback in comments👊
Some days ago, price entered a pennant pattern, where it at once made an upward impulse from support line.
Then the price reached $98700 level and soon broke it, after a small correction, and then continued to move up.
Later BTC rose to the resistance line of the pennant, but soon turned around and started to decline, breaking $110000 level.
Price little corrected and then tried to bounce back and failed, after which it fell to $98700 level and then started to grow.
In a short time, BTC rose to a $110000 resistance level and tried to break it again, but recently turned around and started to fall.
Now, I expect that BTC can grow to the resistance area and then drop to $103000 support line of the pennant.
If this post is useful to you, you can support me with like/boost and advice in comments❤️
Disclaimer: As part of ThinkMarkets’ Influencer Program, I am sponsored to share and publish their charts in my analysis.

LITECOIN (LTC) - On The Verge Of Exploding - ETF Catalyst?Litecoin: A Decentralized Network with a Differentiated Risk Profile
Litecoin (LTC), launched in 2011 by former Google engineer Charlie Lee, is one of the oldest and most active Layer-1 blockchain networks in the cryptocurrency space. Often referred to as the “digital silver” to Bitcoin’s “digital gold,” Litecoin was designed to offer faster transactions, lower fees, and broader accessibility while maintaining a similar monetary policy and codebase.
This post aims to provide an overview of Litecoin’s technical structure, usage, risk profile, and current developments—without speculative bias—so readers can form their own assessments.
1. Transparent Origins and Founder Dynamics
One key difference between Litecoin and Bitcoin lies in the identity of their respective creators. Bitcoin was developed by Satoshi Nakamoto, a pseudonymous and still-unknown individual or group, who is estimated to hold 750,000 to 1.1 million BTC—a significant portion of the total supply that has never moved. The dormant status of these holdings has occasionally raised concerns about future market impact if they were ever activated.
In contrast, Litecoin was founded by Charlie Lee, a known and public figure who was active in the community before, during, and after the launch. In 2017, Lee announced he had sold or donated nearly all his LTC holdings to avoid any potential conflict of interest. Today, no founder or insider is known to hold a disproportionate share of the Litecoin supply. This level of transparency and decentralization has been interpreted by some as a factor that lowers long-term governance and concentration risk.
2. Structural Simplicity and Leverage Exposure
Another distinction between Litecoin and Bitcoin lies in market structure and exposure to leverage.
Bitcoin is widely used as collateral in crypto lending markets and institutional derivatives, including perpetual futures and structured products. This has introduced significant systemic risk during periods of market stress, as high leverage has historically led to cascading liquidations across centralized and decentralized platforms.
Litecoin, in contrast, has relatively limited exposure to leveraged products and collateralized lending. It is not commonly used as collateral in CeFi or DeFi protocols, and institutional futures markets for LTC are smaller and less active. As a result:
Litecoin is less likely to trigger or be affected by mass liquidations
It has reduced systemic risk due to lower market entanglement
Its price tends to reflect more organic supply/demand dynamics
It is less involved in cross-collateralized or rehypothecated loan systems
This simpler structure may appeal to risk-aware investors looking for cleaner exposure without the reflexivity effects common in heavily leveraged markets.
3. Scarcity and Monetary Policy
Litecoin shares a similar deflationary model with Bitcoin, with a hard cap of 84 million LTC and scheduled halving events every four years. The most recent halving occurred in August 2023, reducing the block reward from 12.5 to 6.25 LTC per block.
With over 75 million LTC already mined, fewer than 9 million remain in future issuance. The protocol’s monetary policy is deterministic and cannot be altered unilaterally, which may appeal to those who prioritize predictable supply and inflation resistance.
While Litecoin’s cap is four times higher than Bitcoin’s, the relative issuance schedule and halving dynamics mirror Bitcoin’s design. Some investors view this as a hedge against fiat currency debasement, although the asset's volatility and adoption context should be taken into account.
4. Network Fundamentals and Real-World Use
Litecoin has maintained near 100% uptime since inception, and its transaction throughput and fee structure are generally favorable compared to many competing networks.
In 2024, Litecoin became the most used crypto for payments via BitPay, surpassing Bitcoin in transaction volume, driven by its fast 2.5-minute block times and low transaction fees. It is supported by major platforms including PayPal, and accepted by thousands of online and retail merchants.
From a security perspective, Litecoin’s hashrate reached all-time highs in 2025, partly due to merge-mining with Dogecoin, which has helped strengthen its proof-of-work infrastructure. Network upgrades like MWEB (MimbleWimble Extension Blocks) have added optional privacy layers to Litecoin’s UTXO model, while Lightning Network integration supports instant payments.
These developments suggest that Litecoin continues to evolve, with emphasis on efficiency, user privacy, and practical usability.
5. Institutional Presence and ETF Outlook
Litecoin has seen modest but growing institutional involvement. Products such as the Grayscale Litecoin Trust (LTCN) have existed for several years, and Coinbase introduced Litecoin futures trading in 2024. Fidelity also offers LTC trading and custody to institutional clients.
More notably, a Spot Litecoin ETF application is currently under review by the U.S. Securities and Exchange Commission (SEC), with analysts from Bloomberg estimating a 95% probability of approval before the end of 2025. If approved, this would make Litecoin one of the first proof-of-work assets outside of Bitcoin to gain direct exposure through a regulated ETF vehicle.
Should that happen, it may increase access, liquidity, and legitimacy among traditional investors. However, as always, regulatory decisions remain uncertain and subject to broader political and market conditions.
6. Technical Structure and Long-Term Price Action
From a macro-technical perspective, Litecoin has historically followed a pattern of higher lows and higher highs across each market cycle. This structure remains intact as of 2025, with a strong support at 81 USD on a 6 months timeframe.
Summary
Litecoin presents a combination of characteristics that differentiate it from other crypto assets, including:
✅ A public, transparent founder and no major insider dominance
✅ Limited exposure to leveraged lending, reducing systemic risk
✅ Deterministic monetary policy with a fixed supply and halving schedule
✅ Real-world usage in payments and retail adoption
✅ Strong network security and development activity
✅ Potential ETF approval that may broaden accessibility
These features do not necessarily imply outperformance, but they form the basis for an asset with a relatively clean structure, historical resilience, and a distinct position in the crypto ecosystem.
🔎 Disclaimer:
The information presented here is for educational and informational purposes only and should not be interpreted as financial advice.
Always conduct your own research, assess your individual risk profile, and make investment decisions based on your own analysis and objectives.

TradeCityPro | Bitcoin Daily Analysis #119👋 Welcome to TradeCity Pro!
Let’s go over the analysis of Bitcoin and the key crypto indexes. As usual, in this analysis I’m going to review the futures triggers for the New York session.
⏳ 1-Hour Timeframe
Yesterday, the price broke out of the range box between 108619 and 110256 that I had marked for you, and with the heavy selling volume that entered the market, this bearish move took place.
✔️ This move continued to the 107448 zone, and as you can see, we are now in a consolidation and rest phase, and once again the volume has dropped significantly.
✨ As I mentioned in yesterday’s analysis, I believe this low volume will persist through the weekend, and for a solid move to happen, we’ll need to wait for the new week to begin.
💥 For now, the price has room to move up to 108619 and perform a retracement. A break above the 50 zone on the RSI greatly increases the likelihood of this move.
📊 If selling volume re-enters the market and the price moves downward, the short trigger we have is the 107448 level, and breaking it could start the next bearish leg.
📈 For a long position, the price must first stabilize above 108619, and then, if we see that buying volume continues and increases, we can enter a long position. The main trigger will be 110256.
⭐ I myself won’t be opening any positions for now and will wait until the market shows some proper volume and trend before entering. If you plan to open a position based on these triggers, I suggest you take on very little risk so that in case your stop-loss is hit, you don’t lose much money.
👑 BTC.D Analysis
Let’s look at Bitcoin dominance. Yesterday, dominance touched the trendline I had marked and is still dealing with this dynamic resistance.
💫 A bottom has formed at 65.38. If this bottom is broken, we’ll get confirmation of rejection from the trendline, and dominance could have a bearish move down to 65.04.
⚡️ If the trendline is broken instead, we’ll have a new trigger at 65.52, and breaking it would confirm a bullish reversal in dominance. The main trigger will still be a break of 65.64.
📅 Total2 Analysis
Now let’s move on to Total2. This index dropped to the 1.13 zone and has now pulled back to 1.14. It seems like it’s getting ready for another downward move.
☘️ If Bitcoin dominance gets rejected from the trendline and moves down, and if Bitcoin moves upward, Total2 could make a very sharp move.
🔑 Even if Bitcoin drops, Total2 might range or even move up. For now, our short trigger is 1.13, and aside from 1.14, we don’t have any specific long trigger.
📅 USDT.D Analysis
Finally, let’s look at Tether dominance. This index made a bullish move to 4.85 after breaking 4.78 and is now in a corrective phase.
📊 If 4.85 is broken, the next bullish leg could continue up to 4.93. If a correction happens, dominance might pull back to 4.78.
❌ Disclaimer ❌
Trading futures is highly risky and dangerous. If you're not an expert, these triggers may not be suitable for you. You should first learn risk and capital management. You can also use the educational content from this channel.
Finally, these triggers reflect my personal opinions on price action, and the market may move completely against this analysis. So, do your own research before opening any position.

BEst long on Btc is at $104 600CRYPTOCAP:BTC
Our plan is still bullish
But price reached VAH
That's why some pullback is possible
$104 600 is key zone for me. POC + VWAP. I`ll take a long trade in a case of local confirmation.

Candlestick Patterns - How to read them like a ProOverview
Candlestick charts serve as a cornerstone in technical analysis, presenting price activity in a visually digestible format. By examining how prices move over a given timeframe, traders gain key insights into potential market direction, sentiment shifts, and trend strength.
Mastering candlestick interpretation is essential for identifying bullish or bearish sentiment, as well as for spotting possible trend reversals or continuations. Still, candlesticks alone don’t paint the full picture—using them without broader context increases the risk of false signals.
---
What You'll Learn
What are candlestick charts?
Common bearish candlestick patterns
Common bullish candlestick patterns
How to apply candlestick analysis in trading
---
What is a Candlestick Chart?
A candlestick provides a snapshot of an asset’s price behavior during a specific time interval, whether it's one minute, one hour, or one day. This format allows traders to quickly assess how the price has moved within that period.
Each candle reveals four price points:
* Open – the price at the beginning of the interval
* Close – the price at the end of the interval
* High – the highest price reached
* Low – the lowest price during that time
Anatomy of a Candlestick:
* Body: The thick section between the open and close. A green (or white) body means the close was higher than the open (bullish), while red (or black) means the opposite (bearish).
* Wicks (or Shadows): Thin lines extending from the body to indicate the high and low.
* Upper wick: Marks the highest traded price
* Lower wick: Marks the lowest traded price
---
Bearish Candlestick Patterns
Understanding bearish candlestick patterns helps traders identify moments when buying momentum might be running out—setting the stage for a potential downward shift.
Evening Star
A three-candle formation that signals a shift from buying pressure to selling dominance. It starts with a strong bullish candle, followed by a small-bodied candle of indecision, and concludes with a large bearish candle that cuts deep into the first. This pattern often appears at the end of an uptrend.
Bearish Engulfing
This setup includes a small bullish candle followed by a large bearish candle that completely swallows the previous one. It indicates that sellers have seized control, potentially marking the beginning of a downward trend.
Shooting Star
With a small real body near the low and a long upper wick, this pattern reflects strong early buying that is ultimately rejected by the close—suggesting fading bullish momentum.
Gravestone Doji
This candle opens, closes, and hits its low all around the same price, leaving a long upper wick. It suggests that bulls pushed higher during the session but were overpowered by bears by the close.
Three Crows
Three consecutive bearish candles, all approximately the same size. These indicate that a sell off is coming soon.
---
Bullish Candlestick Patterns
Bullish patterns can alert traders to possible reversals after a downtrend or strengthen conviction during an uptrend.
Morning Star
This three-candle formation marks a potential turning point from bearish to bullish. It begins with a strong bearish candle, followed by a smaller candle showing indecision, and ends with a large bullish candle breaking upward—signaling buying strength is returning.
Bullish Engulfing
This two-candle pattern begins with a bearish candle, then a larger bullish candle that completely envelops the previous body. It reflects a sharp transition in sentiment, suggesting renewed buying pressure.
Dragonfly Doji
A single candle where the open, close, and high are all very close, with a long lower wick. It shows sellers pushed prices lower but buyers stepped in and brought them back up—an early sign of possible reversal.
Hammer
A classic bullish reversal signal that features a small real body near the top and a long lower shadow. It indicates a battle where sellers initially dominated, but buyers managed to close near the open price.
Three soldiers
Three consecutive bullish candles, all approximately the same size. These indicate that a big buy is coming soon.
---
Trading with Candlestick Patterns
Candlestick patterns become more meaningful when they align with major chart areas—such as previous support or resistance, trendlines, or retracement zones. A bullish signal at a support level can hint that the downward pressure is fading, while a bearish pattern at resistance may warn of an upcoming decline.
To increase the reliability of your trades, combine candlestick patterns with other forms of technical analysis:
* Support & Resistance Zones: These are price levels where the market has historically reacted. Candlestick patterns forming near these zones have stronger potential implications.
* Fibonacci Levels : These help identify likely retracement areas. When a candlestick pattern forms near a key Fibonacci level like 61.8%, it adds strength to a potential reversal setup.
* Liquidity Areas: Clusters of orders (buy or sell) tend to create strong reactions. When patterns appear in these zones, they often precede more decisive moves.
* Technical Indicators : RSI, MACD, Moving Averages, and Stochastic RSI can provide confirmation. For instance, a bullish reversal pattern that appears when RSI is oversold strengthens the signal.
💡 Tip: Don’t rush into trades based on one candlestick alone. Always wait for the next candle or price confirmation (e.g., a break of a previous high/low) to validate your signal.
---
Thanks for Reading!
✨ If you found this helpful, show some love by liking or commenting!
🔔 Don’t forget to follow for more technical breakdowns and trading insights coming soon!

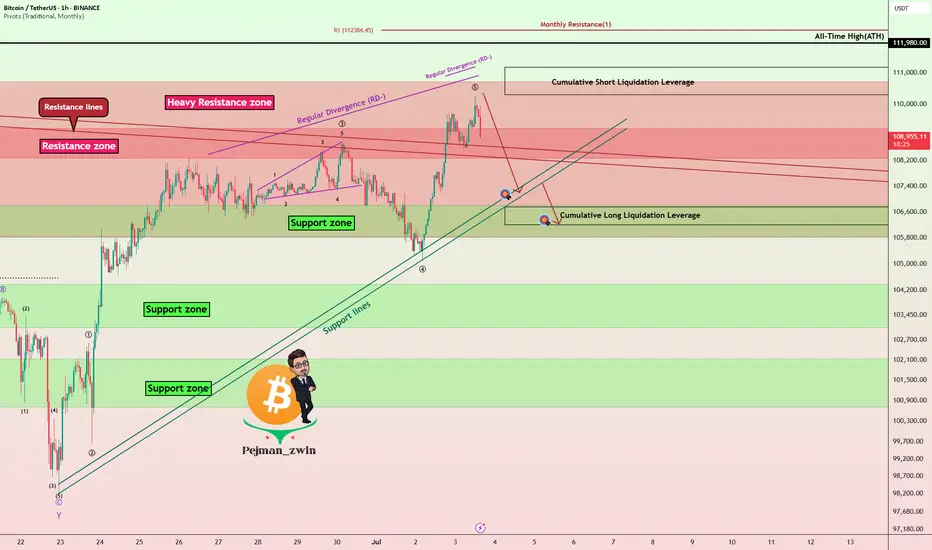
Bitcoin Roadmap => Short-termBitcoin ( BINANCE:BTCUSDT ) is moving above a Heavy Resistance zone($110,720-$105,820) , Cumulative Short Liquidation Leverage($110,300-$111,177) and is approaching All-Time High(ATH) .
Do you think Bitcoin will create a new All-Time High(ATH) in this rally?
In terms of Elliott Wave theory , Bitcoin's rise over the last two days appears to have been in the form of wave 5 .
Also, we can see the Regular Divergence(RD-) between Consecutive Peaks.
I expect Bitcoin to start declining in the coming hours. Targets are marked on the chart.
Cumulative Long Liquidation Leverage: $106,750-$106,202
Note: Stop Loss(SL)= $111,223
Please respect each other's ideas and express them politely if you agree or disagree.
Bitcoin Analyze (BTCUSDT), 1-hour time frame.
Be sure to follow the updated ideas.
Do not forget to put a Stop loss for your positions (For every position you want to open).
Please follow your strategy and updates; this is just my Idea, and I will gladly see your ideas in this post.
Please do not forget the ✅' like '✅ button 🙏😊 & Share it with your friends; thanks, and Trade safe.