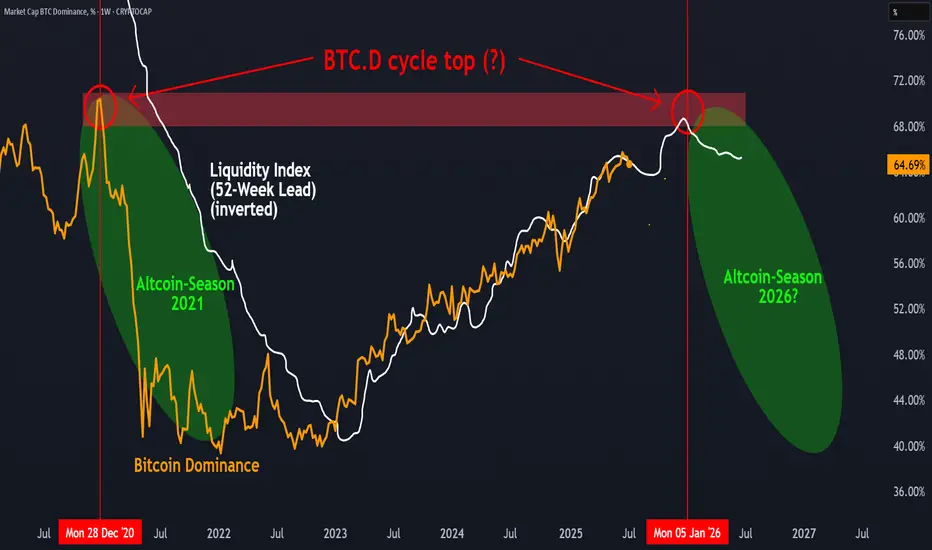
BTC.D Cycle top in?There are signs that Bitcoin Dominance (BTC.D) could be leaving a cyclical top, similar to what we saw in late 2020. When overlaid with the Global Liquidity Index (inverted and leading by 52 weeks), a potential correlation appears: previous peaks in liquidity were followed by turning points in BTC.D about a year later.
If this pattern repeats, a shift in market dynamics — possibly in favor of altcoins — could unfold over the coming year. However, this remains a hypothesis rather than a confirmed signal. The relationship between macro liquidity and crypto sector rotation is worth watching, but it’s not guaranteed to play out the same way again.
What’s your take: Altcoin Season loading or not yet?
Bitcoin (Cryptocurrency)
Bitcoin Rejected at Resistance – Sideways Trap Now Likely⚠️🚫 Bitcoin Rejected at $111,592 – Smart Money Took Profits, Not FOMO 💰📉
We called it yesterday. I urgently posted about the $111,592 level — one of the most important resistance zones in this structure. And right on schedule… Bitcoin tagged it and got rejected.
📍 This isn’t just luck. It’s structure + timing + discipline.
🔄 While many were eyeing a breakout, we were preparing for the expected rejection — and we took profits after long entries from just under $100K (as shown). This wasn’t the time to FOMO. This was the time to cash in.
🔎 Key Points from Today’s Market View:
We’re still inside the ascending channel, but testing the upper end
Multiple divergences on the 2-day chart are still active (8 counted). Many more across big timeframes.
The third macro resistance test is inbound — watch the 'where can Bitcoin go post below'
Current outlook favors a sideways chop — the classic liquidation zone where longs and shorts alike get punished
We might still get the breakout to $114,900 — but if that happens, it’ll come after more pain, not from clean momentum.
🧠 Bigger Picture:
If you missed the major chart update, watch:
👉 Where Can Bitcoin Go? Part 8
And if you want today’s broader outlook (including ETH, BTC.D, NASDAQ), catch the July 10th video:
👉 July 10th Market Outlook – Uncharted Waters
🗣️ Final Word:
What we’re seeing is not a breakout. Not yet.
This is a trap zone.
Discipline > Emotion.
Structure > Hope.
Profits > FOMO.
Welcome to day trading.
💬 Peanut butter Street Talk:
Presidents are out here launching meme coins. The insiders already made their billions — and they’re calling it “peanuts.”
But we don’t want to be their peanut butter.
That’s what happens when we become the exit liquidity.
They dump while we FOMO. They wait while we panic.
So don’t feed the trap. Keep your edge sharp, your charts tighter, and your emotions in check.
I prefer to buy over 115k, over resistance or lower at support.
Not today,
The FXPROFESSOR 💙
Disclosure: I am happy to be part of the Trade Nation's Influencer program and receive a monthly fee for using their TradingView charts in my analysis. Awesome broker, where the trader really comes first! 🌟🤝📈

Bitcoin can rebound up from support line of upward wedgeHello traders, I want share with you my opinion about Bitcoin. In this chart, we can see how the price dropped from the 102800 support level, which coincided with the buyer zone, and later entered to wedge upward. In this pattern, price made an impulse up from the support line of the wedge pattern and broke the 102800 support level, after making a retest, and continued to move up. Bitcoin rose to the current support level, which coincided with a support area and even entered this area, but soon turned around and fell below. Next, price rose to this area again and then made a correction movement, after which it turned around and made an impulse up to the resistance line of the wedge, breaking the 108000 level. After this movement, the price bounced from this line and fell back to the current support level, where it some time traded in the support area. Later price rebounded and continued to move up. Now, I expect that BTC can correct to support line of the wedge and then rise to the resistance line of this pattern. That's why I set my TP at the 112600 points, which coincided with this line. Please share this idea with your friends and click Boost 🚀
Disclaimer: As part of ThinkMarkets’ Influencer Program, I am sponsored to share and publish their charts in my analysis.

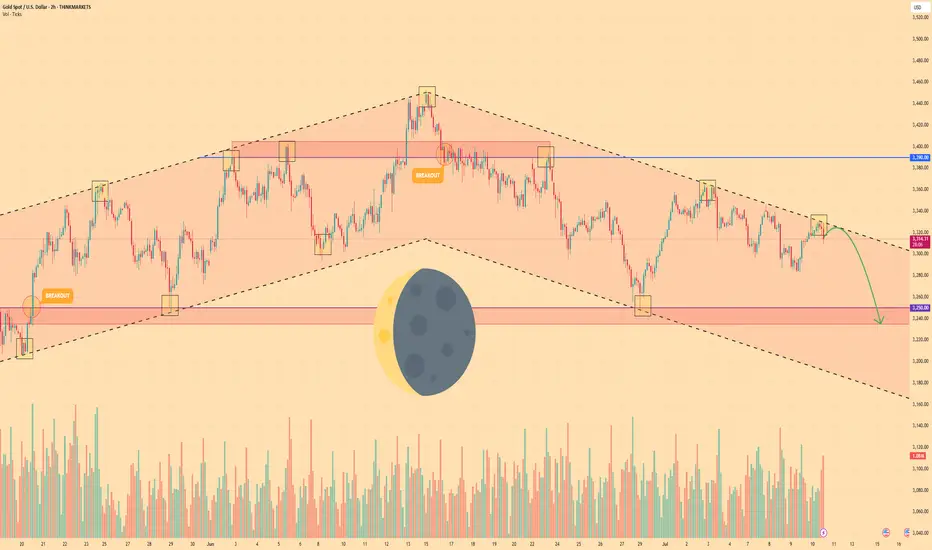
GOLD - Price can bounce down from resistance line of channelHi guys, this is my overview for XAUUSD, feel free to check it and write your feedback in comments👊
Gold broke out of its long-term rising channel and hit $3390 resistance level before momentum definitively stalled.
That failure marked a shift in control, as sellers forced price into a falling channel, establishing lower highs and lower lows.
Price fell to support level, after whcih it turned around and bounced up to resistance line of falling channel.
Now, Gold tests the upper boundary of the falling channel near $3318, where each bounce has been capped by declining volume.
Key support lies in the $3250 - $3235 area, aligned with multiple prior demand tests and the former rising-channel floor.
I expect Gold to reverse from the channel resistance and slide toward $3235, decisively breaking below the $3250 level.
If this post is useful to you, you can support me with like/boost and advice in comments❤️
Disclaimer: As part of ThinkMarkets’ Influencer Program, I am sponsored to share and publish their charts in my analysis.
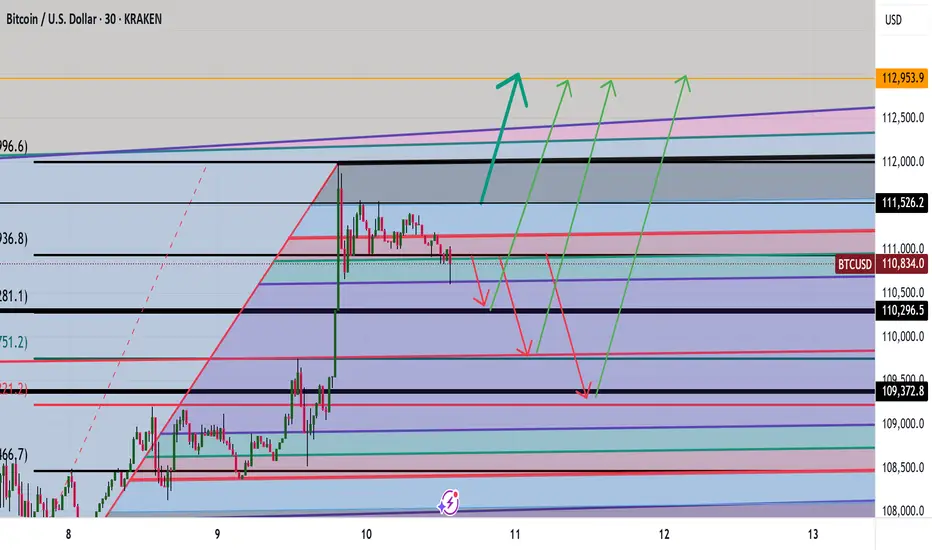
You Haven’t Missed It**⏰ Timeframe: 1H**
**🛠 Tools Used: Dow Theory, Support & Resistance, Volume, RSI**
**📈 Market Overview**
Bitcoin BINANCE:BTCUSDT is currently trading at **110,982**. After hitting a new all-time high at **12K**, the price is undergoing a mild correction. Despite the retracement, price remains supported by both volume and the 25-period moving average.
Yesterday, BTC broke through the **110,267** resistance level with a strong bullish candle, but encountered aggressive selling from market makers and is now consolidating with weak candles below the **12K** mark.
Typically, in such market phases, it’s advisable to close previous positions and consider new entries. However, given the likelihood of **interest rate cuts** and the fact that price is holding near its ATH, keeping previous **long positions** open may be wise, as a **strong upward move** is still on the table.
**⚙️ Technical Analysis**
Yesterday’s breakout above **110,267** was met with seller pressure near **12K**, leading to a shallow correction.
**BTC Dominance (BTC.D)** has broken above **65.04** and **64.69**, moving toward **64.51** resistance. However, a weakening candle structure is visible on both **4H and 1H** timeframes. This indicates that while long opportunities on bullish **BTC pairs** may still exist, we might see a lower high forming above **64.51** and below **64.69**, followed by another move back toward **64.51**.
Meanwhile, **USDT Dominance (USDT.D)** broke below the **4.75** support with a strong candle and is now ranging above **4.63**, suggesting a possible pause or rest phase here.
The **Total Market Cap** shows a similar pattern to **BTCUSDT**, reflecting consolidation with slight bullish bias.
The **Others** chart (excluding BTC & ETH) shows a healthy uptrend and is now facing resistance at **248.68**. A breakout above this level could pave the way for stronger performance among altcoins with bullish BTC pairs.
**🧭 Potential Scenarios**
📗 **Bullish Scenario:**
If BTC forms a **higher low above 110,654**, an entry could be considered above **12,000**, with a stop-loss placed below the higher low (based on the 1H timeframe). Volume confirmation is necessary to support the move.
📕 **Bearish Scenario:**
As long as the price remains **above 109,409**, **short positions are not recommended**.
**💡 Conclusion, Warnings & General Suggestion**
Bitcoin is currently in a **healthy bullish phase**.
The **key resistance at 111K** has been broken, and price is pulling back toward that level.
The structure remains bullish, supported by **sufficient volume** and **no clear bearish divergence**.
If current support holds, there’s potential for continuation toward the **113,500–114,000** range.
⚠️ **Warnings:**
* If the pullback turns into a breakdown (falling below **110,200**, then **109,000**), it would signal **buyer weakness**, and strategy must be reconsidered.
* Watch for **RSI divergences** or **declining volume** during further rallies—they may indicate caution.
* Prolonged consolidation **below broken resistance** could also indicate market weakness.

HelenP. I Bitcoin can continue to fall and break support levelHi folks today I'm prepared for you Bitcoin analytics. If we look at the chart, we can see that Bitcoin has been trading inside a well-defined upward channel. The price recently touched the upper boundary of this channel for the second time and formed a clear reaction, indicating strong resistance. After this, BTCUSD started to pull back from the resistance zone around 110300 - 109800 points. At the moment, it is trading slightly above this support area, but momentum is already shifting downward. Given this structure, I believe Bitcoin is likely to continue its decline and break below the support zone. The previous upward impulse has already lost steam, and there are no signs of strong buying activity around the current levels. The next logical target in this scenario is the lower boundary of the channel, near the 107500 level, where the trend line acts as dynamic support. This level has historically served as a rebound point, and I expect it to do so again. My current idea is short, aiming for a move down toward the trend line. If BTCUSD breaks through the first support and confirms the weakness, the price could fall quickly and test the next support area around 105600 - 105000 points. But for now, I will be watching the 107500 level closely. If you like my analytics you may support me with your like/comment ❤️
Disclaimer: As part of ThinkMarkets’ Influencer Program, I am sponsored to share and publish their charts in my analysis.

BITCOIN - SELL TO $86,000 (8H UPDATE)Bitcoin spiked up last night, but just about missed our 'Invalidation Zone' of $112,140 by a few pips. As long as this level can hold & sellers move back down, this sell analysis is still valid.
A lot of whipsaw price action in the markets right now, so use stick risk management.

BTC Analysis TO 112,981 LEVELS AND BEYOND ? Good morning folks
BTC analysis with a little correction down to 110,300- 109,300 levels then a drive up to 112-113K levels
Let me know what you think
Kris/Mindbloome Exchange
Trade Smarter Live Better
TradeCityPro | Bitcoin Daily Analysis #124👋 Welcome to TradeCity Pro!
Let’s dive into the analysis of Bitcoin and key crypto indicators. As usual, I’ll review the futures triggers for the New York session.
⏳ 1-Hour Timeframe
On the 1-hour timeframe, as you can see, Bitcoin made a bullish move yesterday after stabilizing above the 109391 level and managed to register a new ATH around the 112000 level.
⭐ The resistance at 111747 has effectively held back further price increases, and the price has reacted to it and entered a corrective phase.
✔️ I believe the correction could continue down to 110256. The next lower support levels are 109391 and 107853.
📈 If you already have a long position open, I recommend holding it. If the 111747 resistance breaks, a strong bullish trend could begin, and having an open position from earlier could have a big positive impact on your account.
🔼 If 111747 is broken, we can consider opening new long positions. If this level breaks, I’ll post a higher timeframe analysis to identify the next major resistance levels.
💥 RSI entering the Overbuy zone and rising volume would provide strong confirmation for this position.
👑 BTC.D Analysis
Bitcoin Dominance is still dropping. Yesterday, after breaking 64.81, it continued its downward move and is now approaching the 64.49 level.
🔍 If this level breaks, the drop could continue further, but in my opinion, after the recent drop, it's time for BTC.D to enter a correction phase.
📅 Total2 Analysis
Total2 has also had a bullish move, breaking through the 1.18 and 1.2 levels, and continues to rise.
🎲 The next resistance is at 1.24, which the price may target. However, I think there’s a high chance of a correction or consolidation phase starting soon.
📅 USDT.D Analysis
Looking at Tether Dominance, after the recent drop and the break of 4.72, it reached the 4.63 level and has formed a base there.
✨ If 4.63 breaks, USDT.D could head toward 4.56. In case of a pullback, the first level to watch is 4.72.
❌ Disclaimer ❌
Trading futures is highly risky and dangerous. If you're not an expert, these triggers may not be suitable for you. You should first learn risk and capital management. You can also use the educational content from this channel.
Finally, these triggers reflect my personal opinions on price action, and the market may move completely against this analysis. So, do your own research before opening any position.

Microstrategy: Renewed Upside MicroStrategy has continued to face downward pressure recently but is now showing more decisive signs of an upward move. We still see greater upside potential in the current magenta wave , though we expect the peak to form below resistance at $671.32. Afterward, the bearish wave should complete turquoise wave 2—while still holding above support at $153.49. Wave 3 should then usher in a longer upward phase, with momentum likely to ease only well above the $671.32 level. At the same time, there remains a 33% probability that the stock has already entered this upward phase. In that scenario, turquoise wave alt. 2 would already be complete, and the price would move directly above $671.32 as part of wave alt. 3.
📈 Over 190 precise analyses, clear entry points, and defined Target Zones - that's what we do.

ETH POTENTIAL BULLISH GARTLEY Seeing a potential bullish gartley forming on ETH if it is unable to break above the .886 of the AB wave. Targets would be $2004 to $1786 for the .786 or 1.618 of the BC leg

BTC: Demand Zone + QML + Trendline Flip = Perfect SETUPHello guys!
BTC is showing signs of a potential bullish reversal, forming a Quasimodo Level (QML) setup inside a valid S&D zone that remains unbroken despite multiple tests.
The downward trendline has been broken and is now acting as support, aligning perfectly with the QML and demand zone. giving us a solid confluence area.
Important to watch:
Rejection wicks and volume building at $106.6K–$107.4K zone show strong buyer interest.
If price can reclaim $109K and consolidate above, we could see a move toward $112K and higher.
Invalidation below $106.4K suggests the demand has failed, and bears may regain control.

BITCOIN BEARS WILL DOMINATE THE MARKET|SHORT
BITCOIN SIGNAL
Trade Direction: short
Entry Level: 111,047.38
Target Level: 109,294.85
Stop Loss: 112,211.89
RISK PROFILE
Risk level: medium
Suggested risk: 1%
Timeframe: 2h
Disclosure: I am part of Trade Nation's Influencer program and receive a monthly fee for using their TradingView charts in my analysis.
✅LIKE AND COMMENT MY IDEAS✅

BITCOIN facing the most important Roadblock of the Cycle.Bitcoin (BTCUSD) reached $112000 yesterday, testing the May 22 2025 All Time High (ATH) and immediately got rejected. This ATH rejection is key to the continuation of the bullish trend as the entirety of the ATH Resistance Zone is perhaps the last (and most important) Roadblock before the final rally of the Cycle that could potentially price the new Top.
You can see that this Resistance Zone already had 3 rejections previous on its bottom and yesterday was the first one on its top.
A break above it can target $118400 at least within days, in anticipation of a +10.20% Bullish Leg, similar to the one following the June 22 Low.
If the rejection prevails however, we may see a pull-back that will test the bottom of the (blue) Channel Up.
Which scenario do you think will prevail? Feel free to let us know in the comments section below!
-------------------------------------------------------------------------------
** Please LIKE 👍, FOLLOW ✅, SHARE 🙌 and COMMENT ✍ if you enjoy this idea! Also share your ideas and charts in the comments section below! This is best way to keep it relevant, support us, keep the content here free and allow the idea to reach as many people as possible. **
-------------------------------------------------------------------------------
💸💸💸💸💸💸
👇 👇 👇 👇 👇 👇

#BTCEUR #1D (Binance) Bull-flag breakout and retestBitcoin looks very good for bullish continuation after regaining 50MA support on daily, against the Euro.
⚡️⚡️ #BTC/EUR ⚡️⚡️
Exchanges: Binance
Signal Type: Regular (Long)
Amount: 12.0%
Entry Targets:
1) 93017.86
Take-Profit Targets:
1) 108422.28
Stop Targets:
1) 85296.36
Published By: @Zblaba
CRYPTOCAP:BTC BINANCE:BTCEUR #Bitcoin #PoW bitcoin.org
Risk/Reward= 1:2.0
Expected Profit= +16.6%
Possible Loss= -8.3%
Estimated Gaintime= 1-2 months

HolderStat┆BTCUSD fixed above the triangleBINANCE:BTCUSDT is rebounding from a consolidation base at $106,000 with strong bullish structure. The triangle breakout and recent higher lows point toward a move to $115,000–$120,000 if momentum continues.

Bitcoin to revisit $100k | Summer price target = $120kGeopolitical tension is causing fear in the markets. Today, Bitcoin fell from $107.7k to current price $105k with no sign of buyer support whatsoever, printing 11 consecutive H1 red candles intraday. Like a hot knife through butter.
At $105k, there is very little support. Sell volume absolutely overshadowed the tiny buy volume. Bulls have yet to close a green candle. I believe in the next few hours Bitcoin will be trading at $104k, followed by the first stop $102k.
$102k can serve as an entry point, depending on how price reacts. $100k is the optimal entry point for maximum profit, after mass liquidations. Retail traders are confident that the liquidity hunt is over after the initial tap, placing stops and liquidation levels at $100k.
Invalidation level will be beyond the 200SMA. The 200SMA have historically proven itself time and time again as a safe zone during rallies after golden crosses.

115.70K is the next one, 107K - RiskMorning folks,
Just to keep it short... our butterfly worked perfect, we've got our 111.65K target. Overall sentiment stands bullish. But - we do not want to see just stops grabbing around the top (aka Wash&Rinse). We want stable standing above broken daily trendline out of the flag consolidation .
So BTC has to stay above 107K lows to keep bullish context valid. That's why, if you plan to buy - you do not need to consider too far standing levels and lows for stop placement.
If, still, BTC drops under 107K, we suggest deeper retracement, under 100K level.
Conversely, if everything goes as we plan, next upside target is 115.70K.
So, if you plan to Buy: use local deeps on 1H chart and control 107K lows. This is your invalidation point.
If you want to sell: watch for clear signs of W&R of the top - engulfing patterns, spikes etc and following reversal patterns on 1h chart. Say, H&S, or any other.
For now I mark this setup as bullish.

$CLSK Resistance Ready to break?NASDAQ:CLSK is attempting to push above the resistance at $12.4 continuing the path from the recent analysis.
A breakthrough could push it rapidly to the High Volume Node resistance at $18.
Safe trading

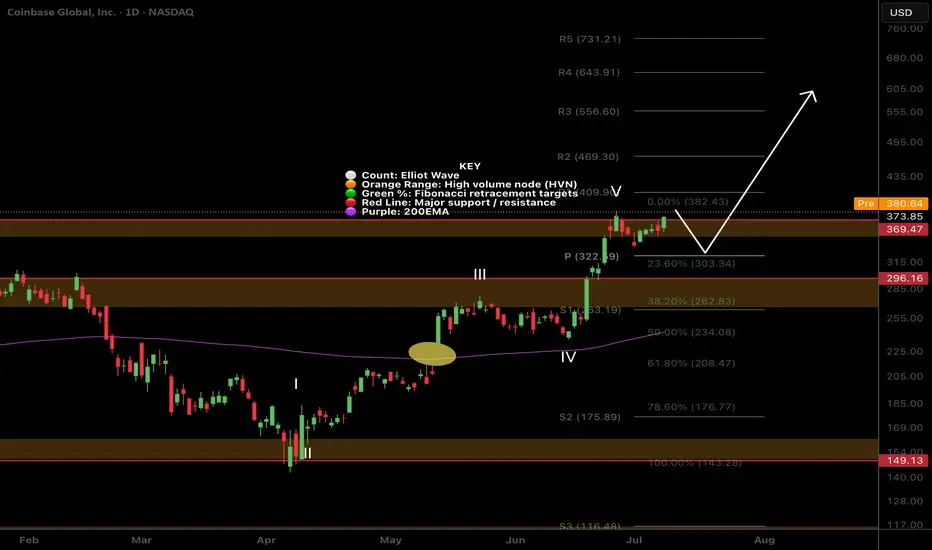
$COIN Price discovery?I was looking for a deeper pullback on NASDAQ:COIN but it appears to be heading into price discovery!
The pivot at $322 was my target but sentiment must be bullish if investors are impatient! Still... i wouldn't count out another sell off as a bear trap on a poke above the swing high.
Safe trading
$MARA at Resistance!NASDAQ:MARA continues its rally and has come into the High Volume Node resistance target and R2 daily pivot.
Daily 200EMA was tested as support after price smashed through. I expect continuation to the upside $24 target at the R5 daily pivot after some consolidation at this resistance.
Analysis is invalidated way below wave 2 at $13
Safe trading

BITCOIN Will Go Up From Support! Buy!
Take a look at our analysis for BITCOIN.
Time Frame: 2h
Current Trend: Bullish
Sentiment: Oversold (based on 7-period RSI)
Forecast: Bullish
The market is testing a major horizontal structure 108,796.02.
Taking into consideration the structure & trend analysis, I believe that the market will reach 110,156.53 level soon.
P.S
Please, note that an oversold/overbought condition can last for a long time, and therefore being oversold/overbought doesn't mean a price rally will come soon, or at all.
Disclosure: I am part of Trade Nation's Influencer program and receive a monthly fee for using their TradingView charts in my analysis.
Like and subscribe and comment my ideas if you enjoy them!

Bitcoin Is Looking For A Bullish ContinuationMorning all! Bitcoin has impulsive characteristics on 4h time frame, and we can clearly see five waves up that can send the price even higher after recent projected ABC correction. With the current impulsive recovery back above 106k area, it confirms that bulls are still here and we should be aware of further rally in July, especially if breaks above channel resistance line near 110k area. Seems like it's in wave (1) of a new five-wave bullish impulse, so after current wave (2) pullback, we can expect more gains within wave (3).
