What is Needed for BTC-Altcoins Bull Market —Crypto is Going Up!Some people are under the impression that Bitcoin needs to go down for the altcoins to go up. No, no, no, no, no... This is a big mistake. Bitcoin needs to continue growing for the altcoins to explode. Let me explain.
Bitcoin has been trading very high forever now and the altcoins grow when Bitcoin is very strong. The current situation with Bitcoin is good for the altcoins but the altcoins need a major force, a strong impulse and maximum support for a bull run and this only happens when Bitcoin goes up.
If Bitcoin retraces from resistance this is bad for the altcoins. Whatever gains tend to be removed right away. If Bitcoin moves forward and hits a new all-time high, this is incredibly beneficial for the altcoins and the altcoins continue growing for the long haul.
Instead of Bitcoin going down or falling behind for the altcoins to grow, Bitcoin needs to continue strong. A stronger Bitcoin is good for the altcoins. The more Bitcoin grows, the more pressure the altcoins market feels to follow.
As long as Bitcoin trades above $100,000, the altcoins can do great. If Bitcoin falters, the altcoins suffer but this is only short-term.
Regardless of what happens in the short-term, Cryptocurrency is set to grow. We will experience the best yet since 2021. This bull market will extend beyond 2025 and it will go into 2026 and who knows, maybe even beyond.
100% certainty, you can bet your house on it; Crypto is going up.
Namaste.
Bitcoin (Cryptocurrency)

#202526 - priceactiontds - weekly update - bitcoinGood Day and I hope you are well.
#btcusd - bitcoin
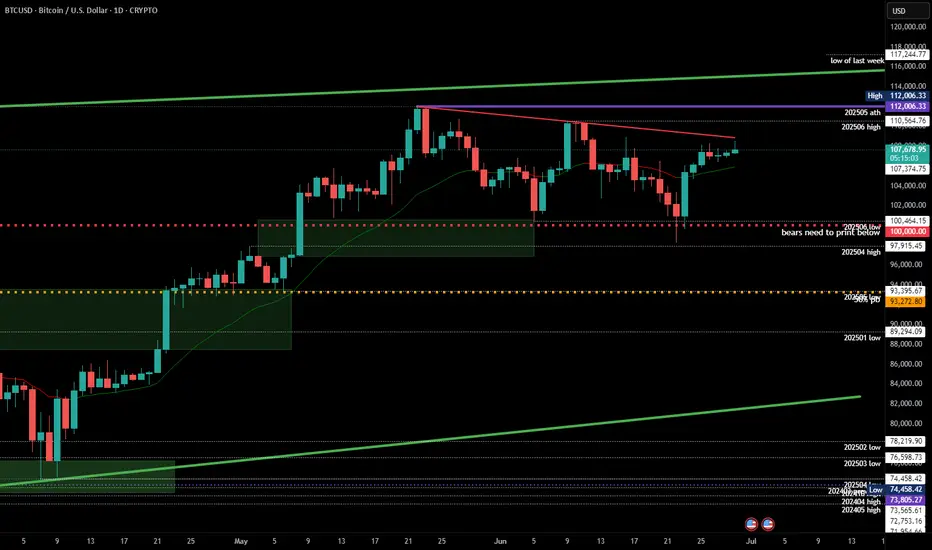
comment: Neutral since bears fumbled it again. Range is clear, don’t have much else to say about this. Bulls want 113k+ and bears need a strong daily close below 100k for more downside.
current market cycle: trading range
key levels: 100k - 115k
bull case: Bulls are still hopeful, that’s why we are still above 110k but the next touch could break it and I doubt many will hold long or scale into new ones there. Best bulls can get right now is to go sideways for longer and stay above 100k. I mean… Staying above 100k is as bullish as it get’s if you be honest. Same as last week since nothing has changed for the bulls. Trading range since mid May.
Invalidation is a strong daily close below 100k
bear case: Bears fumbled it again. Strong daily close below 100k or we won’t go lower. Right now odds favor the bears to go down from 107k to 100k but need more selling pressure.
Invalidation is above 110k
short term: As neutral as can be.
medium-long term - Update from 2025-06-29: Strong daily close below 100k will be the confirmation for more downside. First target below 100k is 97k the breakout retest and after that is the 50% retracement around 93k. I have no bullish for the next weeks/months. Once the gap to 97k closes we are likely in a bear trend again and I expect to hit at least 85k over the summer.
Example of how to draw a trend line using the StochRSI indicator
Hello, traders.
If you "Follow", you can always get new information quickly.
Have a nice day today.
-------------------------------------
We use the StochRSI indicator to draw a trend line.
We draw a trend line by connecting the peaks of the StochRSI indicator, i.e. the K line, when they are created in the overbought area or when they are created in the overbought area.
That is, when the K line of the StochRSI indicator forms a peak in the overbought area, the trend line is drawn by connecting the Open values of the falling candles.
If the candle corresponding to the peak of the StochRSI indicator is a rising candle, move to the right and use the Open value of the first falling candle.
When drawing the first trend line, draw it from the latest candle.
Since the third trend line indicates a new trend, do not draw anything after the third trend line.
The currently drawn trend line corresponds to the high-point trend line.
-
Therefore, you should also draw the low-point trend line.
The low-point trend line is drawn by connecting the K line of the StochRSI indicator when the top is formed in the oversold zone.
The low-point trend line uses the low value of the candle when the K line of the StochRSI indicator forms the top in the oversold zone.
That is, it doesn't matter whether the candle is a bearish candle or a bullish candle.
The drawing method is the same as when drawing the high-point trend line, drawing from the latest candle.
The top of the best K line of the StochRSI indicator was not formed within the oversold zone.
(The top is indicated by the section marked with a circle.)
Since the trend line was not formed, the principle is not to draw it.
If you want to draw it and see it, it is better to display it differently from the existing trend line so that it is intuitively different from the existing trend line.
-
The chart below is a chart that displays the trend line drawn separately above as a whole.
It is also good to distinguish which trend line it is by changing the color of the high-point trend line and the low-point trend line.
The chart below is a chart that distinguishes the high-point trend line in blue (#5b9cf6) and the low-point trend line in light green (#00ff00).
The low-point trend line is a line drawn when the trend has changed, so it does not have much meaning, but it still provides good information for calculating the volatility period.
-
To calculate the volatility period, support and resistance points drawn on the 1M, 1W, and 1D charts are required.
However, since I am currently explaining how to draw a trend line, it is only drawn on the 1M chart.
-
I use the indicators used in my chart to indicate support and resistance points.
That is, I use the DOM(60), DOM(-60), HA-Low, HA-High, and OBV indicators to indicate support and resistance points.
Since the DOM(-60) and HA-Low indicators are not displayed on the 1M chart, I have shown the 1W chart as an example.
The indicators displayed up to the current candle correspond to the main support and resistance points.
Although it is not displayed up to the current candle, the point where the horizontal line is long is drawn as the sub-support and resistance point.
It is recommended to mark them separately to distinguish the main support and resistance point and the sub-support and resistance point.
The trend line drawn in this way and the support and resistance points are correlated on the 1D chart and the volatility period is calculated.
(For example, it was drawn on the 1M chart.)
The sections marked as circles are the points that serve as the basis for calculating the volatility period.
That is,
- The point where multiple trend lines intersect
- The point where the trend line and the support and resistance points intersect
Select the point that satisfies the above cases at the same time to display the volatility period.
When the point of calculating the volatility period is ambiguous, move to the left and select the first candle.
This is because it is meaningless to display it after the volatility period has passed.
If possible, the more points that are satisfied at the same time, the stronger the volatility period.
If the K-line peak of the StochRSI indicator is formed outside the overbought or oversold zone, it is better to exclude it when calculating the volatility period.
-
The chart below is a chart drawn on a 1D chart by summarizing the above contents.
The reason why there are so many lines is because of this reason.
For those who are not familiar with my charts, I have been simplifying the charts as much as possible these days.
However, when explaining, I have shown all the indicators to help you understand the explanation.
-
Thank you for reading to the end.
I hope you have a successful trade.
--------------------------------------------------

Bitcoin Approaches PRZ – Will the Falling Wedge Break ?Bitcoin ( BINANCE:BTCUSDT ) failed to break through the Support zone($106,800-$105,820) after attacking it five times , and started to rise again.
Bitcoin is currently moving near the Resistance zone($109,220-$108,280) , Cumulative Short Liquidation Leverage($108,800-$108,085) , Potential Reversal Zone(PRZ) , and Resistance lines .
From a Classical Technical Analysis perspective , Bitcoin's movements over the past two days seem to have formed a Falling Wedge Pattern .
From an Elliott Wave theory perspective , Bitcoin appears to have completed the main wave 4 within the Falling Wedge Pattern. The structure of the main wave 4 was a Double Three Correction(WXY) .
I expect Bitcoin to attack the Resistance lines after breaking the upper line of the Falling Wedge Pattern . If Bitcoin fails to break the Resistance lines before the global markets close , we can expect Bitcoin to fall again. Because entering Saturday and Sunday , the trading volume is generally low , and I think Bitcoin needs a lot of volume to break the resistances .
Do you agree with me?
CME Gap: $106,645-$106,295
Cumulative Long Liquidation Leverage: $106,055-$105,430
Note: If Bitcoin manages to break the Support zone($106,800-$105,820), we should expect further declines.
Please respect each other's ideas and express them politely if you agree or disagree.
Bitcoin Analyze (BTCUSDT), 1-hour time frame.
Be sure to follow the updated ideas.
Do not forget to put a Stop loss for your positions (For every position you want to open).
Please follow your strategy and updates; this is just my Idea, and I will gladly see your ideas in this post.
Please do not forget the ✅' like '✅ button 🙏😊 & Share it with your friends; thanks, and Trade safe.

Do you think I'm joking ???Chart is speaking itself...AB=CD.
previous analysis
Give me some energy !!
✨We spend hours finding potential opportunities and writing useful ideas, we would be happy if you support us.
Best regards CobraVanguard.💚

This is a deception or maybe a technique !!!I think this head and shoulders pattern is trying to deceive us and is fake. I expect the price to drop to the support line and then rise to $109k. WAIT FOR IT....
Give me some energy !!
The Crypto Market Game: How to Win Against Fear and Manipulation
Did you really think profiting from the current bull run (a comprehensive upward market) would be easy? Don't be naive. Do you think they’ll let you buy low, hold, and sell high without any struggle? If it were that simple, everyone would be rich. But the truth is: 90% of you will lose. Why? Because the crypto market is not designed for everyone to win.
They will shake you. They will make you doubt everything. They will create panic, causing you to sell at the worst possible moment. Do you know what happens next? The best players in this game buy when there’s fear, not sell—because your panic gives them cheap assets.
This is how the game works: strong hands feed off weak hands. They exaggerate every dip, every correction, every sell-off. They make it look like the end of the world so you abandon everything. And when the market rises again, you’re left sitting there asking, “What just happened?”
This is not an accident. It’s a system. The market rewards patience and punishes weak emotions. The big players already know your thoughts. They know exactly when and how to stir fear, forcing you to give up. When you panic, they profit. They don’t just play the market—they play you. That’s why most people never succeed: they fall into the same traps over and over again.
People don’t realize that dips, FUD (fear, uncertainty, doubt), and panic are all part of the plan. But the winners? They block out the noise. They know that fear is temporary, but smart decisions last forever.
We’ve seen this play out hundreds of times. They pump the market after you sell. They take your assets, hold them, and sell them back to you at the top—leaving you with nothing, wondering how it happened.
Don’t play their game. Play your own.

BTC Is Replaying a Bullish Fractal >>> Are You Watching?Hello guys!
I see a deja vu here! Let’s look at the historical daily chart (Jan–May 2025):
What happened?
Initial Drop (Yellow Oval): Bitcoin approached a key S&D zone but didn't touch it, triggering a short-lived bounce before dropping again.
Second Drop (Red Ovals): This time, price precisely touched the demand zone, triggering a clean bullish reversal.
What followed was a strong trend breakout, sustained higher lows, and an eventual surge past prior resistance levels.
Current 4H Chart Setup: A Mirror Image?
Yellow Highlight: Once again, we saw a bounce that didn't quite touch the key demand zone ($98K–$100K).
Red Zone Prediction: If this mirrors the historical move, the price is likely to return and touch this S&D area before launching a bullish leg.
Blue Path Projection: A sharp reversal is expected post-touch, aiming toward $111K–$113K as the next key resistance zone.
The descending trendline adds confluence
___________________
History Doesn’t Repeat, But It Often Rhymes
Based on this fractal analysis, Bitcoin is likely forming the same bullish base seen earlier in 2025. The setup hinges on one key event: a return to the $99K–$100K zone, where demand is likely to step in aggressively.
If the pattern repeats, the current market may offer one last high-reward long opportunity before a parabolic rally.

BTCUSD – Major Decision Point at The Edge📍 By: MJTrading |||
Bitcoin has rallied sharply from ~$98K and is now testing a critical confluence zone — the top of the descending channel and a strong supply area, known as "The Edge."
EMAs are turning up, supporting bullish momentum
⏳ What’s Next?
At this stage, two scenarios emerge:
⚠️ This is a make-or-break zone:
🟩 Breakout above the channel signals trend reversal → next resistance: $111K
🟨 Rejection leads to a move back to the $103K or $100K levels
This setup offers a high-RR opportunity for both breakout traders and mean reversion players.
🧠 Trade the reaction at the edge, not the prediction.
Thanks for your attention...
Share your thoughts...
—
#BTCUSD #Bitcoin #CryptoTrading #TheEdge #BreakoutOrBounce #CryptoSetup #DescendingChannel #SmartMoney #TechnicalAnalysis #PriceAction #SwingTrade #EMA #RiskReward #MJTrading #4hChart #TrendDecision #SupplyZone

Bitcoin short position After my win streak from previous trades on btcusd I happy to give me to the people who followed me
Here's another great trade for you
Short Bitcoin with a limit order at 108,500
Take profit at 101k , stop loss at 109,500
A 7.5 to 1 risk reward ratio 🔥😉
You can never find anybody trade Bitcoin like me

Bitcoin Pressing Up But This Compression Could Crack LowerBitcoin has been steadily climbing for months, respecting that long-term trendline since last year. Each dip into it brought a strong bounce, showing bulls are still in control of the bigger picture.
But right now price is pressing into a tight descending resistance line. We can see it making lower highs while struggling to break above that red trendline. At the same time, it’s sitting just above a key horizontal range, where buyers stepped in before.
This compression is risky . If BTC fails to push above the descending resistance and breaks back below the box, it could drop toward the next demand zone around the low 100K region .
As long as the major trendline from last year holds, the broader uptrend is intact . But losing this structure would open the door for a deeper correction.
This is the kind of spot where patience pays. Let the breakout or breakdown show its hand before jumping in heavy.

Bitcoin - Weekend OutlookCRYPTOCAP:BTC | 6h
Bitcoin is compressing below its all-time high, with 108k as the local resistance that must be reclaimed for a bullish continuation to retest the highs.
I expect the price to clear some poor highs around 108.8k–109.6k before taking out the bad lows around 106.3k-105.4k
As long as we hold above 104k , I believe we’re in a strong position and expect we will retest the highs.
However, losing the 103k support level would be concerning.

StochRSI indicator and support and resistance levels
Hello, traders.
If you "follow" me, you can always get the latest information quickly.
Have a nice day today.
-------------------------------------
The StochRSI indicator on the left chart is slightly different from the StochRSI indicator on the right.
The StochRSI indicator on the left chart is the StochRSI indicator provided by default in TradingView, and the StochRSI indicator on the right chart is an indicator with a modified formula.
The StochRSI indicator is a leading indicator that is reflected almost in real time.
Therefore, it reacts sensitively to price changes.
Although it is advantageous because it reacts sensitively, it also increases the possibility of being caught in a fake, so I thought that a slight delay(?) was necessary, and so I created the StochRSI indicator on the left chart.
If you look at the relationship between the K and D of the StochRSI indicators on the two charts, you can see that there is a big difference.
In the end, you can predict the movement by checking whether the movement of the K line has escaped the overbought or oversold section.
However, I think that you will receive information that can determine the sustainability of the trend depending on the positional relationship between K and D.
Therefore, it is important to distinguish the inflection points that occur in the StochRSI indicator.
This is because these inflection points provide important information for drawing trend lines.
Therefore, the StochRSI indicator on the left chart, which better expresses the inflection point, is being used to draw the trend line.
(Unfortunately, this indicator was not registered on TradingView because I did not explain it well.)
-
As a new candle was created, the StochRSI indicator on the left chart is showing an inflection point on the K line.
The StochRSI indicator on the right chart is showing a transition to a state where K < D.
We will have to check whether the inflection point was created only when today's candle closes, but I think that the fact that it is showing this pattern means that there is a high possibility of a change in the future trend.
Since the next volatility period is expected to start around July 2nd (July 1st-3rd), I think it has started to show meaningful movements.
-
It is true that you want to buy at the lowest price possible and sell at the highest price.
However, because of this greed, one mistake can lead to a loss that can overturn nine victories, so you should always be careful.
Therefore, if possible, it is better to check for support and respond.
In that sense, I think it is worth referring to the relationship between K and D of the StochRSI indicator on the left chart.
This is because the actual downtrend is likely to start when K < D.
-
In order to check for support, you definitely need support and resistance points drawn on the 1M, 1W, and 1D charts.
Ignoring this and checking for support at the drawn support and resistance points can result in not being able to apply the chart you drew to actual trading.
Therefore, you should draw support and resistance points first before starting a trade.
Otherwise, if you draw support and resistance points after starting a trade, you are more likely to set support and resistance points that reflect your subjective thoughts, so as I mentioned earlier, you are more likely to lose faith in the chart you drew.
If this phenomenon continues, it will eventually lead to leaving the investment market.
-
It is important to determine whether there is support by checking the correlation between the StochRSI indicator and other indicators at the support and resistance points drawn on the 1M, 1W, and 1D charts.
Even if the inflection point of the StochRSI indicator or other indicators occurs at a point other than the support and resistance points you drew, you should consider it as something that occurred beyond your ability to handle.
In other words, you should observe the price movement but not actually trade.
As I mentioned earlier, if you start to violate this, you will become less and less able to trust the chart you drew.
-
Accordingly, the basic trading strategy I suggest is to buy near the HA-Low indicator and sell near the HA-High indicator.
However, since the HA-Low and HA-High indicators are expressed as average values, they may move in the opposite direction to the basic trading strategy.
In other words, if the HA-Low indicator is resisted and falls, there is a possibility of a stepwise downward trend, and if the HA-High indicator is supported and rises, there is a possibility of a stepwise upward trend.
Therefore, the basic trading strategy mentioned above can be considered a trading strategy in the box section.
In the case of deviating from this box section, it is highly likely to occur before and after the volatility period indicated by the relationship between the trend line using the StochRSI indicator mentioned above and the support and resistance points drawn on the 1M, 1W, and 1D charts.
Therefore, special care is required when conducting new transactions during the volatility period.
This is because there is a high possibility of being caught in a fake when trading during the volatility period.
-
The DOM(60) and DOM(-60) indicators are good indicators to look at together with the HA-Low and HA-High indicators.
The DOM indicator is an indicator that comprehensively evaluates the DMI, OBV, and MOMENTUM indicators.
Therefore, the DOM(60) indicator is likely to be at the end of the high point range, and the DOM(060) indicator is likely to be at the end of the low point range.
In the explanation of the HA-Low and HA-High indicators,
- I said that if the HA-Low indicator receives resistance and falls, there is a possibility that a stepwise downtrend will begin,
- and if the HA-High indicator receives support and rises, there is a possibility that a stepwise uptrend will begin.
In order for an actual stepwise downtrend to begin, the price must fall below DOM(-60), and in order for a stepwise uptrend to begin, it must rise above DOM(60).
In other words, the DOM(-60) ~ HA-Low section and the HA-High ~ DOM(60) section can be seen as support and resistance sections.
-
If these correlations start to appear, I think you will be able to create a trading strategy that fits your investment style without being swayed by price volatility and proceed with trading.
The reason for analyzing charts is to trade.
Therefore, the shorter the time for chart analysis, the better, and you should increase the start of creating a trading strategy.
-
Thank you for reading to the end.
I hope you have a successful trade.
--------------------------------------------------

BTC's Mid 2025 OutlookBitcoin is currently trading around $107,000 on the 4-hour 4H timeframe, navigating a consolidation phase following a sharp rally that culminated in a new all-time high of $111,900 in May 2025. Despite recent price corrections, BTC remains up 3% on the week, reflecting underlying bullish momentum. This sustained strength hints at continued confidence in the market, particularly among larger players.
A notable development supporting this view is the increase in the number of Bitcoin wallets holding at least 10 BTC, which has surged to a three-month high of 152,280. This metric is widely regarded as a proxy for whale activity and may indicate renewed institutional interest, especially amid accelerating inflows into spot Bitcoin ETFs.
On the 4H chart, Bitcoin appears to be consolidating within a tight range, hovering just beneath a key supply zone at $107,000, which could act as short-term resistance.
Several potential outcomes are currently in play:
Bullish scenario:
A breakout above the $107,000–$108,000 range could clear the path toward the critical resistance at $115,000. A successful move above this threshold would likely signal resumption of the broader uptrend, with some technical analysts eyeing a potential cup and handle formation that could project long-term targets up to \$180,000
Bearish scenario:
If BTC fails to hold above the current level, it may correct toward the first major support at $102,800, with further downside risk to $98,500. In a more pessimistic setup, price could extend losses toward $96,000, especially if macroeconomic or geopolitical pressures intensify
Key levels to watch:
Resistance: $107,000 - $115,000
Support: $102,800 - $98,500 - $96,000
Market Sentiment and External Drivers:
Bitcoin's price is being shaped not only by technical dynamics but also by powerful external forces
Spot Bitcoin ETFs:
The US regulatory greenlight for spot ETFs has dramatically altered market dynamics. With projections of $190 billion in assets under management AUM for these products by the end of 2025, institutional access to BTC has become more streamlined, providing strong tailwinds for long-term accumulation
Geopolitical risk and macro conditions:
Global uncertainty, particularly due to escalating tensions in the Middle East and potential US military involvement, has introduced volatility. At the same time, rising inflation and economic instability in developed markets is a double-edged sword, either undermining risk assets or conversely boosting Bitcoin’s narrative as digital gold and a hedge against fiat devaluation
Forward-Looking Outlook:
Bitcoin is at a critical juncture. The ability to sustain above $107,000 and reclaim the $115,000 resistance will be pivotal. A confirmed breakout could open the door to price discovery and possibly a surge toward $130,000 to $150,000, with $180,000 as an extended target in more bullish scenarios
However, a failure to hold key support levels could shift momentum toward the bears, prompting a deeper correction toward the $96,000 zone. Traders should monitor:
- Price reaction around $107,000 and $115,000
- ETF inflow data and AUM growth
- Macro news especially inflation reports and central bank commentary
- Developments in global conflict zones impacting risk appetite
Conclusion:
Bitcoin’s medium-term direction hinges on a delicate interplay of technical consolidation institutional flow and macro geopolitical signals. While the bullish structure remains intact for now a decisive move in either direction above $115,000 or below $98,000 could set the tone for the next major trend.

HelenP. I Bitcoin can drop from resistance levelHi folks today I'm prepared for you Bitcoin analytics. If we examine the chart, we can see that the price has approached a significant resistance zone between 108200 and 108800. This area previously acted as a ceiling for the price, and now coincides with the retest of the broken trend line from above. After a strong bullish push from the support zone near 103000, the price is currently consolidating just below resistance, which often signals hesitation and potential reversal pressure. Earlier, we observed a period of consolidation around the support zone, followed by a breakout that broke above the trend line. However, the current structure suggests that the breakout may have been temporary. With multiple signs of slowing momentum and price failing to break convincingly through the resistance, a bearish move from this level becomes increasingly likely. Given the context, I expect BTCUSD to reject this resistance and move downward toward the 103000 support level again. That is my current goal, as I anticipate the price to complete a corrective wave in line with the overall structure. If you like my analytics you may support me with your like/comment ❤️
Disclaimer: As part of ThinkMarkets’ Influencer Program, I am sponsored to share and publish their charts in my analysis.

Has Bitcoin Topped? Trump’s SBR Impact | Deep Dive Analysis🚨 Has COINBASE:BTCUSD topped? Even with Trump's Bitcoin Strategic Reserve? 🚨
In this deep dive, we analyze COINBASE:BTCUSD major factors that could point to a major reversal or breakout and to uncover whether a market top is forming.
We’ll cover:
Powerful Indicators
Bitcoin / BTC Trends
Price Action
EMA / SMA Trends
Volume Delta
Trend reversal / breakout
Bullish / Bearish / Confirmation from Indicators
order flow analysis
Timeframes (1W, 1D, 1m, 6M etc.)
Bullish and Bearish Sentiment
Strength Candles
👉 Like, comment below, and follow for more pro-level crypto insights.
MartyBoots here , I have been trading for 17 years and sharing my thoughts on COINBASE:BTCUSD .
Whether you're a short-term trader or long-term investor, this post provides the technical insight and edge to help you make better informed decisions.
📉 Stay ahead of the market. Watch the full breakdown and view charts to decide for yourself: Has Bitcoin really topped?
Watch video for more details and below I will show some powerful charts with descriptions.
Warning in near term - LARGE ORDERS
Consolidation in price with large orders above
The Red lines = LARGE ORDERS
Large orders can act as an magnet to price
Large orders can also be support and resistance
Price Above the white 100 moving average
Price strong above it
Price weak below it
Strength Candles
Still Bullish
Multiple timeframes still green
Sentiment Tool Still Bullish
Still Bullish
Multiple timeframes and settings still green
3 Drive Structure
Equal Measured moves
Implies Top Is Not In
Target = $126k
Bullish Engulfing Candle
Implies higher prices to come
👉 Like, comment below, and follow for more pro-level crypto insights.
#Bitcoin #Trump #BTC #CryptoTrading #TechnicalAnalysis #CryptoMarket #BitcoinTop #TradingView #StrategicBitcoinReserve

BTC - Will the Bears finally get their chance?Buy Side Liquidity Sweep in Progress
Price is currently climbing toward a region densely packed with resting buy side liquidity, marked by multiple previous highs. The area around 108,900 to 111,000 is especially significant, with two clear liquidity pools stacked above recent swing highs. These levels are likely to attract price as market participants seek to trigger stop orders and induce fresh buying interest—setting the stage for a potential reversal.
Weakness in the Current Impulse
The recent rally has advanced with minimal retracement and virtually no visible Gaps. This lack of corrective structure often indicates imbalance and suggests the move is overextended. When price moves upward too cleanly, it tends to leave behind thin liquidity zones, making the entire leg vulnerable to a sharper correction once exhaustion sets in.
Fair Value Gap as a Draw Below
Below current price lies a prominent bullish Fair Value Gap around 104,000. This inefficiency was left unfilled during the last leg up and may now serve as a magnet for price. These types of Gaps are often revisited by the market in an effort to rebalance supply and demand, especially after aggressive moves that break structure to the upside.
Once the higher liquidity levels are swept, watch for a clear reaction—either a strong rejection or lower timeframe structure shift—which could signal that the top is in. If that shift materializes, price may begin a downward leg targeting the unfilled Gap below. The magnitude of the move, combined with the lack of structure on the way up, leaves plenty of room for corrective action.
For those looking to engage, waiting for confirmation on a lower timeframe—such as a break of short-term bullish structure or the formation of a bearish Gap—can help time entries more precisely. In setups like these, patience is key: let the Sweep play out, observe how price reacts, and only then consider stepping in.

IRENs Incredible Surge Continue next wWeek?NASDAQ:IREN has been on a rampage since the April surging 175% and nearing all time high! A great couple of trades for us so far!
Price is likely to hit all time high next week with such a strong trend, where resistance and a pullback is a high probability.
The weekly pivot is $9.77, the most likely area for price to find support just above the 0.382 Fibonacci retracement (which will be dragged up to the weekly pivot once a new high is made).
Price discovery terminal target are the R3 & R5 weekly pivot points at $28 and $40.
Safe trading

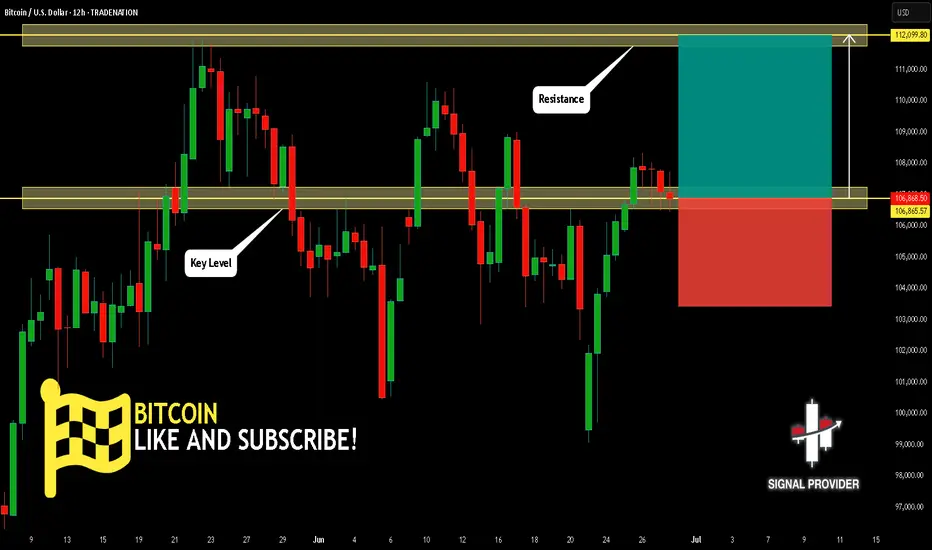
BITCOIN Is Bullish! Buy!
Here is our detailed technical review for BITCOIN.
Time Frame: 12h
Current Trend: Bullish
Sentiment: Oversold (based on 7-period RSI)
Forecast: Bullish
The market is approaching a significant support area 106,865.57.
The underlined horizontal cluster clearly indicates a highly probable bullish movement with target 112,099.80 level.
P.S
Overbought describes a period of time where there has been a significant and consistent upward move in price over a period of time without much pullback.
Disclosure: I am part of Trade Nation's Influencer program and receive a monthly fee for using their TradingView charts in my analysis.
Like and subscribe and comment my ideas if you enjoy them!
Bitcoin Bullish But... Support Zones (Incl. Altcoins)Bitcoin is bullish right now but we know things can change. As long as the action is happening within the blue and gray space, all is good, the bullish bias remains intact. If the action moves below the gray zone and enters the orange zone, this is the danger zone. This danger zone can turn into a buy opportunity or a wait and see approach.
On the other hand, if Bitcoin remains above the blue zone this is ultra-bullish short-term. This is specially bullish for the altcoins but it is bullish for Bitcoin as it reveals consolidation at high prices, but right now we have a lower high so anything goes.
The chart is mixed when looked at up-close. Bullish long-term and on all bigger timeframes. Corrections tend to develop from high prices.
One more thing to consider
When we look at the action short-term we can miss the bigger picture, we can become clouded with noise. The bigger range is $100,000 - $110,000, this is the new long-term support zone that is being established and created before additional growth. Bitcoin can remain here for weeks or even months, if this happens, the altcoins will continue to grow.
We are in a bull market. Bitcoin is obviously in a bull market as it is trading near its all-time high after years of growth. The altcoins are just getting started after years of sideways action... Some altcoins hit new all-time lows but still part of a broad, long-term consolidation phase. Many produced higher lows, some produced lower lows, it makes no difference.
The bear market ended in mid/late 2022 and the ensuing two years we had mix growth. Bullish waves and bearish waves, with the usual variations of course.
The year is now 2025 and Bitcoin is up, most of the big projects have been growing for years now and we are getting close to the final advance, the major fifth wave and the bull market bull run. When this happens, close to its end, all the smaller projects will produce the biggest growth in their history and this will be the boom that will catapult Crypto to take over the financial world.
It won't be the first time this event happens nor the last, the market will continue to fluctuate.
I know there is a lot of information out there and we can become uncertain with every drop, but look at the price; what do you see? Bitcoin is going up.
The altcoins are set to follow, the altcoins do what Bitcoin does.
Namaste.

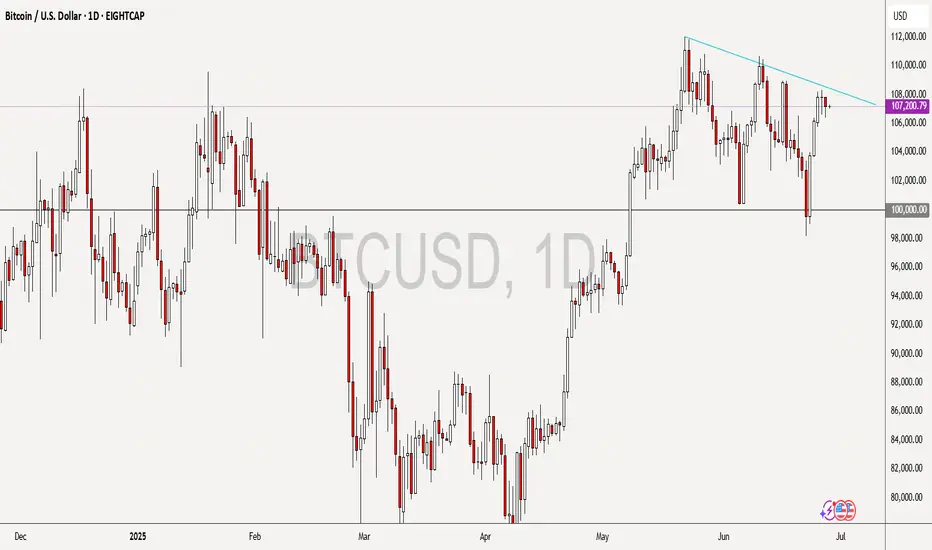
Bitcoin, The Next High Is The All-Time HighThe title might be a bit misleading but, the truth is that Bitcoin stays bullish short-term and this is bullish on all terms...
Good afternoon my fellow Cryptocurrency trader, how are you feeling today?
Any day, any week, any moment; every month, place or year, the market provides everything we need to know. This information is made available to us through the chart.
Bullish Bitcoin
The present signal is the fact that Bitcoin remains very high, challenging resistance, after a strong recovery and advance. This is happening with the altcoins also.
If you look at the last two peaks, as soon as resistance was hit there was an immediate crash. The next day was full red; very strong bearish action and momentum and this led to a new low. The situation is not the same today.
22-May peak. 23-May, strong bearish action.
9-June peak. 11-June, strong bearish action.
26-June lower high (not a peak). Today, neutral action. This neutral action is what I am taking as a bullish signal. Many other factors of course support this conclusion yet, this is still an early signal.
Fib support
A closer view of the daily timeframe:
4H. The grey line represents Fib. retracement. Dark blue—Fib. extension:
Conclusion
Each time there is a price peak a retrace follows, if there is no retrace then you are not witnessing a peak but rather a stop, a pause; resistance being met.
It seems that the current lower high is not the end but rather just a pause before additional growth. Market conditions can change.
It can happen that several days Bitcoin goes sideways with the bulls failing to garner enough strength. In this scenario, there would be a move lower before additional growth.
The present scenario shows a bullish chart even if prices drop, remember, the market is in no hurry.
Easy money
In September we will have lower interest rates and this is a bullish development for Bitcoin. Advanced money minds see easy money as inflationary for the currency, while Bitcoin is inflation-proof. So the dollar goes down and Bitcoin goes up.
I didn't quite develop this point, next time I'll do a better job.
Summary
The market is good even if it shakes. The market is good and isn't shaking, the recovery is already in place.
Bitcoin's price is very strong and there are many layers of support. The altcoins are in a similar situation, growing from the bottom up.
The Fed will reduce interest rates in September and then once more before the year ends, this is bullish for everything so, everything will be going up, at least everything that we are interested in, support and trade.
Thanks a lot for your continued support.
Never give up!
You are divine! You are blessed.
If you are reading this now, you will be blessed for your great timing. Hard work and dedication always pays.
Keep moving forward, keep pushing forward, never give up.
When life hits you hard, do take a break if you need it, only to comeback with new energy, a new mind and an infinite drive to achieve your goals.
You are the reason why Bitcoin exist... You are the lifeblood of the market.
Without you, nothing is possible. It is because of you that we all continue to grow.
Thanks again for taking the time to read.
I appreciate your support.
Namaste.

btcusd bitcoin entering bear market that will last 1 year to 20kBearish divergence on rsi and mcad indication of bear market that usually last year.
Bottom is approximately 20k were also unfilled CME gap still exists.

Sharing the advanced Bollinger Bands strategyHere are the Bollinger Band trading tips: *
📌 If you break above the upper band and then drop back down through it, confirm a short signal!
📌 If you drop below the lower band and then move back up through it, confirm a long signal!
📌 If you continue to drop below the middle band, add to your short position; if you break above the middle band, add to your long position!
Pretty straightforward, right? This means you won’t be waiting for the middle band to signal before acting; you’ll be ahead of the game, capturing market turning points!
Let’s break it down with some examples:
1. When Bitcoin breaks above the upper Bollinger Band, it looks strong, but quickly drops back below:
➡️ That’s a “bull trap”—time to go short!
2. If Bitcoin crashes below the lower band and then pops back up:
➡️ Bears are running out of steam—time to go long and grab that rebound!
3. If the price keeps moving above the middle band:
➡️ Add to your long or short positions to ride the trend without being greedy or hesitant.
Why is this method powerful?
It combines “edge recognition + trend confirmation” for double protection:
1. Edge Recognition—spot the turning point and act early.
2. Trend Confirmation—wait for the middle band breakout and then confidently add positions!
You won’t be reacting after the fact; you’ll be ahead of the curve, increasing your positions in the trend’s middle and locking in profits at the end. This is the rhythm of professional traders and the core logic of systematic profits!
Who is this method for?
- You want precise entry and exit points.
- You’re tired of “chasing highs and cutting losses.”
- You want a clear, executable trading system.
- You want to go from “I see the chart but don’t act” to “I see the signal and take action.”
Follow for more. Make sure to like this if you found it useful.

Unusual situation - Will you short BTCUSD?Going short is not the first thought when talking about BTCUSD, yet the 3 recent lower highs together with an "evening star" pattern are saying exactly that.
Will you take this offer?
What do you think?
Comment below, share your thoughts and analysis!!