107.6-107.8 and 109-110KMorning folks,
So, position taking stage is done, now let's take a look at targets. In general we have a sequence of a few targets, starting from 107.6-107.8, 109-110, 113 and 116K. But in current situation I would watch for only first two.
Daily overbought is around 114, so 116K target seems too far. 113K is possible, but with rather extended downside action last week, it seems as very optimistic. That's why, more or less base case seems around 109-110K, while the easiest target is 107.6-107.8K.
So, once the first target will be reached - think about partial profit booking, if you want to continue trading. Say, take off 30-40% and move stops to the breakeven on the rest.
Bitcoin (Cryptocurrency)

BitcoinEntry Point:
Entry Level: 106,300 USDT
Price is currently slightly below entry (106,254.67), so the trade setup is still valid and could trigger soon.
Stop-Loss (SL):
Stop Level: 104,250 USDT
Defined just below the lower FVG zone, indicating where invalidation would occur.
Take-Profit Targets (TP):
TP1: 109,000 USDT (near minor resistance)
TP2: 113,250 USDT (major target)
The Risk-to-Reward Ratio (RRR) looks favorable — possibly over 3:1, which is strong.
Shift stop to entry after reaching TP1

Bitcoin Short-Term, 1H Timeframe, Bullish ($115,482 Next Target)Bitcoin completed its retrace 13-June 01:00 AM with a higher low at $102,663. Price action and trading volume indicates that the bearish move is over. Bitcoin is trading above support in the form of 0.618 Fib. retracement.
Bitcoin is turning bullish moving above EMA34, EMA21, EMA13 and EMA8 all in this current active session.
Immediate support stands between $105,293 and $105,314.
Next support is $104,533 and main support $104,282 matching the 0.618 Fib. retracement level.
Next target easy hit is $106,625, followed by $107,559. The second being a mild resistance.
Bitcoin can easily continue higher short-term aiming next at $108,989 followed by the last high at $110,586. Depending on how this level is handle we can update the short-term view.
The 1H timeframe is bullish now based on price action, candlestick patterns, higher lows, moving averages and the oscillators.
Namaste.

Bitcoin 100K Support Intact, The Bulls Win!Lately we've seen many cries about volume. Where is the volume? There is no volume! Etc. I tend to agree. My excuse in favor of a bullish Bitcoin was to say that low volume as prices moved higher worked as a continuation signal, things change.
We are now looking at BTCUSDT on the Daily timeframe and what I can notice is trading volume being relatively high. The days with high bull (green-buy) volume, are sometimes two to three times higher than the days with bearish (red) volume. This signal seals the deals. The bulls win.
This is a chart drawing that I used in the past. We have the low 7-April low and a higher low 5-June. Very strong bullish action for two months straight; very little retrace, weak bearish action for several weeks, the bulls win again.
The consolidation zone, the accumulation range, is defined here with blue and green, we know the price to be $100,000 and $110,000, Bitcoin trades at the exact middle, above $105,000. Giving the bulls another win.
Yesterday the action produced a higher low compared to 5-June. Even with very bad geopolitical conditions, a surprise war, Bitcoin remains strong. If not even war can break 100K as support, this simply means that Bitcoin isn't going any lower, Bitcoin is going up.
The most revealing part is the fact that Bitcoin didn't even reach 100K. Not in 5-June, not yesterday. 5-June the low was hit at 100,386. Yesterday, the low was 102,656.
There is lots of demand, supply is limited.
People are buying the dip. Whales are buying, institutions are buying; the world wants Bitcoin. Price action says Bitcoin is going up.
We can extract supporting signals from the Altcoins, Ethereum, XRP and Dogecoin are good examples, all the big projects are strong now when we consider the fact they are trading above MA200 daily and weekly, and this confirms a bullish bias with long-term growth.
$150,000 is not the top, Bitcoin is likely to go higher by the end of the next bullish wave. We can consider prices such as $180,000 and $200,000. This is because nobody is selling. Since people are not willing to sell, prices are sure to increase. Many altcoins are now extremely bullish, small and big.
All market conditions are fully aligned, it is only a matter of time.
Patience is key. Prices will rise.
Namaste.

Bitcoin Consolidation: Easy, Walk Away.Bitcoin consolidation in progress. The easiest thing to do in these situations is avoid taking any trades until a new trend is established. Even smaller time frames will be harder to trade unless you are employing mean reversion strategies. At some point the market will choose which way it wants to go but trying to guess in advance is a coin flip. The broader trend is bullish but the 110K and 113K area is a tough resistance. If price struggles to break this area over the next few weeks, then a broader retrace may be more likely.
In this situation it pays to wait for specific levels to take any action at all. What type of action you take will depend on your risk tolerance and time frame. In my opinion, the higher probability scenarios will be a test of the 102K area supports, followed by reversal patterns. Even if they don't follow through to new highs, at least there will be some attempt to maintain the support since Bitcoin is still generally strong.
IF Bitcoin breaks the support (anything is possible) that will confirm the broader corrective scenario which can see price testing 95K at minimum. There is no way to know the certainty of this scenario, it is all about how price action unfolds and confirms.
This time of year is typical of lower volume, lower momentum and less follow through. Often it is better to just sit it out and wait until the season shows clear signs of improvement. Seasonal volume does not typically get back to consistently high momentum levels until November. This does not mean there will be no opportunities at all, it just means if there is going to be a time to purposely be more selective, the next couple of months would be that time.
Thank you for considering my analysis and perspective.

#202524 - priceactiontds - weekly update - bitcoinGood Day and I hope you are well.
comment: Last week I printed another potential two-legged correction where the C would print a new ath. Bulls were to weak to even retest 112k and 110k was all they got. Now I do think there are many more reasons that this will be the mother of all doubles tops than any arguments for the bulls exist, how they could print a new ath. Structure is decent and market has spent many days at the top trying to continuing the trend. Confirmation is a daily close below 100k.
current market cycle: Broad bull channel on the weekly tf. Market is about to re-test the ath and will likely transition into a trading range afterwards or we are already in one.
key levels: 100k - 115k
bull case: Bulls are still hopeful, that’s why we are still above 110k but the next touch could break it and I doubt many will hold long or scale into new ones there. Best bulls can get right now is to go sideways for longer and stay above 100k. I mean… Staying above 100k is as bullish as it get’s if you be honest.
Invalidation is a daily close below 100k
bear case: Can we also get a new bear trend from 110k? We would need 4-5 consecutive daily bear closes for that. Right now bears are only getting 4 but prices is not moving much during those 4 and the bars are overlapping too much. Bulls are still hopeful. Bears need to do more if they want lower prices again. As of now bulls are favored to continue inside the given range.
Invalidation is above 113k
short term: Bearish with stop 113k. Will scale into shorts and take some profits around 100k until we see a big breakout below.
medium-long term - Update from 2025-06-08:
medium-long term - Update from 2025-06-08: “Need to see a clear sign that bulls can not push it beyond 112k and once we turn again from closer to the ath, I will comment on bear targets for the next months.”
This was from last week and market provided this clear sign with the amazing double top but only a daily close below 100k is confirmation. First target below 100k is 97k the breakout retest and after that is the 50% retracement around 93000.

WULF TeraWulf Leader in Clean Crypto Mining & HPC InfrastructureIf you haven`t bought WULF before the rally:
Now TeraWulf WULF is emerging as a compelling growth story in the digital infrastructure and cryptocurrency mining sectors, distinguished by its commitment to zero-carbon energy and expanding high-performance computing (HPC) hosting capabilities. Despite near-term financial challenges, the company’s rapid capacity growth, strong cash position, and strategic initiatives position it well for substantial upside in 2025 and beyond.
1. Rapid Expansion of Mining Capacity and Hashrate Growth
TeraWulf energized Miner Building 5, increasing its total mining capacity to 245 MW and boosting its Bitcoin mining hashrate to 12.2 exahashes per second (EH/s), a 52.5% increase year-over-year.
This significant growth in self-mining capacity enhances revenue potential and operational scale, positioning TeraWulf among the more efficient and sizable clean-energy miners.
The company’s vertically integrated model, powered primarily by zero-carbon energy, aligns with increasing regulatory and investor demand for sustainable crypto mining.
2. Strategic Buildout of High-Performance Computing (HPC) Infrastructure
TeraWulf commenced the buildout of dedicated HPC data halls and remains on track to deliver 72.5 MW of gross HPC hosting infrastructure to Core42 in 2025.
The company is actively pursuing additional HPC customers, targeting 200–250 MW of operational HPC capacity by the end of 2026, which diversifies revenue streams beyond crypto mining.
HPC infrastructure is a high-growth segment driven by demand for AI, big data, and cloud computing, offering TeraWulf exposure to secular technology trends.
3. Strong Financial Position and Capital Allocation
As of March 31, 2025, TeraWulf held approximately $219.6 million in cash and bitcoin holdings, providing liquidity to fund expansion and weather market volatility.
The company has repurchased $33 million of common stock in 2025, signaling management’s confidence in the business and commitment to shareholder value.
While total outstanding debt is around $500 million, TeraWulf maintains a strong current ratio (~5.4), indicating solid short-term liquidity.
4. Industry-Leading Sustainability Profile
TeraWulf’s focus on zero-carbon energy for its mining operations differentiates it in an industry increasingly scrutinized for environmental impact.
This green positioning not only appeals to ESG-conscious investors but may also provide access to incentives, partnerships, and preferential contracts as governments and enterprises emphasize sustainability.
5. Revenue Growth Outlook and Market Opportunity
Despite a temporary revenue dip to $34.4 million in Q1 2025, the company is projected to deliver a 53% increase in revenue for the full year 2025, significantly outpacing industry averages.
The combination of expanding mining capacity and HPC hosting services positions TeraWulf to capitalize on the growing demand for digital infrastructure powered by clean energy.
6. Navigating Financial Challenges with Growth Focus
TeraWulf reported a GAAP net loss of $0.16 per share in Q1 2025, reflecting ongoing investments in capacity and infrastructure.
Operational cash flow remains positive and improving, with management focused on scaling efficiently and improving margins over time.

Tether Dominance matters!USDT #tether dominance is forming a bullish flag in lower time chart. If #usdtd manages to breakout, the next wave of correction will hit #bitcoin and #altcoins. If USDT.d loses %4.75 , that will be the invalidation.

BITCOIN - Price can fall a little and start to move upHi guys, this is my overview for BTCUSDT, feel free to check it and write your feedback in comments👊
Price entered to rising channel, where at once bounced from support line and rose a little, and then corrected.
Next, price continued to move up and soon reached $100500 level, after which broke it and rose to resistance line.
After this movement, BTC corrected and continued to grow in rising channel and later reached $110500 level.
Bitcoin exited from rising channel, made a fake breakout of resistance level, and started to trades inside flat.
In flat, price tried to grow but failed and fell to support level and then grew back again, after which started to decline.
Now, I expect that BTC can repeat as move before, it falls a little and then grows to $110500 resistance level.
If this post is useful to you, you can support me with like/boost and advice in comments❤️

Bitcoin Breaks 20-Jan 2025 Peak Price, New ATH Next (+Altcoins)Look at this, Bitcoin closed the day exactly above the 20-Jan 2025 high. This day Bitcoin peaked at $110,265, the all-time high before May; yesterday, 9-June 2025, Bitcoin peaked at $110,577.4 but closed at $110,270, five dollars higher. Is this a bearish or bullish signal? What to expect!
Good evening my fellow Cryptocurrency trader, I hope you are having a wonderful day.
This week starts with a bang, a big bang, with Bitcoin doing great. The question immediately arises and I will answer, Will Bitcoin continue growing? Or, will Bitcoin produce a retrace?
I can tell you with 100% certainty that Bitcoin will continue to grow. I can support this statement with data from the charts.
We have hundreds and hundreds of altcoins going bullish, strongly bullish, some coming out of a new all-time low. If Bitcoin was set to crash, these altcoins wouldn't be gaining in bullish momentum, they would be diving deep much lower in order to create new lows. But this isn't what is happening this week, last week and today, no! What we are seeing now is huge growth across the altcoins market and this confirms what Bitcoin will do next.
Needless to say, as Bitcoin trades near its all-time high this is extremely bullish.
If a new all-time high is hit but the action moves lower, say 10-15% lower and remains there, this is bearish and points to lower prices. If the action remains very close to resistance, as it is now, this is ultra-bullish. It is simple do you agree?
Because when there is an incoming drop many people in the know start to sell, so the action never stays at resistance there is always a strong rejection with high bearish volume.
On the other hand, when resistance is challenged and continues to be hit over and over, or the action stays very close, it simply means that people are buying, holding and ready for growth. Bitcoin will continue moving higher mark my words. It is very easy because this has been confirmed long ago.
The bottom was hit 7-April and we are now experiencing long-term growth. As Bitcoin continues to trade near its all-time high, the altcoins will blow up.
When Bitcoin grows 20-30%, some altcoins can grow 100-200%. When Bitcoin grows 50%, some altcoins can grow 300-500%. This is the 2025 bull market.
Thank you for reading.
Give me a boost if you trade and profits from the altcoins market.
Namaste.
P.S. Leave a comment with your favorite altcoins, I will consider the pair for a few full analysis.

BTC - FRACTAL!!!!I found a fractal, the price should rise to the range of 110888, and then there will be a sharp decline, a squeeze will form, with the price supposedly rising and crossing over, but in reality, the price will be pushed down sharply to a range below $90k. I have an idea related to this, I called it the dragon's wings pattern. At one point, I simply realized that the chart repeats what has already happened, and this is exactly what needs to be analyzed. I think the price will go exactly as I have drawn it. All the best and stay disciplined!

Solana - Your chance to be a millionaireThere is a 50/50 chance that we have topped...
The wave structure is very indicative of a completed impulse. However, i'm betting that we are just in a complex wave 4 and if this is the case, we should see a wave 5 taking out the high.
The risk to reward is pretty nice and playing spot will pay off.

Bitcoin Weekly: Bullish & Bearish ScenariosThis is the definitive analysis based on the weekly timeframe. Depending on how the weekly session closes the market trend will be defined. Bitcoin is both bearish and bullish. Let me explain.
» If Bitcoin can move and close weekly above $110,000, market conditions are considered bullish and we can expect higher prices.
» If Bitcoin moves and closes weekly below $100,000, market conditions are considered bearish and we can expect lower prices.
» Any trading between $100,000 and $110,000 can be considered consolidation. Since the main move is an advance starting 7-April, the consolidation has a bullish bias; makes sense?
It is a bullish bias but a bullish continuation is not confirmed. Bitcoin peaked the 19-May week, a new all-time high. Then it produced a lower high this week. This implies bearish potential and bearish pressure.
» If this week closes above last weeks high, around $107,000, we can say the bulls are gaining ground.
» If this week closes at the open or lower, say $105,000 or lower, then the bears are gaining the upper-hand a lower low becomes more likely.
It has not been decided, anything goes. Anything can happen because Bitcoin will not die, trading won't end if prices move below 100K. This would simply lead to a bounce and a recovery later down the road.
It also works in reverse, if Bitcoin moves higher, nothing happens, the market will continue to be and exist, it will continue to grow and evolve.
Right now we are mixed, this is a decision point. The action is determined by the price, depending on what prices we get we can know what comes next. Since the week is yet to close, we remain in doubt but the bearish bias has the upper-hand short-term.
Short-term bearish potential is strong based on the ath, triple-top and lower high.
Mid-term the market is in a bullish trend facing resistance. The wave from 7-April through present day.
Retraces and corrections are normal.
Long-term Bitcoin is bullish, because it has been growing since November 2022.
Thank you for reading.
👉 If you would like to see an update when the week closes hit boost!
Namaste.

Sell Bitcoin and buy Altcoins!🚨 Controversial Take Ahead – Packed With High-Value Insights 🚨
Let’s dive deep.
👨💻 A bit about me:
I’ve been riding the tech wave since the beginning:
Programmed video games in the 80s and 90s
Built VSTi plugins in the early 2000s
Started creating websites when Internet Explorer 1.0 launched
Sold 3D assets when Unity 2.5 (first PC version) dropped
Launched my own blockchain in 2016
Deployed smart contracts on TRON in 2018
I don’t follow trends—I predict them. My instincts are backed by decades of hands-on experience.
Now, here’s what I see coming:
⚠️ 1. Sell Your Bitcoins
Yes, Bitcoin is obsolete. It’s a technology—not a precious metal—and like all tech, it must evolve or die.
Ask yourself:
Do you use a Blackberry today?
Still flying in 1930s planes?
Gaming on an Atari or Commodore 64?
Surfing the web with Lycos or Altavista?
No? Then why are you betting on a 2009 technology?
Most people don’t even understand how Bitcoin works—ask around what SHA256 or RSA means.
Crypto is misunderstood, and that’s dangerous.
Back in 1998, I created the UPL library, which handled data compression & encryption using all major algorithms—Huffman, LZSS, DES, RSA, etc. I’m not just throwing words around—I’ve built this stuff.
Politicians and financial institutions (yes, even Saylor) are 15 years late to Bitcoin. They're missing the truth: BTC’s upgrades failed (Ordinals, Runes, etc). Its value holds due to FOMO from the uninformed, not innovation.
One day, your Bitcoins will be as worthless as mp3.com stock. That’s not opinion—that’s technological reality.
🪙 2. Buy Altcoins
Not every altcoin is a winner—but that’s where the real opportunity is.
Remember:
Nokia and Blackberry ruled before Samsung and Xiaomi.
The next Amazon, Google, or Nvidia already exists—and it's trading for pennies.
When people laugh at altcoins, that’s the time to buy low.
Altcoins like CRYPTOCAP:SOL , CRYPTOCAP:SUI , MIL:UNI could 100x… even 100,000x.
Bitcoin might double—and then crash.
Smart traders buy when everyone else is mocking.
🌍 3. Consequences of the BTC Collapse
This collapse will come at a turning point in global power.
Wall Street and U.S. states are heavily exposed to BTC. If it crashes, the Western financial system could implode—a dot-com-level disaster.
China, on the other hand, is stable, adaptive, and tech-forward.
Crypto without staking, DeFi, NFTs, GameFi, smart contracts? That’s not the future—that’s Bitcoin. Altcoins are the future.
Bookmark this post. Re-read it in 10 years.
You’ll remember I said it first: Innovation is unstoppable.
Enjoy the last Bitcoin pump. Then watch what comes next.
DYOR.
#CryptoRevolution #AltcoinSeason #BitcoinCollapse #Web3Future #BlockchainInnovation #SellBitcoin #BuyAltcoins #CryptoTruth #DeFi #GameFi #SmartContracts #CryptoShift #UnstoppableInnovation
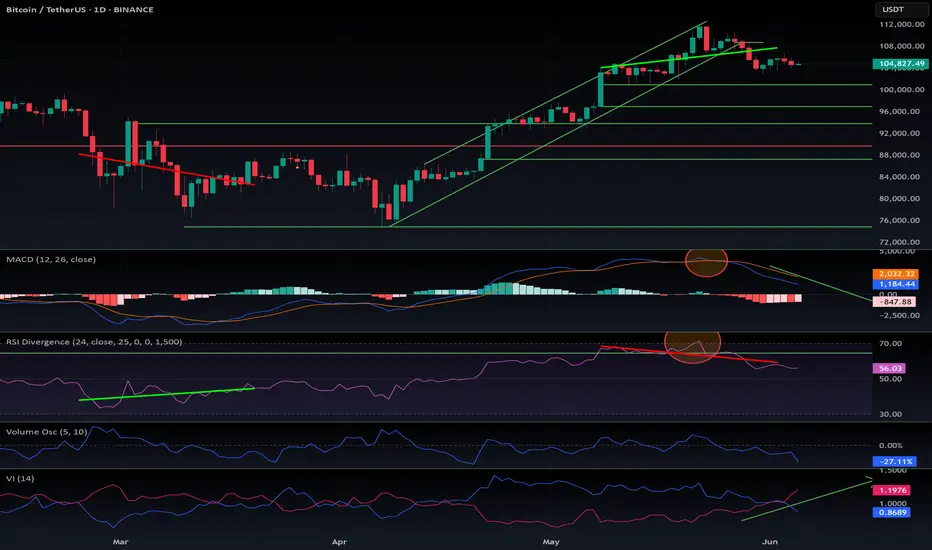
$BTC correction has just started. What is coming next?As I previously stated in my CRYPTOCAP:OTHERS , CRYPTOCAP:BTC.D , and CRYPTOCAP:TOTAL2 analysis — this move was expected. Check out my other ideas for more detailed breakdowns.
So, what’s happening?
Bitcoin maximalists have been buying heavily at the top, right when RSI and MACD were in overbought territory, creating a clear bearish divergence.
Something Saylor and others seem to ignore: you can't defy mathematics — what needs a correction will correct.
CRYPTOCAP:BTC still looks bullish on the weekly timeframe, so we’re not entering a bear market. However, the pump is over, key supports have broken, and altcoins are correcting — some by -25% in a single day.
Purely from a charting perspective, we can identify multiple potential support levels for CRYPTOCAP:BTC :
$101K, $94K, $89K, $87K, with a lower-probability retest down to $75K.
We’re likely entering a 2-week correction, after which CRYPTOCAP:BTC could resume its uptrend — potentially closing June at a new all-time high.
DYOR.
#Bitcoin #BTC #Altcoins #CryptoCrash #TechnicalAnalysis #BTCdominance #TOTAL2 #BearishDivergence #Saylor #RSI #MACD #ATH #DYOR

Bitcoin (BTCUSDT) - Price Consolidating Inside Sym. Triangle - DBITCOIN (BTCUSDT) price has recently bounced up from above the 50EMA (yellow line).
Since May 2025, price has been consolidating sideways and has now formed a symmetrical triangle (blue lines). 10% to 20% volatility could be incoming for Bitcoin this summer.
The key resistance prices that Bitcoin has yet to breakout above are: $110000, $112000, $115000, and $120000+.
Support prices are holding at this time, such as $105000, $104000, $102000, and $100000, $95000.
If price holds above $100,000 to $105,000, there is still a chance that Bitcoin can continue to uptrend and rally higher this year in 2025.
However, if $100,000 price and support levels are lost, a new downtrend could occur and price could possibly test the 200EMA zone (red line).

Bitcoin At Resistance: OMG! Not Another 20X SHORT!Sell at resistance; buy at support.
Good morning my fellow Cryptocurrency trader, I hope you are having a wonderful day.
Being able to adapt to changing market conditions is one of the signs of being a great trader. Being able to spot changes on a chart is also indicative of someone that can produce great results in this and other markets. How are you feeling today?
It is no secret, we let everyone know; We sell when prices are high, we buy a lot when prices are low.
Bitcoin is now trading below its 20-Jan 2025 peak price. And it is also producing a lower high. Both bearish signals that are pointing to a lower low.
If the first drop settled around 100K, the second one should settle in the low 90s or right below 90K. It can go lower of course but we go step by step. I am not saying GO SHORT 20X again. This would only be possible for people who are smart, experienced traders and those that can take advantage of a changing situation without breaking their portfolio or long-term plans. Those can definitely SHORT this setup and profit short-term.
A trader trades, it is what he/she does. You sell when prices are high if a drop is incoming, you buy when prices are low if a rise is next.
This is a friendly reminder and it carries great entry prices and timing. Follow the chart.
Trading volume is super low as Bitcoin trades near resistance and this is one of the biggest exchanges in the world. Low volume at this point reveals a pattern of distribution, distribution means lower of course.
Both the MACD & RSI move on the bullish zone but trending lower, bearish at this point.
What will it be: Will Bitcoin move down next? Will Bitcoin move up?
My money is on down.
Leave a comment if you agree.
Thanks a lot for your continued support.
Namaste.

The FVG above isn’t the target. It’s the bait.This is a classic Smart Money sequence. Most are watching the imbalance at 106.5k–108.7k and expecting immediate delivery. But that’s not how this game works.
The setup:
Price broke down violently, then reversed with momentum — stopping right beneath the daily FVG block. That alone tells me it’s not ready. It’s gathering.
Below? Multiple fib levels that haven’t been tested — 104.4k (0.236), 102.6k (0.0), and a volume-backed rejection wick that still holds weight.
The market is likely to dip again — pull into deeper discount, reset the low timeframe narrative — and only then attack the FVG and upper sweep zones.
What I expect:
Sweep of 102.6k (final liquidity run)
Reaction → reclaim 104.4k
Push into the FVG toward 106.5k (0.5) and possibly 107.4k (0.618)
No emotional reaction to the red candles — this is structure playing out, not weakness unfolding.
Plan:
Ideal Entry: 102.8k–103.2k range
SL: Below 102.6k
TP1: 105.6k
TP2: 107.4k
Final: 108.7k clean inefficiency fill
Let it dip. Let it breathe. That’s where conviction is built.
Final thought:
“The real move starts when they convince you it’s done.”

Bitcoin Prediction Update - BTC Crashed as expected! What’s nextBitcoin Crashed as Predicted! I am updating the current price action of CRYPTOCAP:BTC , and if we can reach our main target of $93K! Smash the Rocket Button if you did not completely hate this update! See you very soon again!


₿ Bitcoin: SlippedAfter holding steady for two days, Bitcoin broke lower yesterday, confirming a setback within green wave B. This countertrend move delays the anticipated climb, which we still expect to reach its peak in the upper blue Target Zone (coordinates: $117,553 – $130,891). From there, bearish wave C should take over. The upper blue zone remains a tactical area for partial profit-taking or hedging long positions with shorts. Wave C is expected to drive the price sharply lower into the blue Target Zone (coordinates: $62,395 – $51,323), where we anticipate the completion of orange wave a. Orange wave b may trigger a corrective bounce, but ultimately, renewed downside should wrap up the intermediate correction of blue wave (ii). Still, there’s a 30% chance that Bitcoin forms a higher high as part of blue wave alt.(i)—temporarily breaching the upper blue zone.
📈 Over 190 precise analyses, clear entry points, and defined Target Zones - that's what we do.

HelenP. I Bitcoin may continue to decline to trend lineHi folks today I'm prepared for you Bitcoin analytics. The chart began with a steady rising movement near the trend line, where the price consistently respected upward support and showed healthy momentum. After each test of the trend line, BTC managed to rebound strongly, confirming this level as dynamic support. One of the key reactions came when the price bounced from the 100300 zone, forming a solid base and continuing its bullish leg toward the resistance area. However, buyers lost momentum after breaking through intermediate support levels and reaching the resistance zone between 110700 and 111700. This resistance zone acted as a ceiling, halting further upside and triggering a local reversal. Since then, the price has been gradually retreating, printing lower highs and showing early signs of weakness. Currently, BTCUSDT is retracing, and the structure suggests that the market is leaning toward another test of the trend line. Given the previous reactions and technical setup, I expect the price to pull back toward the 102500 points, which aligns closely with the trend line. That’s why my current goal is set at this zone. If you like my analytics you may support me with your like/comment ❤️

TradeCityPro | Bitcoin Daily Analysis #116👋 Welcome to TradeCity Pro!
Let’s dive into the analysis of Bitcoin and the key crypto indices. As usual, I’m going to review the futures triggers for the New York session.
✅ Yesterday, a very important event occurred: Israel launched a military attack on Iran, targeting not only military facilities but also residential areas.
⚔️ Leaving aside the fact that war is always a global tragedy, the fact that Israel also hit civilian zones shows that the tensions between these two countries have entered a new phase.
💫 In addition to civilian casualties, key commanders of the Iranian military were assassinated in these strikes.
🏳️ Most countries such as the United States, France, and most of Europe supported Israel in this conflict, while only North Korea and Russia backed Iran.
📊 Given these rising tensions and the cancellation of Sunday’s negotiations between Iran and the U.S., the likelihood of war between Iran and Israel has greatly increased following the resolution signed yesterday.
⭐ This development has caused safe-haven assets like gold to move upward, while risk-on assets like crypto have started to decline. As you can see, Bitcoin has been falling since yesterday.
⏳ 1-Hour Timeframe
On the 1-hour chart, as mentioned, after an initial correction to the 108436 zone, Bitcoin continued its decline down to 103606, breaking through the support level we had marked due to the war-related news.
✨ Currently, the price has found support at 103606 and has started a corrective phase. RSI has also exited the Oversold area and is now heading toward the 50 zone.
📉 In my opinion, under the current market conditions, we should wait to see how Iran reacts to Israel's actions. If war breaks out, Bitcoin is likely to drop again.
⚡️ Personally, I’m holding off on opening any positions until we get more clarity on the fundamental developments between Iran and Israel. I'm also not closing any of my longer-term positions that were opened in lower zones like 88k.
🔔 However, if you are looking to open a position, you could enter on a break below 103606. I don’t currently have a trigger for a long position and would prefer to wait for a proper structure to develop.
👑 BTC.D Analysis
Bitcoin dominance moved upward along with the market decline and, after breaking through 64.18, continued its bullish leg up to 64.85.
🧩 It has since begun a corrective phase after hitting that resistance. If this correction continues, the next zone to watch is 64.49.
📅 Total2 Analysis
This index also dropped alongside Bitcoin yesterday, falling from 1.18 down to 1.12 after triggering a short.
🔍 The price has since corrected up to 1.14. If a new bearish leg begins, we can open a short position on a break below 1.12.
📅 USDT.D Analysis
Tether dominance moved upward after triggering 4.68 and reached 4.89.
💥 If 4.79 is broken, the correction could continue. If 4.89 is broken, the next bullish leg in dominance will begin.
❌ Disclaimer ❌
Trading futures is highly risky and dangerous. If you're not an expert, these triggers may not be suitable for you. You should first learn risk and capital management. You can also use the educational content from this channel.
Finally, these triggers reflect my personal opinions on price action, and the market may move completely against this analysis. So, do your own research before opening any position.
