Current bullish movement there are still significant resistanceGold Market Update
In the short term, the gold market has entered an uptrend. This upward movement has been supported by a Market Structure Shift (MSS) followed by a Break of Structure (BOS), indicating a bullish momentum and a potential reversal or continuation of the trend to the upside.
However, despite the current bullish movement, there are still significant technical resistances that need to be considered before assuming a sustained rally. At the moment, gold is approaching a trendline resistance, which has historically acted as a barrier, limiting further upward price movement. In addition to this, there is also the presence of a bearish Fair Value Gap (FVG) in the same region, adding to the confluence of potential resistance zones.
If the price is able to break above both the trendline resistance and the bearish FVG, it would confirm the strength of the bullish trend, and we could expect the market to continue climbing higher, potentially testing even stronger resistance levels above.
On the other hand, if the market fails to break through this key resistance area and gets rejected, we may witness a retracement or a corrective move. In such a case, gold could decline back down toward the lower marked trendline, which would then act as the next significant support level.
In conclusion, the immediate price action around this resistance zone will be crucial in determining the next direction for gold. Traders and investors should watch closely for confirmation of either a breakout or a rejection before making any decisive moves.
Bitcoin (Cryptocurrency)

ETH BULLISH SETUPEthereum has recently broken out bullishly on higher timeframes, signaling a potential move toward the key resistance zone around $3,460. This level holds significant technical importance. The breakout above the hourly flag pattern confirms bullish momentum. As long as price holds above $2,300, the setup remains valid. A drop below this level would invalidate the current bullish outlook.

Is Bitcoin Ready to Launch? In-Depth Analysis of BTC, ETH, XRP, Hello everyone, I hope you're doing well.
Due to time constraints, I won't be analyzing each asset individually. Instead, I’ll provide a collective technical overview in this post.
This analysis includes the following cryptocurrencies: **Bitcoin, Ethereum, Ripple, Solana, Sui, and Chainlink**.
⚠️ **Please note:** On the **daily timeframe**, most of these assets are forming different patterns. However, the **weekly timeframe** provides a clearer and more reliable outlook.
---
### 🔍 **Technical Overview:**
📌 **Bitcoin (BTC)**
Currently forming a **"V" pattern**.
If BTC closes **above \$110,500 on the weekly timeframe**, the first target is **\$131,500**, and the second target is **\$165,000**.
📌 **Ethereum (ETH)**
Also in a **"V" pattern**.
If ETH closes **above \$2,833 on the weekly timeframe**, the first target is **\$4,200**.
📌 **Ripple (XRP)**
Forming a **bullish flag** pattern.
If XRP closes **above \$2.65 on the weekly timeframe**, the first target is **\$4.22**.
📌 **Solana (SOL)**
Forming a **"V" pattern**.
If SOL closes **above \$190 weekly**, the first target is **\$282**.
📌 **Sui (SUI)**
Also forming a **"V" pattern**.
If SUI closes **above \$4.26 weekly**, the first target is **\$6.97**.
📌 **Chainlink (LINK)**
Needs a **weekly close above \$18** to confirm breakout.
First target: **\$25**.
---
### 🧠 **Brief Fundamental Insights:**
* **Bitcoin** is being heavily accumulated by institutional investors and whales. On-chain metrics suggest we are **not at a cycle top**, and the ongoing **supply shock** and **massive exchange outflows** are strong bullish signs.
* **Ethereum** is under **strong accumulation** from both retail and institutional investors, as confirmed by recent **CoinShares reports**.
* **Ripple** is awaiting resolution of its ongoing lawsuit with the **SEC**.
* **Sui** is consistently rolling out updates and shows **unstoppable DeFi ecosystem growth**, giving it strong fundamental support.
* **Solana** is being accumulated by institutional players, including **SOL-specific strategies** and funds.
* **Chainlink** is seeing buying pressure supported by **positive news and strategic partnerships**, some of which are from **anonymous large players**.
---
🧠 Updated Fundamental Analysis (June 2025)
Bitcoin (BTC)
New Investment Record: In May, total investments in crypto funds reached $167 billion, with Bitcoin accounting for $5.5 billion, signaling strong institutional demand.
Institutional Buying Surge: ETF purchases, entries by institutions like Paris Saint Germain, and even countries like Pakistan have contributed to declining exchange reserves of Bitcoin.
Favorable Macro Conditions: Rising bond yields, stock market volatility, and a weakening U.S. dollar have made Bitcoin more attractive as a hedge asset.
Ethereum (ETH)
Consistent Inflows: Ethereum funds have seen seven consecutive weeks of capital inflows, with nearly $296 million added in the past week alone.
Institutional Confidence: Assets under management (AUM) in ETH funds have reached approximately $14 billion, indicating strong long-term faith by institutions.
Solana (SOL)
Strong Institutional Demand: Firms like Société Générale and Siebert Financial have recently invested in Solana.
On the Verge of ETF Approval: Franklin Templeton filed for a spot Solana ETF back in February, potentially boosting demand.
Whale & DeFi Growth: Increased whale activity, growing DeFi ecosystem, and rising developer engagement hint at a potential price rally to $200 and beyond.
Ripple (XRP)
While there is no major new fundamental data recently, the listing of XRP futures on CME and broader access for institutional investors may have a positive impact.
The ongoing legal case with the SEC remains a crucial factor in XRP’s future outlook.
Sui (SUI)
DeFi Expansion: Active daily users have grown by over 14%, and decentralized exchange volume has reached around $34 million per day.
TVL Growth: Suilend’s Total Value Locked (TVL) has hit $700 million, ranking 8th among all blockchains.
Institutional Attention: There are reports suggesting that an ETF for SUI may be under consideration, with on-chain utility continuing to expand.
Chainlink (LINK)
Collaboration with Major Financial Institutions: Chainlink is participating in CBDC pilots between Hong Kong and Australia, working with Visa, ANZ, and the Hong Kong Monetary Authority.
Ecosystem Growth: Development is supported via grants, like the $150K funding provided to Lightchain AI, strengthening Chainlink’s infrastructure.
Strategic Partnerships: Collaborations with JPMorgan, Ondo Finance, and Swift highlight Chainlink’s growing influence in connecting real-world data to blockchains.

The 23 Years Long Cryptocurrency Bull Market CycleWe are looking at Crypto Total Market Cap. Index (TOTAL).
The weekly session trades at the highest level based on candle body since January 2025. The recovery has been swift. It started in April and after three green weeks there was a red week. Then three more green weeks followed by two red weeks. And now we are green again.
If the same pattern repeats, we get three green weeks or more followed by another retrace small in size. The main target for this already big bullish wave stands at 4.61T. This is a very strong bullish period already as it started in early April, it has been going for more than two months.
The market tends to grow and become more and more bullish, that is, bullish momentum starts to grow. When the action is really heating up doubt starts to creep in. Will it really continue higher? Is there a crash just around the corner? The crash happened last week.
If you notice last week's candle, it has a long lower shadow and a very small real body. It is a classic reversal signal. This week being full green confirms this reversal but the week is early.
TOTAL is the entire Cryptocurrency market, then we have individual charts. When we look at some altcoins in isolation, we know the top is far from being in, we know this only too well. Let's look at some examples. Ethereum, far from the top. Litecoin, very far. Dogecoin, Cardano, XRP, etc, etc, etc.
Bitcoin is now a completely different domain and is basically trading at a new all-time high. If this was the case while all the altcoins are also at new ath this would be worrisome, but the truth is that Bitcoin now has institutional demand and that's why it is so strong. There is no point in selling because whales are buying and will continue to buy, money is endless of course and money is becoming cheaper and cheaper all around the world. It is also coming to country near you but it is already happening. Remember, the cycle goes up and then down when it comes to interest rates. It already hit the top, peaked and now it is going the other way. This to say that there is room for so much growth.
Things tend to repeat, cycles tend to repeat until they don't. Literally, you can have a pattern where you do the same daily, weekly, monthly, for years until some time when you stop, it works like this with Crypto and other areas of the world. Bitcoin can produce a certain cycle and a certain pattern for 15 years straight, and then, all of a sudden things change. Not out of nowhere of course, we are seeing the world changing right in front of our eyes. Technology?
Where was the world 80 years ago?
How much change we saw between 1980 and 2010?
How about 2021 and the pandemic? You see, it continues to change.
Now it is money. You can have centuries of the same financial system, the same monopoly, all the same. Then you have credit cards and virtual bank accounts and now it is code, Crypto; nothing new, it is the same old, the only thing permanent is change and the world continues to change.
So Bitcoin can have big drawdowns just a few years ago, and in the present, these become smaller and smaller, the same happened with the stock market and the biggest stocks. It keeps on changing.
It goes from highly volatile, unpredictable and unstable to stability and growth long-term. Humanity is on a rising trend and this will always be reflected across all areas of life, finance, health, education, freedom, prosperity, liberty and the rest.
We are going up. Forever and then some more.
It is great to be alive in this world.
Namaste.

Do technical signals show Bitcoin’s path to $130K? Do technical signals show Bitcoin’s path to $130K?
Bitcoin briefly pushed above $110,000 for the second time this month, before pulling back slightly to trade around $109,500. The market consolidating just below the 61.8% Fibonacci extension level could be suggesting strong resistance is being tested near current levels.
Bitcoin remains within reach of its all-time high at $111,965, set on May 22.
The latest upward move may have been supported by comments from U.S. Commerce Secretary Howard Lutnick, who said trade talks with China in London were progressing well and likely to extend for a third day.
CNBC analyst Todd Gordon expects a breakout toward $130,000 according to his weekly chart analysis. According to our chart, A breakout above 111,897 could open the path to the 78.6% extension around $122,093, followed by the 100% extension target at $135,081

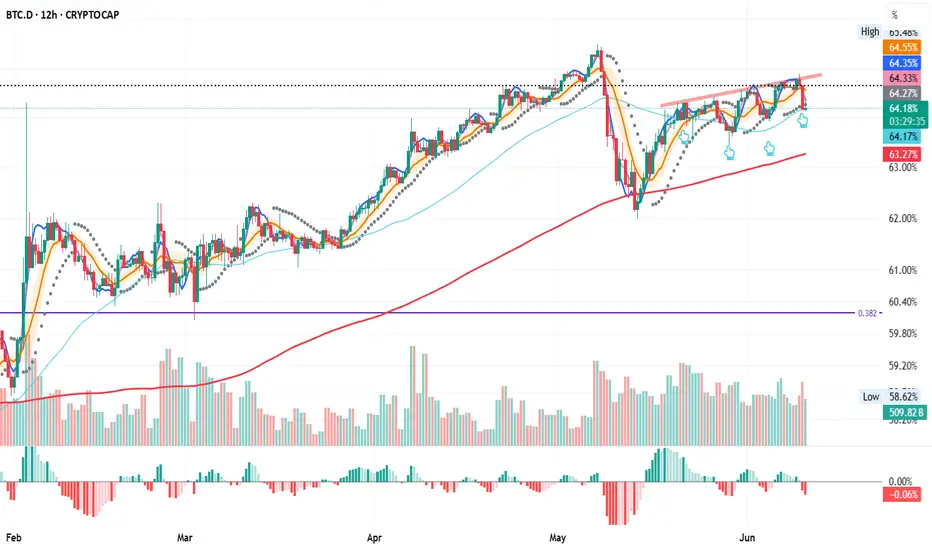
BTC.D – Repeat or Reset?
BTC.D (Bitcoin dominance) on the 12H chart is now testing the 50MA for the fourth time.
The last three touches led to a bounce toward the triple top trendline.
Will it play out the same way again, or will the 200MA need to step in as support?
Let’s watch it unfold together.
BTC buy now !!!So if you pay attention to the btc chart you can see that the price has formed a Ascending FLAG or wedge which means it is expected to price move as equal as the measured price movement.( AB=CD )
NOTE: wait for break of the FLAG .
Give me some energy !!
✨We spend hours finding potential opportunities and writing useful ideas, we would be happy if you support us.
Best regards CobraVanguard.💚
_ _ _ _ __ _ _ _ _ _ _ _ _ _ _ _ _ _ _ _ _ _ _ _ _ _ _ _ _ _ _ _
✅Thank you, and for more ideas, hit ❤️Like❤️ and 🌟Follow🌟!
⚠️Things can change...
The markets are always changing and even with all these signals, the market changes tend to be strong and fast!!

BTCUSD: Very aggressive rally to 130k has just started.Bitcoin turned bullish again on its 1D technical outlook (RSI = 61.233, MACD = 1503.700, ADX = 19.938) following yesterday's strong 1D candle, which is a result of the June 6th 1D MA50 rebound, and is even close to turning the day positive despite the correction early on. This rise is similar to the one that started after the April 7th rebound and eventually pearked just under the 2.382 Fibonacci extension. We remain bullish on Bitcoin, TP = 130,000.
## If you like our free content follow our profile to get more daily ideas. ##
## Comments and likes are greatly appreciated. ##

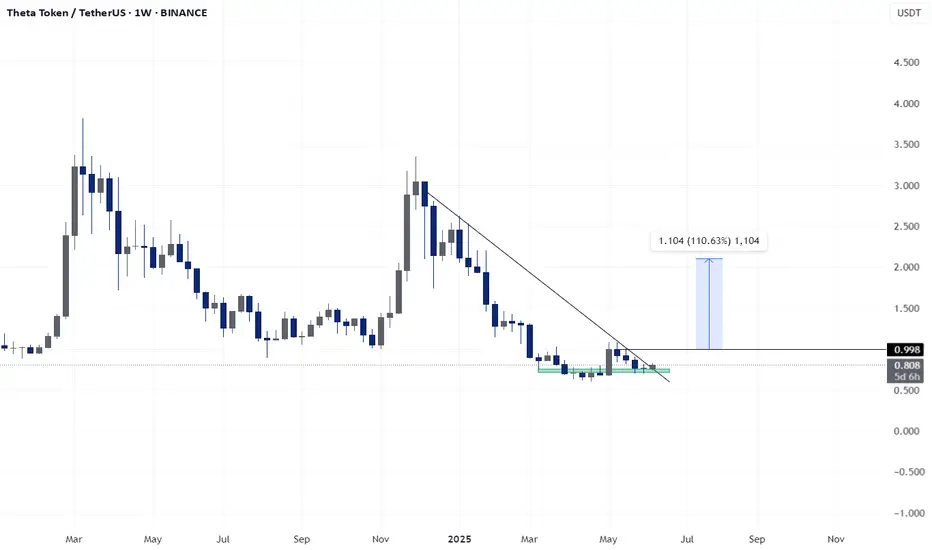
THETA - LONG SET-UPBINANCE:THETAUSDT
4️⃣ 𝐓𝐇𝐄𝐓𝐀/𝐔𝐒𝐃𝐓
Theta is holding a solid double bottom and pressing against trendline resistance. A breakout could open doors to a 110% rally toward $1.92. Chart looks ready to turn...
₿ Bitcoin: Push to the Upside! Bitcoin has made a significant push to the upside, which brought it closer to the upper blue Target Zone between $117,553 and $130,891, where we primarily expect the corrective rise of green wave B to conclude. We consider this price range an opportunity to take partial profits or to open short hedges for tactical protection of existing long positions — thus, we don't plan to sell all our Bitcoin holdings there. Potential short hedges could be secured with a stop 1% above the upper edge of the zone since there's a 30% chance that price could exceed this zone to develop a new high for blue wave alt.(i) before reversing later. Primarily, however, green wave C should commence in the upper blue zone and drive BTC down into the lower blue zone between $62,395 and $51,323—and thus to the low of orange wave a.
📈 Over 190 precise analyses, clear entry points, and defined Target Zones - that's what we do.

Bitcoin - Here we have the all time high!Bitcoin - CRYPTO:BTCUSD - is just getting started:
(click chart above to see the in depth analysis👆🏻)
It was really just a matter of time until we see a new all time high on Bitcoin. Consindering that over the past two months alone, Bitcoin rose another +50%, this was a clear indication that bulls are taking over. But this all time high is clearly not the end of the bullrun.
Levels to watch: $300.000
Keep your long term vision!
Philip (BasicTrading)

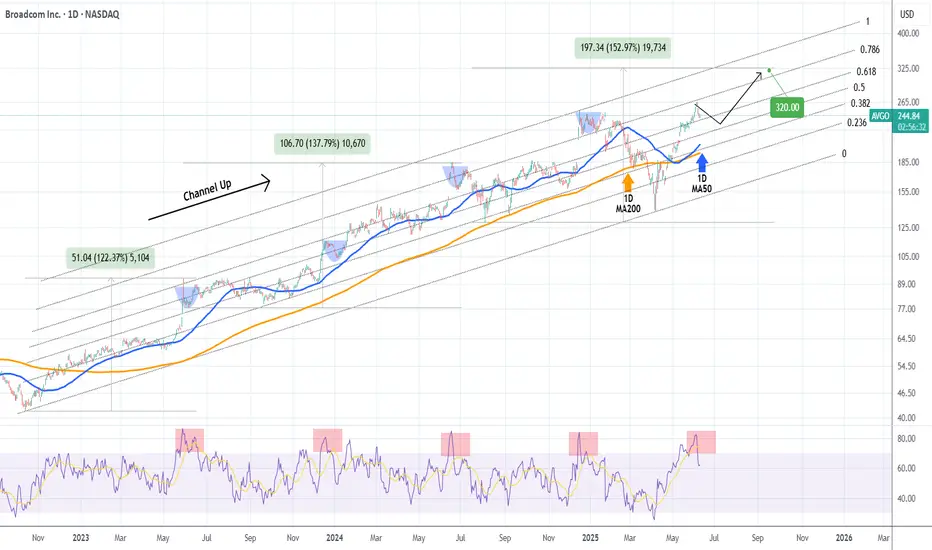
BROADCOM Pull-back to demand zone possible before new High.Broadcom Inc. (AVGO) is currently on a 3-day pull-back that started right on the 0.786 Fibonacci level of the 2.5 year Channel Up. The 1D RSI got heavily rejected from deep inside the overbought zone (>70.00) to back down below it and the only times that happened within this pattern, was during short-medium term pull-backs towards its 1D MA50 (blue trend-line).
As a result, the current pull-back can extend a little more towards the 1D MA50 and then rebound. Given a +15% added increas on each Bullish Leg of the Channel Up, we expect to see $320 next.
-------------------------------------------------------------------------------
** Please LIKE 👍, FOLLOW ✅, SHARE 🙌 and COMMENT ✍ if you enjoy this idea! Also share your ideas and charts in the comments section below! This is best way to keep it relevant, support us, keep the content here free and allow the idea to reach as many people as possible. **
-------------------------------------------------------------------------------
💸💸💸💸💸💸
👇 👇 👇 👇 👇 👇
BTC target months ago has been on point, "NEW" TargetsSo far our CRYPTOCAP:BTC 109 - 111k target has been MONEY!
Bitcoin hasn't been able to close above it all!!!
Showing Negative divergence on RSI & $ Flow on WEEKLY charts.
"New" CRYPTOCAP:BTC prediction?
Will stand by what we said previously. IMO there's good possibility we could see BTC going to the 170k area, extreme = 226K.
Monthly RSI doesn't peak until it hits 90's BUT there's Negative Divergence forming.
$ FLOW slowly diverging as well.
VOLUME DYING on SPOT. Not so bad on Futures.

BTCUSD: weekly overview for trading!Hello Traders, I'm mostly an investor for this instrument.
for this week we are struggling hard in middle of a long-term channel and also the effect of halving cycles could move the instrument more and more down.
But I'm waiting for good news form USD weakness. I'm still more bullish for Bitcoin.
****************
The indicated levels are determined based on the most reaction points and the assumption of approximately equal distance between the zones.
Some of these points can also be confirmed by the mathematical intervals of Murray.
You can enter with/without confirmation. IF you want to take confirmation you can use LTF analysis, Spike move confirmation, Trend Strength confirmation and ETC.
SL could be placed below the zone or regarding the LTF swings.
TP is the next zone or the nearest moving S&R, which are median and borders of the drawn channels.
*******************************************************************
Role of different zones:
GREEN: Just long trades allowed on them.
RED: Just Short trades allowed on them.
BLUE: both long and short trades allowed on them.
WHITE: No trades allowed on them! just use them as TP points

TradeCityPro | Bitcoin Daily Analysis #113👋 Welcome to TradeCity Pro
Let’s dive into the Bitcoin analysis and key crypto indexes. As usual in this analysis, I’ll walk you through the futures triggers for the New York session.
⏳ 1-Hour Timeframe
As you can see in the one hour timeframe, Bitcoin has continued its upward movement and reached the 110256 level and is now undergoing a correction.
✔️ If the price continues correcting, the next support level will be 108777. In case of a deeper pullback, the next area to watch is 106586.
📈 For a long position, our first trigger level is 110256, with a target of 111747.
📊 Market volume is currently increasing, and if this inflow of buy volume continues, the probability of a bullish move increases.
💥 The RSI oscillator has dropped below the 70 level. If RSI reenters the overbought zone, we’ll also get a strong momentum confirmation.
👑 BTC.D Analysis
Let’s take a look at Bitcoin Dominance. Today, it finally closed below the 64.49 level and has dropped to 64.12.
⚡️ This drop has allowed capital to flow into altcoins, and many of them are moving upward today. If 64.12 breaks, the downtrend may continue.
📅 Total2 Analysis
Moving on to Total2, this index finally broke above the 1.21 level and is now heading toward 1.24.
💫 At the moment, there is no major resistance preventing the market from continuing its upward trend. But there’s an important point regarding USDT Dominance, which I’ll cover below.
📅 USDT.D Analysis
During this bullish move in the market, the dominance of Tether hit the support at 4.56, while other indexes and most altcoins activated their triggers.
🔑 The key point here is that Tether Dominance has such a significant influence on the market that the inability to break this support has caused the entire market, including Bitcoin, to start correcting.
🔽 The 4.56 level in USDT Dominance is very important and will be the key to triggering the next bullish leg.
❌ Disclaimer ❌
Trading futures is highly risky and dangerous. If you're not an expert, these triggers may not be suitable for you. You should first learn risk and capital management. You can also use the educational content from this channel.
Finally, these triggers reflect my personal opinions on price action, and the market may move completely against this analysis. So, do your own research before opening any position.

BTC/USDT Analysis: Best Long Entry Zones
Hello everyone! This is a daily analysis from a trader-analyst at CryptoRobotics.
After a strong breakout through the high-volume zone of $104,500–$105,800 and a full trend reversal to the upside, Bitcoin has reached its resistance zone at $107,000–$109,800 (accumulated volumes). At the upper boundary of this range, strong volume anomalies and profit-taking were recorded. The global trend remains bullish, but currently, there is a possibility of a strong correction down to the $105,800–$104,500 zone (accumulated volumes), which also roughly coincides with predictive liquidations that act as a magnet for the price.
An initial correction has already begun, but strong absorption of selling pressure has appeared around ~$109,200. If this level is breached without a renewed defense, the likelihood of further decline increases.
Sell Zone:
$110,000–$110,600 (profit-taking by large players).
Buy Zones:
$105,800–$104,500 (accumulated volumes),
$101,600–$100,000 (zone of previous pushing volumes + current buyer defense),
$98,000–$97,200 (local support),
Level at $93,000,
$91,500–$90,000 (strong buying imbalance).
This publication is not financial advice.

Ethereum's Price Action Reveals A Bullish Bitcoin, $8,513 Next!The strongest possible bullish signal has been confirmed. Ethereum just moved daily above MA200. This is the first time this happens coming from a low point since November 2024, this is massive.
This signal reveals two things: (1) Bitcoin is bullish and set to continue growing. You've never seen Bitcoin and Ethereum going in different directions. If Ethereum is set to continue up, Bitcoin will also do the same. The market is one. (2) Ethereum is now ready to grow for 6 months straight, minimum, and this opens the doors for $5,790 followed by $8,513 in this bullish wave. There can be more of course.
This is one of the strongest signals (MA200) but also one of the easiest to spot. It works with high accuracy, never fails. The market is bullish when the action happens above this indicator long-term.
So now you know, for sure—for certain, what will happen next. Knowing that Ethereum will be trading above $5,000 soon, how are you going to maximize profits from this knowledge? Do what it takes to increase your profits and trading success. This is the opportunity of a lifetime, it can be life changing.
Thank you for reading.
I am wishing you tons of profits, great luck and amazing success.
Namaste.

Inverse Head and Shoulders Now Clear On Bitcoin ChartTrading Fam,
It has now become apparent that Bitcoin has formed an inverse head and shoulders pattern on the daily. This is very bullish and should the pattern follow through, it gives some good long-range targets to shoot for by the end of this year and potentially, well into the next.
Calculating our first target is relatively simple. We draw a measurement from the bottom of the head (that largest dip) to the neckline. We then move that measurement line to an approximated breakout area. This then gives us an estimated target of around 150k. I will say that this is a fairly sure target before the end of the year if and when that neckline is broken to the upside.
Target number two should be that 350 DMA in my opinion. Bitcoin likes to kiss that 350 DMA in bullish markets. So, where ever that ends up being pricewise during this next upwards movement is a good target #2. I would estimate it will be at least 175-180k.
But if we break that 350 DMA to the upside, then you will know the end of our bull cycle is drawing close. Bitcoin may blow-off here and generally would stay above that 350 DMA for at least another month or two. In our last bull cycle it remained above the 350 DMA for 5 and a half months. Selling anytime we are significantly above that 350 DMA pricewise and timewise is not a bad strategy because you will know we are nearing the end of our bull cycle at this point.
I hope this post gives you some good long-term targets and trading strategies going forward. Personally, I will be looking to sell much if not most of my holdings once Bitcoin breaks above that 350 DMA. Of course, as always, I will keep you all posted when that time comes.
Best,
Stew

Ethereum breaking out!Two days ago, I've posted that we're most likely trading in a 2K-4K range on Ethereum. There was a slight deviation below 2K but the bulls swiftly regained control.
As for now, it's seems obvious we are heading towards, at least, 3K. I'm confident 4K is on the horizon, though I prefer to take it level by level.
ETH is breaking out off this bull flag and this chart looks more and more like one of those charts you study in textbooks.

BITCOIN BULLS ARE GAINING STRENGTH|LONG
BITCOIN SIGNAL
Trade Direction: long
Entry Level: 103,835.09
Target Level: 109,309.96
Stop Loss: 100,185.18
RISK PROFILE
Risk level: medium
Suggested risk: 1%
Timeframe: 9h
Disclosure: I am part of Trade Nation's Influencer program and receive a monthly fee for using their TradingView charts in my analysis.
✅LIKE AND COMMENT MY IDEAS✅

BTC Dominance looking real heavy up hereWouldn't be surprised in the least if we see a freefall on BTC Dominance over the next few months.
Of course there is no guarantee, and things may look different in a month, however as it stands, I think there is a potential ALT cycle on the cards for 2025.
RSI needs a reset, amongst other things.

Bitcoin Rally Overextended: Patience is Key for the Next Move💹 BTC/USDC – Bullish Outlook, heres my Trade Plan.
Bitcoin (BTC/USDC) is currently maintaining a strong bullish trajectory 🚀, showing impressive momentum after breaking through recent resistance levels 🔓.
However, price is now overextended from the last swing low, and I’m anticipating a pullback into value 🔄 — specifically targeting the 50%–61.8% Fibonacci retracement zone drawn from the latest swing low to swing high 📐. This zone often acts as a rebalancing point for institutional traders and provides confluence for smart entries 🎯.
I’ll be closely watching this retracement area for signs of support forming, and more importantly, a bullish break in market structure 🧠📊. Only after that confirmation, would I consider executing a long position — no structure break, no trade ✅.
This isn’t about predicting — it’s about reacting with discipline.

Bitcoin Approaches Resistance as Momentum Cools: What’s Next?Bitcoin has been on a strong upward trend 🚀, but recent moves show signs of exhaustion as it approaches major resistance zones 🛑. The appearance of a three-drive pattern on the 4-hour chart, suggests the market could be due for a healthy correction 🔄. While the broader trend remains bullish, I'm watching for a potential pullback and then looking for renewed strength (bullish BoS) before considering new long positions. Patience and confirmation are key in these conditions! 👀✨
