Bitcoin Weekly Outlook – June 9, 2025Bitcoin ( BINANCE:BTCUSDT ) continues to maintain its bullish structure, now trading around $106.6K. While price action looks strong, the market is approaching a key resistance zone between $110K–$120K, with technical signals hinting at a possible short-term rejection before further upside.
🔍 Technical Overview
Current Price: $106,654
Resistance Zone: $110K – $120K
Support Zone for Pullback: $98K – $100K
200 EMA & 100 EMA: Still trending up and providing strong base support
The chart suggests a potential "rejection-retest-rally" structure forming, where BTC may temporarily pull back before making a fresh push toward new highs.
📊 Momentum & Indicators
Stochastic RSI on the daily timeframe recently bottomed and is starting to curl back up — a potential bullish shift in momentum
Volume remains stable — no signs of aggressive distribution or FOMO activity yet
💬 Sentiment & Structure
The current structure remains healthy, with HH-HL (higher high - higher low) formation intact. Market sentiment is optimistic but not yet euphoric, which is ideal for continued accumulation.
Short-term traders may look for a pullback opportunity near the $98K–$100K zone before re-entering.
🎯 Mid-Term Outlook
If BTC holds the $98K–$100K range during a pullback, it could act as a springboard toward the $120K target in the coming weeks.
✅ Summary
🔵 Bullish trend intact
📉 Possible short-term pullback before breakout
📈 Mid-term target remains: $120K
🚫 Avoid chasing breakouts — position wisely at key supports
Let the price come to you. Patience pays more than FOMO.
Bitcoin (Cryptocurrency)

Market Overview
WHAT HAPPENED?
Last week, after fluctuating in a sideways range, bitcoin began to decline. Only $300 wasn’t enough to reach the level of $100,000 — there was a strong absorption of market sales, and a rebound occurred.
WHAT WILL HAPPEN: OR NOT?
We tested the $104,500–$105,800 zone (accumulated volumes). There is no abnormal activity or strong sales within it, which increases the likelihood of continued upward movement to the next sell zone. After that, the current volumes may go long, forming a new support zone in the range of $105,800–$104,500.
This week, we can consider a long retest of the support of $104,500–$105,800 with confirmation of the buyers' reaction. However, low volumes in the upward wave keep the risk of a sharp resumption of sales. In this case, the key entry level will shift to the psychological mark of $ 100,000.
Supply Zone:
$107,000–$109,800 (accumulated volumes)
Demand Zones:
$101,600–$100,000 (previous push-volume zone + current buyer defense)
$98,000–$97,200 (local support)
$93,000 level
$91,500–$90,000 (strong buy-side imbalance)
IMPORTANT DATES
Macroeconomic developments this week:
• Wednesday, June 11, 12:30 (UTC) — publication of the basic US consumer price index for May, as well as in comparison with May 2024;
• Thursday, June 12, 06:00 (UTC) — UK GDP for April is published;
• Thursday, June 12, 12:30 (UTC) — publication of the number of initial applications for unemployment benefits and the US producer price index for May;
• Friday, June 13, 06:00 (UTC) — German consumer price index for May is published.
*This post is not a financial recommendation. Make decisions based on your own experience.
#analytics

Is Bitcoin hearing for a ATHs, again?After reaching new highs around $112k, BTC has since retraced to support around $100k.
Currently reclaiming support around $105k, continued strength could see price reach ATHs in the coming days or weeks.
Losing support around $105k could signal a retest of $100k.
Referring to a previous post, my theory that we may not see sub $100k for the rest of the year is still in play, perhaps a signal of market strength despite the fear of the bull market ending.
Evidently, BTC is still holding up to all bullish expectations... Until proven otherwise.

AUDUSD BULLISH OR BEARISH DETAILED ANALYSISAUDUSD is currently forming a strong ascending triangle on the 8H chart, with a series of higher lows pressuring a key horizontal resistance zone around 0.65250–0.65300. This is a classic bullish continuation pattern, indicating buyer strength and a potential breakout toward 0.67000 if the structure confirms. The current price action at 0.65285 shows that bulls are testing the upper boundary again, signaling possible breakout acceleration as we move into mid-June volatility.
From a macro standpoint, the Australian dollar is supported by rising commodity demand, particularly in iron ore and copper — both of which are showing strength in global markets. At the same time, the Federal Reserve remains cautious with its rate path, with recent U.S. labor data pointing to a cooling job market. Traders are now pricing in possible rate cuts sooner than expected, weakening the dollar’s bullish grip. This divergence in central bank tone and economic performance favors risk-on currencies like the AUD.
Technically, the ascending triangle is providing solid structure and confluence. Breakout traders may look for a clean candle close above 0.65350, which could open the path to the 0.67000 zone with minimal resistance ahead. A well-placed stop below the 0.64500 zone keeps risk controlled, and the favorable risk-to-reward ratio makes this setup ideal for swing continuation strategies in trending environments.
This pattern has been building over several weeks, showing market accumulation and strong bullish compression. With today's fundamentals aligning with the technical structure, AUDUSD looks ready to launch into a higher bullish leg. Keep eyes on the breakout candle and volume confirmation as we may be entering a powerful momentum phase toward the 0.67 handle.

Bitcoin above the supportBitcoin back tested the important yellow resistance on weekly and closed a hammer candle above the pivot.
I wont be surprise to see $130k in couple of weeks.

Bitcoin - Bitcoin holds $100,000 support?!Bitcoin is above the EMA50 and EMA200 on the four-hour timeframe and has broken out of its short-term descending channel. We can look for Bitcoin short positions from the supply zone. If this corrective move occurs, we can also look for Bitcoin long positions in the demand zone.
It should be noted that there is a possibility of heavy fluctuations and shadows due to the movement of whales in the market and capital management in the cryptocurrency market will be more important. If the downward trend continues, we can buy in the demand range.
Bitcoin network transaction activity has dropped to its lowest level since October 2023. According to data from The Block, the seven-day moving average of Bitcoin transactions has recently declined to 317,000—marking the lowest point in the past 19 months. This decline comes at a time when Bitcoin’s price still hovers near its all-time highs.
Meanwhile, Bitcoin Core developers have recently stated that network nodes should not block the relay of low-fee or non-standard transactions if miners are willing to process them. This highlights a shift in Bitcoin’s policy direction and indicates a growing acceptance among some miners of lower-cost transactions.
In certain instances, miners’ appetite for transaction fees appears to have diminished. Mononaut, founder of the Mempool project, pointed out that a transaction with an almost-zero fee was recently included in a block. This could signal reduced network activity or a declining need among miners to prioritize high-fee transactions.
Currently, only 0.3% of American investors’ total assets are allocated to Bitcoin. Real estate dominates their portfolios, followed by bonds and stocks.This means that Bitcoin accounts for a very small portion of U.S. investor wealth. However, if even a small fraction of capital currently tied up in real estate, stocks, or bonds shifts into Bitcoin in the future, it could have a substantial market impact—an encouraging sign over the long term.
The United States has emerged as the dominant force in the Bitcoin ecosystem. A report by River outlines how this dominance has reached its peak. The U.S. holds nearly 40% of the total Bitcoin supply, and American companies account for a staggering 94.8% of public Bitcoin ownership. Additionally, 82% of development funding and approximately 79.2% of Bitcoin ETF ownership originate from the U.S. The country also commands about 36% of the global hash rate.
Since 2021, the total value of Bitcoin mined by American companies has reached $42.6 billion, accompanied by over $30 billion in investment into Bitcoin mining infrastructure. The U.S. now hosts more than 150 Bitcoin-related companies and 40 mining sites with capacities exceeding 10 megawatts.
Today, nearly two-thirds of all Bitcoin in circulation is held by individuals who rarely—or never—sell their coins. In just the last 30 days, roughly 180,000 Bitcoins have been moved to wallets with historically low selling activity. Meanwhile, whales continue to accumulate Bitcoin at price levels above $100,000.

Bitcoin H1 | Bullish rebound to extend higher?Bitcoin (BTC/USD) is falling towards a pullback support and could potentially bounce off this level to climb higher.
Buy entry is at 105,148.50 which is a pullback support that aligns with the 23.6% Fibonacci retracement.
Stop loss is at 103,900.00 which is a level that lies underneath a swing-low support and the 38.2% Fibonacci retracement.
Take profit is at 107,583.00 which is a pullback resistance that aligns with the 127.2% Fibonacci extension.
High Risk Investment Warning
Trading Forex/CFDs on margin carries a high level of risk and may not be suitable for all investors. Leverage can work against you.
Stratos Markets Limited (tradu.com ):
CFDs are complex instruments and come with a high risk of losing money rapidly due to leverage. 63% of retail investor accounts lose money when trading CFDs with this provider. You should consider whether you understand how CFDs work and whether you can afford to take the high risk of losing your money.
Stratos Europe Ltd (tradu.com ):
CFDs are complex instruments and come with a high risk of losing money rapidly due to leverage. 63% of retail investor accounts lose money when trading CFDs with this provider. You should consider whether you understand how CFDs work and whether you can afford to take the high risk of losing your money.
Stratos Global LLC (tradu.com ):
Losses can exceed deposits.
Please be advised that the information presented on TradingView is provided to Tradu (‘Company’, ‘we’) by a third-party provider (‘TFA Global Pte Ltd’). Please be reminded that you are solely responsible for the trading decisions on your account. There is a very high degree of risk involved in trading. Any information and/or content is intended entirely for research, educational and informational purposes only and does not constitute investment or consultation advice or investment strategy. The information is not tailored to the investment needs of any specific person and therefore does not involve a consideration of any of the investment objectives, financial situation or needs of any viewer that may receive it. Kindly also note that past performance is not a reliable indicator of future results. Actual results may differ materially from those anticipated in forward-looking or past performance statements. We assume no liability as to the accuracy or completeness of any of the information and/or content provided herein and the Company cannot be held responsible for any omission, mistake nor for any loss or damage including without limitation to any loss of profit which may arise from reliance on any information supplied by TFA Global Pte Ltd.
The speaker(s) is neither an employee, agent nor representative of Tradu and is therefore acting independently. The opinions given are their own, constitute general market commentary, and do not constitute the opinion or advice of Tradu or any form of personal or investment advice. Tradu neither endorses nor guarantees offerings of third-party speakers, nor is Tradu responsible for the content, veracity or opinions of third-party speakers, presenters or participants.

ETHEREUM is repeating BITCOIN's 2018-2021 Cycle!Ethereum (ETHUSD) has found itself on a very strong rally since the April 07 bottom, which resembles the V-shaped recovery of Bitcoin on the March 09 2020 bottom. In fact BTC's whole 2018 - 2021 Bull Cycle resembles ETH's 2022 - 2025 Cycle so far.
So far ETH is struggling to break above its 1W MA50 (blue trend-line) but the most important Resistance of the Cycle is the ATH Lower Highs trend-line. When that broke for Bitcoin, a parabolic rally started. Do you think we will see such a break-out on ETH too by the end of the year?
-------------------------------------------------------------------------------
** Please LIKE 👍, FOLLOW ✅, SHARE 🙌 and COMMENT ✍ if you enjoy this idea! Also share your ideas and charts in the comments section below! This is best way to keep it relevant, support us, keep the content here free and allow the idea to reach as many people as possible. **
-------------------------------------------------------------------------------
💸💸💸💸💸💸
👇 👇 👇 👇 👇 👇

09/06/25 Weekly OutlookLast weeks high: $106,812.33
Last weeks low: $100,372.93
Midpoint: $103,592.63
Billionaire spats and V-shaped recoveries, the beginning of June starts off in an interesting way. As President Trump goes forward with "The big beautiful bill" Elon Musk lets his feelings be known publicly sending shockwaves throughout markets, but what does this mean for Bitcoin?
The bill could add $3-5T in US government spending which is great for risk-on assets as there is more money able to flow into markets. I believe this exact thought process is visible on the chart in the V-shaped recovery we can see on Thursday. A clear sell-off as Elon Musk's anti government spending views clash with the bill, the uncertainty causes a sell the news moment, just as BTC comes into $100,000 the dip is bought up on the realization this means greater inflows are on the way, dips are truly for buying at this stage in the cycle and to me, this proves it.
In a more bearish view of the chart I would say the clear resistance is now weekly high at ~$106,000. Anything above that meets huge selling pressure with price discovery on the other side the market just doesn't seem to have the fuel as of yet to make the next step. However I believe it is just a matter of time and as M2 global money supply grows we get closer and closer to seeing new significant highs.
For this week CPI & PPI take place on Wednesday and Friday respectively. With CPI set to grow from 2.3% to 2.5% according to forecasts it will be interesting to see how markets react, expect short term volatility. Key battlegrounds for me are weekly high and midpoint.
Good luck this week everybody!

BTC 1H Reverse H&S Morning folks,
So, drop is done due to Trump-Musk conflict, although we haven't called to trade it. Anyway, current picture is much better and doesn't need a lot of comments. We have reverse H&S in progress, with potential area for entry around 102.5-103K where we expect the right arm should appear. Invalidation point is ~100K (bottom of the head).

BTCUSD : SELL IN 4HR CHARTBTCUSD SELL @ 106000 or below
Target : 100000
Stoploss : 107500
BTCUSD formed a perfect sell trend in 4hr chart. I am short on BTCUSD

SUSDTAnalysis is the same analysis, it just seems like the type of pattern is different... we have another low and then a high...

Bitcoin (BTCUSD) - Daily Price Consolidation Under ResistanceBitcoin (BTCUSD) price has been in a short-term downtrend since June 2025.
Price is currently consolidating under $106,000 resistance.
Watching to see if an evening star candle pattern prints on the daily chart, for a very-short-term pullback.
Support targets: $105,000, $104,000, $101,000, $100,000.
Resistance targets: $107,000, $109,000, $110,000, $112,000.
Bitcoin has been correlating with the USA stock market, tech stocks, consumer sentiment, and breaking news.

Bitcoin's Next 20% Move? My Plan Unveiled Bitcoin (BTC) - Navigating Key Levels & Potential Paths
Technical Outlook — 8 June, 2025
1. Current Market Context:
Price Action: Bitcoin is currently trading around the $106,000 mark after a recent retracement from higher levels. We've seen a significant rally from the April lows, and the market is now consolidating.
Key Levels: The chart highlights several important resistance and support zones that will likely dictate future price movements.
2. Key Observations & Potential Scenarios:
Resistance Levels:
Immediate Resistance: ~$108,000 - $112,000. This zone has acted as resistance previously and is currently being tested.
Next Major Resistance: ~$124,000 - $128,000. This is a crucial zone from previous highs and a potential target if the current resistance is overcome.
Support Levels:
Immediate Support: ~$96,000 - $100,000. This zone aligns with previous price consolidation and is the first line of defense if the price drops.
Strong Support: ~$92,000 - $88,000. This area previously acted as significant support and could be a strong bounce zone.
Lower Support/Trendline: ~$76,000 - $80,000. This aligns with the lower boundary of the broader ascending channel/trendline.
Highlighted Paths (Orange Arrows): The chart suggests two potential paths:
Scenario A (Bullish Continuation): A break above the $108,000-$112,000 resistance, leading to a push towards $124,000-$128,000. This would likely follow a slight dip or consolidation before the breakout.
Scenario B (Retracement & Bounce): A deeper retracement towards the $96,000-$100,000 or even $92,000-$88,000 support zones, followed by a bounce and subsequent rally towards the higher resistance levels. This scenario aligns with the idea of a healthy correction before further upward movement.
3. Trading Plan:
A. Bullish Entry (Aggressive / Confirmation Trade):
Trigger: Clear daily candle close above the $112,000 resistance level with strong volume.
Entry: Upon confirmation of the breakout.
Target 1: $124,000
Target 2: $128,000
Stop Loss: Below the newly formed support level (e.g., $105,000 - $107,000, depending on the breakout structure).
B. Long Entry (Dip Buy / Value Trade):
Trigger: Price retests and holds either the $96,000 - $100,000 support zone or the $92,000 - $88,000 support zone. Look for bullish reversal candlesticks (e.g., hammer, bullish engulfing) on the daily timeframe.
Entry: Upon confirmation of support holding and a bullish reversal signal.
Target 1: $108,000
Target 2: $112,000
Target 3: $124,000 - $128,000 (if momentum continues).
Stop Loss: Just below the tested support zone (e.g., $95,000 for the first support, or $87,000 for the second support).
C. Bearish Outlook (Short-Term / Risk Management):
Trigger: A clear daily candle close below the $88,000 support level, invalidating the current bullish structure.
Action: Consider exiting long positions or being prepared for further downside towards the $76,000 - $80,000 level. This would suggest a breakdown of the overall uptrend.
4. Risk Management:
Position Sizing: Only risk a small percentage of your trading capital on any single trade (e.g., 1-2%).
Stop Loss: Always use a stop loss to limit potential losses.
Profit Taking: Consider taking partial profits at target levels to secure gains.
Market Volatility: Bitcoin is highly volatile. Be prepared for rapid price movements.
5. Additional Considerations:
Volume: Always pay attention to trading volume. Strong volume on breakouts confirms the move, while weak volume may suggest a false breakout.
If you found this analysis valuable, kindly consider boosting and following for more updates.
Disclaimer: This content is intended for educational purposes only and does not constitute financial advice.

Bitcoin, Fast & Easy. $100,000 Support Holds +AltcoinsThe main support is not $100,000 but $102,000, so we make this a range. Yesterday, for the first time this range was tested and it holds easily... We are strongly bullish above $102,000 and Bitcoin is already trading above 103K.
This is really good news but we are not fully in the green yet. Bitcoin can continue sideways, consolidation, and only after closing above $106,000 we are looking for higher prices. Once $110,000 gets conquered, we can start talking about new all-time highs and sustained bullish growth. Meanwhile, the altcoins grow.
So we are not there yet but this is the best ever. For Cryptocurrency to thrive we need a strong Bitcoin and Bitcoin right now is very strong. Are you trading any altcoin? If you are, feel free to accumulate, load-up, buy and hold.
As for Bitcoin, here is a very easy trading approach:
While above $100,000, ALL-IN bullish confirmed.
If it goes below $100,000, stay out and wait to see what the market does. As soon as there is a support level created, we go LONG. If it goes below $100,000 just to recover the next day, we are again ALL-IN as soon as Bitcoin starts trading above 100K.
This process can be repeated many times but once Bitcoin takes off, buying below $110,000 is a major win because soon Bitcoin will be trading above $150,000. We have targets around $180,000 and even beyond $200,000 is possible this same year. Never forget the bigger picture.
The bigger picture is bullish for Bitcoin and the altcoins, the short-term can create confusion because the chart, market conditions, can change within hours.
But there can be a drop, a retrace or a market flush, but knowing that Bitcoin will be trading above $150,000 soon turns such an event into a non-event, it makes it into a simple hold.
The action on the side of the altcoins confirms that Bitcoin will continue to grow. Short, mid and long-term.
There is no retrace, there is no correction, only a small consolidation phase in anticipation of the next bullish wave. You already know this. If you didn't, now you know.
In 2025, Bitcoin will continue to grow. Just as it grew in 2023 and 2024.
We are entering bull market season. Bullish momentum will only start to gain force.
Namaste.

Bitcoin: Break Out Or Fake Out Can Be Long.Bitcoin has adhered to my previous week's anticipated scenario almost exactly. While this may be a coincidence, I have called similar scenarios like this numerous times just see my previous articles, I left the illustration on the chart. From here, there are two scenarios to consider, one offering greater probability than the other. Let me explain.
First consider that the Bitcoin trend has never changed. The broader tend is bullish and the previous weeks only saw a brief corrective structure which found support in the 102K AREA )see my previous article). A reversal developed and confirmed and now we are in the process of rallying back toward the highs.
Scenario 1 The Breakout: IF the high 106's are cleared, it is possible price can break out to potentially test the next resistance around the 110K area. Since this environment is typically a lower volume time of year, I believe there is a greater chance of fake out. How you manage the risk all depends on the time frame you operate on. Smaller time frames can pin point more accurate signs of follow through while maintaining tighter risk while taking the breakout on this time frame exposes you to more risk. If taking the breakout on this time frame, consider mitigating risk with smaller size or being prepared to exit IF a conflicting signal appears like a bearish pin bar.
Scenario 2 The Retrace: IF price rejects the 106K area (fake out possibility) then I will be watching for a retest of the 104K area minor support. This is the level where I would be looking for confirmation patterns like bullish pin bars etc. This would not only constitute a higher low but also establish a classic inverted head and shoulders pattern. I do not put a lot of emphasis on the broader pattern, but it can help foster a self fulfilling prophecy. This reversal offers a greater probability since it is coming from a pullback within a broader bullish trend. Also the profit objective is greater since the 110K resistance would still be the same.
How you mange this again depends on the type of strategies you employ. My analysis is meant to provide an overall roadmap of the possibilities that I anticipate and nothing more. If you are a day trader this information will not be used the same way compared to if you are a swing trader. The key is how you define the risk and the confirmations. If the market rejects both scenarios, then we simply have to readjust to the new information that becomes available.
Thank you for considering my analysis and perspective.

BITCOIN Support & Resistance Levels🚀 Here are some key zones I've identified on the H4/H1 timeframe.
These zones are based on real-time data analysis performed by a custom software I personally developed.
The tool is designed to scan the market continuously and highlight potential areas of interest based on price action behavior and volume dynamics.
Your feedback is welcome!

BTC, where we can setup our sell positions.Hello, dear traders! It's Nika again.
I want to share this beautiful pattern and tell you some about its meaning...
---
So, as we see here, we have this "triangular-shaped uprising pattern".
We got this pattern with its own few supporting and formatting levels.
Almost all of them are marked on our chart!
---
The "usage" of this may be something like this...
First, we may see the price testing an important price level of pattern 96,000,00 very soon...
---
After, if the price continues checking support levels below, we may also see the 91 & 89 K price levels.
You will profit from this price movement only if the price goes this way. :)
---
Wishing you a happy trading day and much more success in your trades!
---
If you have any questions, please comment or send a message.
Thank you!

BTCUSD - Technical Setup Points to Renewed UpsideLooking at this Bitcoin/USD daily chart, the technical setup strongly favors upside continuation despite the recent pullback from the $113,000 highs. The cryptocurrency has demonstrated remarkable resilience by maintaining support above the $100,000 psychological level after its dramatic surge from the March lows around $60,000, representing an 80%+ rally that established a clear bullish trend structure. The current consolidation pattern around $104,000 appears to be a healthy correction within the broader uptrend, with the green arrow projection suggesting potential for further gains toward the $115,000+ region. Key supporting factors include the sustained break above multiple resistance levels, the formation of higher lows throughout the uptrend, and the relatively shallow nature of the current pullback compared to the magnitude of the preceding advance. While short-term volatility remains elevated, the overall momentum and trend structure indicate that buyers are likely to step in on any weakness, making a resumption of the uptrend the higher probability scenario.
Disclosure: I am part of Trade Nation's Influencer program and receive a monthly fee for using their TradingView charts in my analysis.

#202523 - priceactiontds - weekly update - bitcoinGood Day and I hope you are well.
comment: 3 legs down, bull flag trend line break but confirmation is only above 106840. It’s still much more bullish than bearish, since bears could not close the gap down to the April high 97915. Market expects a re-test of 110000 or higher and this breakout of the bull flag is as textbook perfect as it gets. Only a daily close below 100000 will change my bias and I will begin to look for lower targets again.
current market cycle: Broad bull channel on the weekly tf. Market is about to re-test the ath and will likely transition into a trading range afterwards or we are already in one.
key levels: 100k - 115k
bull case: Confirmation for the bull flag breakout is 106840, stop has to be 100300. 110000 is expected and you never know in advance if you get a a higher or lower high from double tops/test of the extremes.
Invalidation is a daily close below 100k
bear case: Bears tried 3 times and are likely to give up until we have a credible double top and more signs that the bulls are exhausted and can not push much beyond 110k. Can you sell 106k now and hope for a failed breakout? I don’t think that is a good trade at all. As a bear I would wait.
Invalidation is above 116k
short term: Bullish for 110k, invalidation is below 100k. I don’t expect much above 110k, maybe 115k.
medium-long term - Update from 2025-06-08: Need to see a clear sign that bulls can not push it beyond 112k and once we turn again from closer to the ath, I will comment on bear targets for the next months.

TradeCityPro | Bitcoin Daily Analysis #111👋 Welcome to TradeCity Pro!
Let’s take a look at Bitcoin and key crypto indicators. As usual in this analysis, I’ll review the futures triggers for the New York session.
⏳ 1-Hour Timeframe
As you can see in the 1-hour timeframe, none of our triggers were activated yesterday and Bitcoin has been ranging.
⭐ There was an important RSI level at 53.49, which was tested multiple times. I mentioned that breaking this level could trigger a slight correction — and that’s exactly what happened. The price pulled back slightly to 105087, retested this zone, and now RSI has returned above 53.49. Price is also moving with strong bullish momentum toward the 105851 resistance.
📊 The buying volume entering the market is quite strong, and if this increase continues, the price could begin an upward move. So in terms of both momentum and volume, we have bullish confirmation and can enter a position if the triggers activate.
📈 For a long position, the trigger we’re watching is 105851. While the main resistance is at 106586, I prefer to take the risk and open the position earlier, because I think the 106586 break won’t provide a clean entry and would be harder to act on.
✨ So my chosen trigger for a long position is 105851. Given the rising volume and high RSI momentum, we have the confirmations needed to open this trade.
🔽 For a short position, the first trigger is the break of 105087. This is a risky position since we haven’t yet confirmed a trend reversal — this would be the first signal if a downtrend begins. Personally, I’ll wait for confirmation of bearish momentum before opening a short.
👑 BTC.D Analysis
Bitcoin Dominance is still below the 64.67 level and is ranging under this resistance.
🧩 A break above 64.67 would confirm a bullish move in dominance. A break below 64.49 would signal a bearish reversal.
📅 Total2 Analysis
Total2 is ranging below the 1.15 level. A break above this zone could initiate a bullish move.
🔔 On the bearish side, the current trigger is the 1.13 level. We need to wait for this level to be broken for a trend reversal confirmation.
📅 USDT.D Analysis
Tether Dominance stabilized below the 4.79 zone yesterday and has now pulled back to it, preparing for a possible second leg downward.
🔑 If that happens, the crypto market could move upward. However, if USDT.D rises back above 4.79, its uptrend could continue.
❌ Disclaimer ❌
Trading futures is highly risky and dangerous. If you're not an expert, these triggers may not be suitable for you. You should first learn risk and capital management. You can also use the educational content from this channel.
Finally, these triggers reflect my personal opinions on price action, and the market may move completely against this analysis. So, do your own research before opening any position.

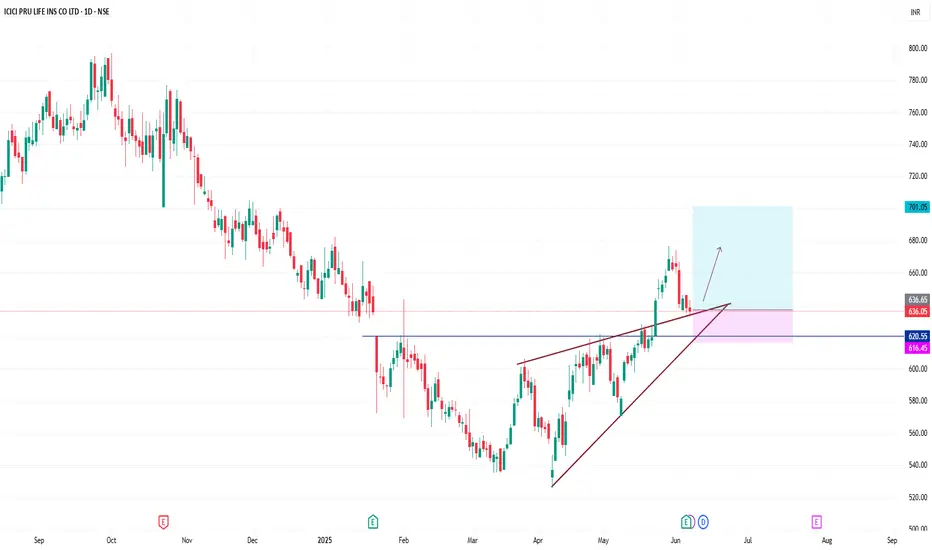
ICICI PRU LIFE INSDaily timeframe, its a swing trade, trendline breakout and retest, stoploss below 620 and target is 700, add your watchlist and observ this stock.
Bitcoin’s Reversal from Supports — Is the Correction Over? Bitcoin ( BINANCE:BTCUSDT ) moved as I expected in the previous idea , and it also reversed the decline I intended and started to rise from the Support zone($102,000-$107,120) , Support lines , and 50_SMA(Daily) .
Bitcoin is trading near the Resistance zone($104,380-$103,670) , Cumulative Short Liquidation Leverage($105,500-$105,265) , and Resistance lines .
In terms of Elliott Wave theory , it seems that Bitcoin has managed to complete the main wave Y . The main corrective structure was the Double Three Correction(WXY) . If the Resistance lines are broken , we can confirm the end of the main wave Y .
I expect Bitcoin to start rising after a re-correction from Cumulative Long Liquidations Leverage and reach the targets I have specified on the chart.
Cumulative Long Liquidation Leverage: $102,883-$102,181
Cumulative Long Liquidation Leverage: $101,318-$100,748
Note: If Bitcoin falls below $100,200(Worst Stop Loss(SL)), we should expect further declines.
Note: $105,500 is an important price for Bitcoin, and if Bitcoin can close the 4-hour candle above it, we can expect a break of the Heavy Resistance zone($104,380-$103,670)
Please respect each other's ideas and express them politely if you agree or disagree.
Bitcoin Analyze (BTCUSDT), 1-hour time frame.
Be sure to follow the updated ideas.
Do not forget to put a Stop loss for your positions (For every position you want to open).
Please follow your strategy and updates; this is just my Idea, and I will gladly see your ideas in this post.
Please do not forget the ✅' like '✅ button 🙏😊 & Share it with your friends; thanks, and Trade safe.
