Bitcoin Hits New High Thanks Mars & Saturn: Bearish Or Bullish?Based on new data that is available just now, the daily action and the Altcoins market is Bitcoin considered to be bullish or bearish coming from TA?
Bitcoin just produced a new ATH based on candle close, 20-May, higher than 18-May at $106,855. Resistance continues to be challenged, the more challenge the weaker it becomes.
Market conditions are bullish of course, we have now the same situation as in late April and in late April we were witnessing a bullish continuation and prices moved up. Remember late May? That's the time when everything Crypto goes bullish and bullish it is already just hyper-bullish not yet.
A new All-Time High is bullish enough I guess but Bitcoin will continue growing we have very good dates 22 and 24 May. And then the rest of the month for additional growth. This is only the start.
But, will Bitcoin continue straight up or is there room for a retrace?
That's being a bit too greedy but ok, let's study the chart an answer. There is room for a small retrace but this type of retrace is low probability, why? Many people would be waiting for such a move and since this is easy to see and expect the market movers tend to move in a way that people cannot predict, which means straight up. Most people would think that straight up is too much, there must be some relief and so, instead of betting up they bet down short-term but this never works because all the bears are thinking the same. The whales are smart and know how to play. Once the "go" button is on, it is on and Bitcoin grows non-stop until the next major resistance zone.
I identified for you the most strong support level ultra long-term, based on numbers from 2022-2021 and that's $102,000. This level cannot fail weekly/monthly timeframes.
Now, my idea is that Bitcoin will continue growing straight up. There is just no time for retrace, Bitcoin is being magnetized by an incredible force. Bitcoin is being guided by Mars and Saturn and both of these planets are saying up!
Namaste.
Bitcoin (Cryptocurrency)

Bitcoin: LEVELS LOOKOUT!If you find this information inspiring/helpful, please consider a boost and follow! Any questions or comments, please leave a comment!
BTC on Watch: Short-Term Levels That May Show the Market’s Hand
#Bitcoin is hovering around all-time highs, but traders should be on high alert. There’s a visible level just beneath price that’s acting as the current line in the sand.
What to Look At
Rather than overanalyze, just focus on the chart. A clean level around $100k is marked — if that gives way, it may not just be a smaller degree pullback on news. It could be the start of something more revealing and deeper.
What Comes Next?
If price breaks that 107k zone, watch what the market prints in response. Does it flush impulsively? Does it grind? Those reactions will show intent — and possibly confirm or deny a larger corrective wave unfolding.
Outlook
We’re not guessing the future — we’re waiting to observe the market’s decision point. Eyes on that level. If it breaks, the chart will speak louder than words.
Trade Safe!
Trade Clarity!

Bitcoin - Confirmed Breakout#BTC/USDT #Analysis
Description
---------------------------------------------------------------
+ Bitcoin has successfully broken out from the resistance, this is the third time bitcoin has broken out from the resistance line, in the previous two breakouts bitcoin had significant growth and we can expect similar growth this time.
+ the next target for bitcoin is around 150k and this is an easy target for bitcoin.
+ Bitcoin can see some consolidation around previous resistance (around 109k) but this can be broken easily.
+ Lets see how this plays out.
---------------------------------------------------------------
Enhance, Trade, Grow
---------------------------------------------------------------
Feel free to share your thoughts and insights. Don't forget to like and follow us for more trading ideas and discussions.
Best Regards,
VectorAlgo

ICP - Perfect Long OpportunityDescription
---------------------------------------------------------------
+ ICP has started reversal inside the channel and the price is heading towards the resistance zone, this gives a bullish trade opportunity.
---------------------------------------------------------------
VectorAlgo Trade Details
------------------------------
Entry Price: 5.3
Stop Loss: 3.3
------------------------------
Target 1: 6.9
Target 2: 12.7
Target 3: 22.5
------------------------------
Timeframe: 1W
Capital Risk: 1-2% of trading amount
Leverage: 5-10x
---------------------------------------------------------------
Enhance, Trade, Grow
---------------------------------------------------------------
Feel free to share your thoughts and insights. Don't forget to like and follow us for more trading ideas and discussions.
Best Regards,
VectorAlgo

Bitcoin Lines- What you can see if you remove Bars and replace them by Lines ?
- Congratulation, you just removed the noise in the chart.
- Everything is in graph.
- Covid19 Black Swan included.
- Not a price prediction.🤷♂️.
Happy Tr4Ding !

TradeCityPro | Bitcoin Daily Analysis #100👋 Welcome to the 100th Bitcoin Analysis!
I'm really happy we've shared this 100-day journey together, and I hope you've been able to benefit from these analyses along the way.
💥 Every single analysis I've posted so far has been the basis for real trades that I've taken myself. I'm glad to say the overall result of those trades has been profitable, and I hope your results have been positive too.
⚡️ Today, I want to do a full multi-timeframe breakdown of Bitcoin and other major crypto indices. Let’s dive in and see where the market stands.
💰 Bitcoin Analysis
📅 Weekly Timeframe
As you can see, in the weekly chart, Bitcoin reacted to an ascending curved trendline during its recent correction phase and retraced up to around 72,147.
💫 On the RSI, we also have a key support level at 44.75, which has held again. The combination of this support with the curved trendline has created a potential PRZ (Potential Reversal Zone), and price has since resumed its upward move.
✔️ Last week’s candle managed to close above the resistance at 104,919 for the first time ever. Many in the market expected that a weekly close above this level would trigger a sharp rally toward 130,000 or even 160,000.
📊 However, that hasn’t happened—this week’s candle is still small and lacks strong bullish momentum.
✨ We can now view the range between 104,919 and 108,454 as a resistance zone. Although the price has entered this zone, we haven’t yet confirmed a breakout. That confirmation would come with a weekly close above 108,454.
📈 Despite the strong momentum before breaking ATH, price seems to be losing steam now. That’s not necessarily bad—it’s actually expected, since this area is one of the most important supply zones for Bitcoin and won’t break easily.
🔽 If price gets rejected and this move turns out to be a fakeout, there’s a real possibility of a trend reversal. We’ve got a potential double top forming, which is usually the first signal of a reversal. If price then breaks the 72,147 support, it would confirm the end of the current uptrend. A lower high and lower low afterward would confirm a new downtrend.
⭐ At this point, I can’t give you a new spot-buy trigger in this timeframe. The trigger was around the curved trendline. Since price has moved away, we need to wait for a new setup to form.
Let’s check lower timeframes for more detailed price action.
📅 Daily Timeframe
In the daily chart, after getting support at 76,087, price started moving up and with the breakouts of 87,700 and 91,953, the bullish phase began.
🔍 Currently, price is holding above 106,250 with increasing volume since the 91,953 breakout. Everything looks ready for Bitcoin to begin its main move and enter an extension leg up.
🚀 If this happens, price could target 129,000 and even 150,000. RSI will be key for confirmation—if it re-enters Overbought territory and holds above 77.81, higher targets become more likely.
🛒 The previous spot-buy triggers I gave were at 87,700 and 91,900. If you entered with those, I recommend holding for now and waiting for signs of a trend change before taking profits.
🔔 If you didn’t buy earlier, I can’t provide a new entry just yet—we need to wait for a new structure and trigger to form.
🔽 For now, I still see the trend as bullish. A bearish scenario would require a fakeout below 106,250—if price drops and forms a lower high and lower low, the uptrend would be over and a downtrend would begin.
⏳ 4-Hour Timeframe
After breaking 106,250, price rallied to 111,826 and is now pulling back to 106,250.
✔️ RSI is holding above its local support at 44.48, and as long as it stays above that level, market momentum remains bullish.
📈 You can consider entering a long on a pullback to 106,250. A breakout above 111,826 would be the main trigger for a new long.
🔑 Right now, there’s no valid reason to short, so it’s best to wait for a clear bearish structure before considering that.
👑 Bitcoin Dominance (BTC.D)
📅 Weekly Timeframe
After several green weekly candles, BTC.D printed a large red candle, pulling back toward the midline of its ascending channel and rejecting from 64.77. However, it’s now moving back up again.
💥 With this strong momentum, there’s a good chance BTC.D could break out of the channel. If 64.77 breaks, we could see a push toward 71.04.
⚡️ To confirm a bearish reversal in BTC.D, we’d need to see a breakdown below the lower trendline of the channel. That would likely signal the start of an altseason.
📅 Daily Timeframe
BTC.D has been in an uptrend and even broke above its channel briefly. But after hitting 65.31, it started a correction and dropped to the midline at 62.22.
🎲 It quickly bounced from 62.22 and is now moving upward again. Given the bullish structure, it could retest the 65.31 high.
📈 If it forms a lower high and breaks below 62.22, that would confirm a trend reversal. A breakout above 65.31 would confirm continuation of the uptrend.
⏳ 4-Hour Timeframe
BTC.D rallied to 64.31 and is now trying to retest that level. If it breaks above 64.31, the next target is 65.41.
🧲 If it forms a lower high and breaks 63.51, we’d get a confirmation that the bullish leg has ended, increasing the chances of a move to 62.17.
✔️ Total2 (Altcoin Market Cap Excluding BTC)
📅 Weekly Timeframe
After breaking the curved trendline, Total2 fell to around 816B before bouncing alongside Bitcoin.
⚡️ Currently, it’s ranging between 1.15T and 1.26T for the past three weeks.
🧩 If price breaks this range, it could rally toward 1.61T, which is the most important supply zone for Total2. A breakout here would likely trigger a strong altcoin rally.
🛒 If that breakout coincides with a drop in BTC.D, it would be an excellent spot-buy opportunity for altcoins.
📊 If the current rally fails to reach 1.61T and forms a lower high, another drop toward 816B is likely. This time, the chance of breaking that support would be high—confirming a trend reversal.
📅 Daily Timeframe
Price is stuck in a range between 1.15T and 1.26T.
🔼 A breakout from either side would likely lead to a strong move. A break below 1.15T could extend the decline toward 861B, while a break above 1.26T would target 1.62T.
⏳ 4-Hour Timeframe
Same structure as the daily chart. Long trigger = 1.26T breakout. Short trigger = 1.15T breakdown.
🔑 If price forms a higher low and starts moving back up, the likelihood of breaking 1.26T increases. The next target would be 1.33T.
✔️ USDT Dominance (USDT.D)
📅 Weekly Timeframe
USDT.D is ranging between 3.78 and 6.22.
📉 It recently formed a lower high below 6.22 and broke below 5.06, now heading toward 3.78.
🤔 If USDT.D drops to 3.78, we could see a major market rally—Bitcoin might move toward 130,000 or 160,000.
🚀 If 3.78 breaks, the next support is at 2.53, which would mark the start of a major bull run.
📅 Daily Timeframe
USDT.D has hit support at 4.40 and is now approaching a descending trendline that’s been holding since the 6.22 top.
📈 If that trendline breaks, the trigger is at 4.70. A breakout here could lead to a move to 5.02.
🔽 If price gets rejected again, the short trigger is at 4.40, and the next support is at 3.81.
⏳ 4-Hour Timeframe
Support at 4.38 has held, and price is now above 4.50 and approaching the trendline.
🎲 If 4.50 fails and price drops to 4.40, a break below 4.40 confirms a bearish continuation.
📊 If the trendline breaks, use 4.74 as your confirmation trigger.
❌ Disclaimer ❌
Trading futures is highly risky and dangerous. If you're not an expert, these triggers may not be suitable for you. You should first learn risk and capital management. You can also use the educational content from this channel.
Finally, these triggers reflect my personal opinions on price action, and the market may move completely against this analysis. So, do your own research before opening any position.

The BIG swing play!Been tracking BTC on monthly with Andrews pitchfork. Seems to be right on track. Note the moving average with buy/sell arrows and color coded line. Buy arrow and green line along with a green pitchfork is a solid buy. That's triple conformation. Swing trading, for me at least, seems to be the best way to avoid market maker traps and outrageous trading fees. DCA also works out nice in the long run.
On a side note. Mr. Andrews was the original developer of the idea behind the pitchfork trend lines. This modified version with Fibonacci buy/sell fields is great but one has to give credit where credit is due! That's why I will always call it the Andrews Pitchfork.
March on Friends!

Bitcoin Be Setting Bull Trap?_Breakout Without High VolumeBitcoin ( BINANCE:BTCUSDT ) started to fall yesterday after forming a new All-Time High(ATH) with high volume , but started to rise again. One of the reasons for Bitcoin’s sudden drop yesterday was the sharp drop in the S&P 500 ( SP:SPX ) index .
First of all, I must say that Bitcoin’s situation is a bit complicated and difficult to analyze , so pay more attention to money management. Be prepared for any scenario.
Bitcoin is trading above the Resistance zone($109,588-$105,820) and near the Resistance lines and Cumulative Short Liquidation Leverage($113,020-$111,833) . What is worrying is that the break of the Resistance zone($109,588-$105,820) was NOT accompanied by high volume , suggesting a bull trap is possible .
I see a correction to at least Cumulative Long Liquidation Leverage($109,972-$108,609) given the low breakout volume for Bitcoin and the large sell orders in the upper prices for Bitcoin .
--------------------------------------------
Today, the Flash PMI data from the U.S . came in stronger than expected:
Flash Manufacturing PMI: 52.3 (vs. forecast 49.9, previous 50.2)
Flash Services PMI: 52.3 (vs. forecast 51.0, previous 50.8)
Analysis :
Both numbers exceeded expectations, signaling stronger economic activity in the U.S. This is bullish for the USD( TVC:DXY ) and could put short-term downward pressure on Bitcoin, as it lowers the chances of near-term Fed rate cuts.
--------------------------------------------
Do you think Bitcoin is completing a Bull Trap or should we expect Bitcoin to increase further?
Note: If Bitcoin breaks above $114,500 with high momentum, we can expect Bitcoin to rise to near $119,000.
Please respect each other's ideas and express them politely if you agree or disagree.
Bitcoin Analyze (BTCUSDT), 1-hour time frame.
Be sure to follow the updated ideas.
Do not forget to put a Stop loss for your positions (For every position you want to open).
Please follow your strategy and updates; this is just my Idea, and I will gladly see your ideas in this post.
Please do not forget the ✅' like '✅ button 🙏😊 & Share it with your friends; thanks, and Trade safe.

BTC BULLISH SETUPBTCUSDT is looking for a reversal and to take the bullish trend extended towards the FVG formed on top. Under the lower timeframes we have a valid reversal indication identified.

BITCOIN - Price will continue to grow inside rising channelHi guys, this is my overview for BTCUSDT, feel free to check it and write your feedback in comments👊
Price started to grow inside rising channel, where it declined to support line and then bounced up to $93100 level.
BTC broke this level at once and then some time traded near, after which bounced and continued to grow.
Soon BTC made a correction, but quickly turned around and later rose to $104900 level, after which started to decline.
After price fell a little, it made an upward impulse to resistance line of channel, breaking $104900 level.
But not long time ago, BTC bounced from this line and started to decline, so I think that price can continue to fall.
Also, I expect that price will fall to support area and then turn around and continue to grow in channel to $113700
If this post is useful to you, you can support me with like/boost and advice in comments❤️

BTC - LOOSING STEAM BTC HAS BROKEN 2 TREND CHANNELS, RED , YELLOW. AND BADLY DAMAGED THE PRIMARY, BLUE.
Its taking out support after support on 1st touch.
If BTC penetrates again thru blue, BTC will begin a larger correction.
BTC must stop falling at $105,600 - $105,000.
The downside target is not yet defined.

BITCOIN SENDS CLEAR BEARISH SIGNALS|SHORT
BITCOIN SIGNAL
Trade Direction: short
Entry Level: 108,794.06
Target Level: 97,384.13
Stop Loss: 116,400.68
RISK PROFILE
Risk level: medium
Suggested risk: 1%
Timeframe: 1D
Disclosure: I am part of Trade Nation's Influencer program and receive a monthly fee for using their TradingView charts in my analysis.
✅LIKE AND COMMENT MY IDEAS✅

Bitcoin Closes Red! Is The Bull Market Over?The end of the bull market and the start of a strong bearish cycle is now confirmed? That's the question that I received from one of my new followers based on much news all across the Cryptocurrency market.
How far down is Bitcoin going in this long-term, very strong, hard and surely-highly confirmed marketwide ultra-bearish correction? None.
I have news good for you, there is no correction, Bitcoin closed one day red. Yesterday's candle produced a 4.4% drop right after Bitcoin hit $112,000, a new All-Time High.
The truth is that Bitcoin just hit a new All-Time High and this reinforces the bullish bias for this Cryptocurrency market, it bolster the Altcoins market; Everything is set to continue growing.
What does $500,000,000 in liquidations, a new ATH and a 4% drop have in common?
Over-leveraged traders.
These are the only losers right now. In order to be liquidated after such a very small move it means that you were trading with more than 15X. That's it. The rest of the market is solid, everything else is strong and there is no need to fear; remember, retraces and corrections and an opportunity to buy-in, rebuy and reload.
Just wanted to tell you that all is well, the rise is not over, this is just a minor pause. Look back to late April, early May, mid-May and so on, the market can and does produces red days, it never moves straight down but neither straight up.
A new bear market now? FALSE.
Bitcoin will continue growing long-term. The Altcoins are on the same train.
A retrace can last a few days just as it can last a few weeks.
A correction can last a few weeks just as it can last a few months.
A bull market can go on for years, and we are in bull market territory now, so be ready and prepared for additional growth. Bitcoin is going up!
Rest easy and hold strong.
Continue to buy and accumulate the Altcoins.
This is not the end, it is only the start.
Namaste.

$BTC to Retest .786 Fib Next ~$102k - BTFD!timberrrrr
the crypto gods shall giveth one last chance.
buy the fckn dip!!!

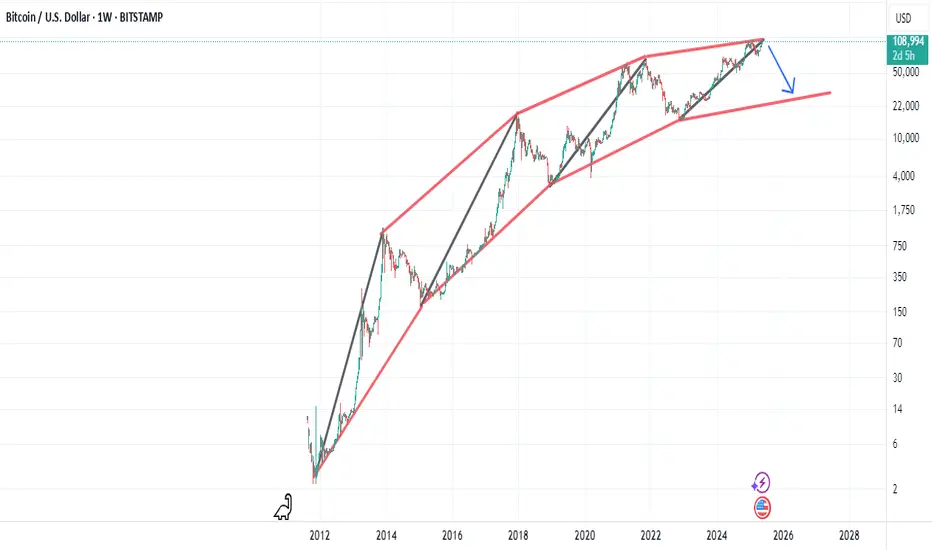
BITCOIN can aim as high as $300k on this CycleBitcoin / BTCUSD is trading inside a Channel Up since the December 2017 High.
This pattern is running through 2 Cycles already and technically is targeting for the top of the Channel Up.
A new +2119% rise until the top, can exceed $300k.
Follow us, like the idea and leave a comment below!!

Bitcoin: Bullish Flag Breakout Targeting $114K Zonehello guys!
Bitcoin has been riding nicely inside an ascending channel, and it just broke out of a clean bullish flag on the 4H chart (classic continuation setup).
The move looks strong, and the target for this flag breakout sits around the $114,000–$115,000 zone (gray area). There’s a chance BTC pushes straight into that target if momentum holds, but we should also be ready for a possible pullback to the channel’s lower trendline before the next leg up.
That lower boundary would be a spot to watch for bullish reactions if the market cools off short term.
What I see:
Pattern: Bullish Flag within Ascending Channel
Breakout Confirmed: Strong momentum after flag breakout
Target Zone: $114,000–$115,000
Scenarios:
Direct move to target
Retest of channel support (~$106,000–$107,000) before continuation
Invalidation: A Break below the channel support would invalidate the bullish setup

BITCOIN Will Keep Growing! Buy!
Hello,Traders!
BITCOIN is trading in an
Uptrend and the coin made a
Great breakout of the previous
ATH which makes us super
Bullish biased so as BTC is
Making a local bearish correction
We will be expecting a bullish
Rebound from the rising support
And a further bullish move up
Buy!
Comment and subscribe to help us grow!
Check out other forecasts below too!
Disclosure: I am part of Trade Nation's Influencer program and receive a monthly fee for using their TradingView charts in my analysis.

Bitcoin has the potential to return to $30,000A simple idea:
The Bitcoin price trend has clearly weakened, as you can see in the image above, the upward waves are getting weaker (the angle of the blue lines is getting smaller).
The price is moving in a curved channel and has the potential to reach $30,000.
BTCUSD: 1D Golden Cross signals more upside to 155k.Bitcoin dropped below the overbought barrier on its 1D technical outlook (RSI = 69.592, MACD = 4447.700, ADX = 32.855) following today's Trump led pullback. On the long term though, this is nothing but a technical reaction to fundamentals and not enough to invalidate the bullish trend as not only did we make new ATH this week but also just completed a 1D Golden Cross. This is the first such pattern since October 27th 2024, which validated the previous bullish wave that peaked on the 2.0 Fibonacci extension. According to that, Bitcoin should extend the current uptrend with TP = 155,000.
## If you like our free content follow our profile to get more daily ideas. ##
## Comments and likes are greatly appreciated. ##

DOGE/USDT Potential UpsidesHey Traders, in today's trading session we are monitoring DOGE/USDT for a buying opportunity around 0.22000 zone, DOGE/USDT is trading in an ascending channel and currently is in a correction phase in which it is approaching the ascending channel support.
Trade safe, Joe.

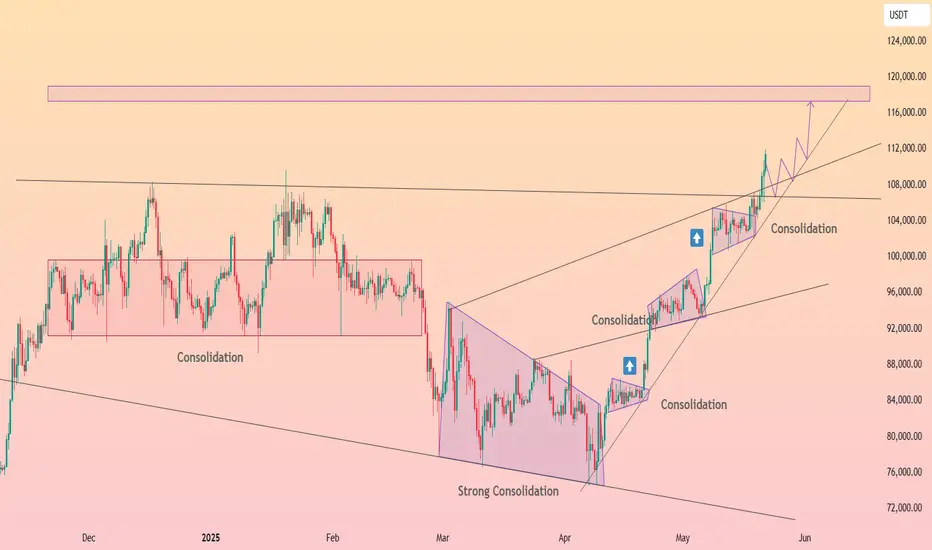
HelenP. I Bitcoin may continue to grow inside upward channelHi folks today I'm prepared for you Bitcoin analytics. In this chart, we can see how the price has been steadily moving within a well-defined upward channel, respecting its trend structure with clean rebounds from the lower boundary. The price has shown signs of a minor pullback after reaching the upper part of the consolidation range. However, it remains well-supported above the 102700 - 104700 zone, which aligns closely with both the trend line and a previous accumulation area. This confluence strengthens the case for a bullish continuation. Given the consistently higher lows, strong reaction from buyers near the channel support, and the overall bullish momentum, I believe this correction will be short-lived. The market appears to be gathering liquidity before attempting another leg upward. If the current structure holds, BTCUSDT is likely to continue climbing along the lower edge of the channel, gradually pushing toward the next significant target. My current goal remains at 117000 points, a level that aligns with the channel’s upper resistance and reflects the natural extension of the ongoing bullish movement. If you like my analytics you may support me with your like/comment ❤️

HolderStat┆BTCUSD has reached a new peakCRYPTOCAP:BTC has stair-stepped from 75 k to 110 k inside a steeply guided channel, carving neat consolidation bricks at every leg. A fresh box rests over 102 k support; defend that and the rising wedge projects toward the long-watched 118-120 k new-ATH zone. Break the inner rail and a glide to 96-97 k tests the mid-channel without derailing the dominant ascent.
$MSTR quick phone idea for 5/23; Short 0DTEThis name seems to have lost steam. I’m all for Saylor and what he believes in but currently this feels set up for a nasty short. Strategy has had numerous monster days to the downside and upside. This thing had a $150 intraday swing off its $550 high. Tomorrow, 5/23, I am going to enter a possible 5-7% short that expires 5/23. Just a quick idea here as I can’t post charts from phone into minds section. Check you guys tomorrow and I’ll be sure to update this. $375, $380, $385.
