TradeCityPro | Bitcoin Daily Analysis #106👋 Welcome to TradeCity Pro!
Let’s dive into Bitcoin and the key crypto indices. As usual, I’ll be reviewing the futures triggers for the New York session.
⏳ 1-Hour Timeframe
On the 1-hour chart, the 105800 trigger was activated yesterday and Bitcoin’s trendline was broken. However, the price failed to hold above 105800 and quickly fell back below, making it a fake breakout.
⚡️ For now, I’m keeping the 105800 level as the long trigger to observe how the price reacts. We need to wait for a clear reaction to this zone to better refine the trendline. On the next test, if it breaks successfully, we can enter a long position.
🔍 If a higher low forms above 103899 and the RSI finds support above 50, the likelihood of breaking the 105800 resistance increases, potentially leading to a stronger upward move.
✨ On the short side, since the 105800 breakout failed, bearish momentum could increase. A breakdown below 103899 would trigger a short position with a target at 10750.
If you’ve already opened a short position before this trigger, be aware that it's a risky trade and shouldn’t be relied on as a long-term position.
👑 BTC.D Analysis
The downtrend in Bitcoin dominance has continued following the breakdown of 64.29, and now it has also broken below 64.15, heading toward 63.87.
⭐ For now, BTC dominance is temporarily bearish. If the market corrects, Bitcoin might fall harder, but if the market recovers, altcoins could perform better — unless BTC dominance reverses trend.
📅 Total2 Analysis
Yesterday, the long trigger at 1.16 was activated, and now the index has reached 1.18. Thanks to falling Bitcoin dominance, altcoins have outperformed Bitcoin.
✔️ If 1.18 breaks, the uptrend could continue. Key levels to watch next are 1.21 and 1.24.
📅 USDT.D Analysis
This index formed a lower high below 4.79 yesterday and is now retesting 4.70 after breaking below it.
🎲 If this pullback gets rejected, it confirms weakness in USDT dominance — which supports long positions on altcoins. However, if USDT.D climbs back above 4.70 and it turns into a fake breakdown, there’s a strong chance it could revisit 4.79 or even break that resistance.
❌ Disclaimer ❌
Trading futures is highly risky and dangerous. If you're not an expert, these triggers may not be suitable for you. You should first learn risk and capital management. You can also use the educational content from this channel.
Finally, these triggers reflect my personal opinions on price action, and the market may move completely against this analysis. So, do your own research before opening any position.
Bitcoin (Cryptocurrency)

Bitcoin may break support level and continue to fall in channelHello traders, I want share with you my opinion about Bitcoin. Previously, price was moving inside a horizontal range, consolidating between resistance and the buyer zone near 103500 - 102900. The market lacked clear direction, and price repeatedly rebounded within this structure, failing to build strong momentum either way. Eventually, BTC exited the range and began forming a downward channel. This shift introduced a clear bearish bias, with each high being lower than the previous one. Price action started respecting the descending resistance and support lines, confirming the structure. Sellers consistently stepped in from the seller zone near 109000 - 109500, pushing the price downward with each retest. Currently, BTC is hovering around the support level at 103500 points, showing short-term weakness. The latest reaction from this area didn’t generate significant bullish follow-through. In my view, BTC is likely to break through this support and continue falling inside the channel. That’s why I’ve placed my TP at 100600 points, which matches the support line of the channel and offers a logical downside target. Please share this idea with your friends and click Boost 🚀

BTC - High Level Analysis (monthly)High level analysis of BITCOIN for the next few days, weeks or months

Technical Analysis: Worldcoin (WLD/USDT) + TRADE PLANTechnical Analysis: Worldcoin (WLD/USDT)
Chart Overview
Pattern: A falling wedge formation is clearly visible, typically a bullish reversal pattern.
Potential Breakout: The price has broken above the upper wedge resistance line, indicating a potential bullish breakout.
Key Levels:
Resistance Zones:
$1.26 (SMA50)
$1.55–$1.65 (major supply zone)
$1.80–$1.90 (final resistance target)
Support Zones:
$1.18 (local support)
$1.00–$1.10 (strong green demand zone)
$0.90 (final downside support)
Indicators & Oscillators
Volume
Volume shows moderate rising interest during breakout—confirmation would be stronger with larger volume spikes.
VMC Cipher B
Momentum waves and money flow are turning bullish.
Green dots at the bottom suggest bullish divergence and likely upward momentum.
RSI (14)
Currently at 52.77, crossing above 50—a bullish signal.
Not yet overbought, so there's room to move upward.
Money Flow Index (MFI)
Reading at 63, indicating strong inflows and increased buying pressure.
Stochastic RSI
Bullish crossover, currently at 66.78/75.27, heading upward—supports the breakout scenario.
Trading Plan
Scenario A: Bullish Breakout Confirmation
Trigger: Close above $1.20–$1.22 with rising volume and continued RSI/MFI strength.
Buy Zone (Spot 1): $1.18–$1.22
Buy Zone (Spot 2): On pullback to wedge breakout line ($1.15–$1.17)
Targets:
TP1: $1.26 (SMA50)
TP2: $1.55–$1.60 (supply zone)
TP3: $1.80 (long-term resistance)
Stop Loss: Below $1.10 (to invalidate breakout)
Risk-Reward Ratio: Minimum 1:2 for TP1, up to 1:4–1:5 for TP3
Scenario B: Failed Breakout / Bearish Rejection
Trigger: Rejection at $1.20–$1.26 and fall below $1.15 with increasing sell volume.
Short Entry (only for experienced traders): Under $1.15
Targets:
TP1: $1.05 (mid-demand zone)
TP2: $0.95–$1.00 (major demand zone)
Stop Loss: Above $1.22
Note: Prefer to stay out if volume is low—wait for clearer structure.
Risk Management & Strategy Notes
Use position sizing: No more than 3–5% of capital per trade.
Be patient—wait for candle close confirmations.
If the price consolidates near $1.20 and volume increases, a strong upward move is likely.
Avoid emotional trading—react to price action, not assumptions.
Worldcoin (WLD/USDT) is showing strong bullish potential with a confirmed breakout from a falling wedge. Indicators support upward momentum, and the structure favors a move toward the $1.50–$1.80 range. Monitor volume and key support levels to manage risk and confirm trend continuation.

BTCUSDT – Ready for the next downward move🚀 Trade Setup Details:
🕯 #BTC/USDT 🔽 Sell | Short 🔽
⌛️ TimeFrame: 15m
--------------------
🛡 Risk Management:
🛡 If Your Account Balance: $1000
🛡 If Your Loss-Limit: 1%
🛡 Then Your Signal Margin: $1369.86
--------------------
☄️ En1: 104838.38 (Amount: $136.99)
☄️ En2: 105096.3 (Amount: $479.45)
☄️ En3: 105280.29 (Amount: $616.44)
☄️ En4: 105464.61 (Amount: $136.99)
--------------------
☄️ If All Entries Are Activated, Then:
☄️ Average.En: 105190.14 ($1369.86)
--------------------
☑️ TP1: 104215.87 (+0.93%) (RR:1.27)
☑️ TP2: 103752.49 (+1.37%) (RR:1.88)
☑️ TP3: 103166.5 (+1.92%) (RR:2.63)
☑️ TP4: 102425.86 (+2.63%) (RR:3.6)
☑️ TP5: 101614.34 (+3.4%) (RR:4.66)
--------------------
❌ SL: 105957.69 (-0.73%) (-$10)
--------------------
💯 Maximum.Lev: 75X
⌛️ Trading Type: Swing Trading
‼️ Signal Risk: ⚠️ High-Risk! ⚠️
🔎 Technical Analysis Breakdown:
This technical analysis is based on Price Action, Elliott waves, SMC (Smart Money Concepts), and ICT (Inner Circle Trader) concepts. All entry points, Target Points, and Stop Losses are calculated using professional mathematical formulas. As a result, you can have an optimal trade setup based on great risk management.
⚠️ Disclaimer:
Trading involves significant risk, and past performance does not guarantee future results. This analysis is for informational purposes only and should not be considered financial advice. Always conduct your research and trade responsibly.
💡 Stay Updated:
Like this technical analysis? Follow me for more in-depth insights, technical setups, and market updates. Let's trade smarter together!

Bitcoin H4 | Potential bullish reversal?Bitcoin (BTC/USD) is falling towards a multi-swing-low support and could potentially bounce off this level to climb higher.
Buy entry is at 103,881.70 which is a multi-swing-low support that aligns close to the 23.6% Fibonacci retracement.
Stop loss is at 100,000.00 which is a level that lies underneath a multi-swing-low support.
Take profit is at 108,960.50 which is an overlap resistance that aligns with the 61.8% Fibonacci retracement.
High Risk Investment Warning
Trading Forex/CFDs on margin carries a high level of risk and may not be suitable for all investors. Leverage can work against you.
Stratos Markets Limited (tradu.com ):
CFDs are complex instruments and come with a high risk of losing money rapidly due to leverage. 63% of retail investor accounts lose money when trading CFDs with this provider. You should consider whether you understand how CFDs work and whether you can afford to take the high risk of losing your money.
Stratos Europe Ltd (tradu.com ):
CFDs are complex instruments and come with a high risk of losing money rapidly due to leverage. 63% of retail investor accounts lose money when trading CFDs with this provider. You should consider whether you understand how CFDs work and whether you can afford to take the high risk of losing your money.
Stratos Global LLC (tradu.com ):
Losses can exceed deposits.
Please be advised that the information presented on TradingView is provided to Tradu (‘Company’, ‘we’) by a third-party provider (‘TFA Global Pte Ltd’). Please be reminded that you are solely responsible for the trading decisions on your account. There is a very high degree of risk involved in trading. Any information and/or content is intended entirely for research, educational and informational purposes only and does not constitute investment or consultation advice or investment strategy. The information is not tailored to the investment needs of any specific person and therefore does not involve a consideration of any of the investment objectives, financial situation or needs of any viewer that may receive it. Kindly also note that past performance is not a reliable indicator of future results. Actual results may differ materially from those anticipated in forward-looking or past performance statements. We assume no liability as to the accuracy or completeness of any of the information and/or content provided herein and the Company cannot be held responsible for any omission, mistake nor for any loss or damage including without limitation to any loss of profit which may arise from reliance on any information supplied by TFA Global Pte Ltd.
The speaker(s) is neither an employee, agent nor representative of Tradu and is therefore acting independently. The opinions given are their own, constitute general market commentary, and do not constitute the opinion or advice of Tradu or any form of personal or investment advice. Tradu neither endorses nor guarantees offerings of third-party speakers, nor is Tradu responsible for the content, veracity or opinions of third-party speakers, presenters or participants.

Critical Support Test for Bitcoin: 100K Holding or Breaking? Dear Traders,
Bitcoin's previous support level of 106,000.00 has now been broken, turning it into a resistance point.
At this moment, Bitcoin is at a critical stage, and the most important support level is 100,000.00.
In this zone, rather than opening a position, it is wiser to observe carefully.
If the 100,000.00 support level breaks, I will provide you with a downward target.
If Bitcoin holds at this level and finds support, I will share an upward target.
Right now, Bitcoin is choosing its direction. Will the whales push the price up with their purchases, or drive it down with their sales? We have to watch patiently, like a hunter, to see how this unfolds.👀
Each and every one of you is incredibly valuable to me! I am always working hard to bring you the most accurate and insightful analysis.
A huge thank you to everyone who supports my work by leaving likes.🙏

Bitcoin: $333,333 New ATH? The Bears Are Gone!Let's start with a question: How can Bitcoin be bearish while trading above $100,000? Please answer. How is that even possible?
How can Bitcoin be bearish when the price is $105,000+ at any point in time. How? It makes absolutely no sense. Think about it.
What is it that defines Bitcoin as either bearish or bullish? It's price.
What is Bitcoin's current price?
If you were ready to sell Bitcoin at $105,000 does that mean that the bull market is over for Bitcoin? Or does it mean that you expect for Bitcoin to recover after a correction or retrace?
If it is going to recover, then how long would such an imagined correction last?
How far down would that correction go?
You know the problem with answering all those questions don't you?
The problem is that they are all in your head, based on imagination, because Bitcoin is not going down instead it has been going up now for almost two months. Straight up.
The fact that Bitcoin remains trading above 100K, safely, opens the doors for 200K. 200K means 100% growth left in the coming months and this is guaranteed based on the state of the altcoins market. We are all one.
Before you give up on Bitcoin remember the easiest of all cycles, the halving. Bull market year happens the year after the halving. Bitcoin's block reward is cut in half. Less Bitcoins, increasing demand = higher price.
It is going up. There is still so much room left for growth that you would be surprised to know, this is only the start.
Bitcoin might be preparing for the bull market of its life, 10 years growing straight up non-stop.
There is no bear-market. There is no correction. There is no retrace, there is no pause.
The data is already in, the bears are gone.
Namaste.

Bitcoin Turns Bullish, What To Expect—$200,000 New All-Time HighWe have good news here. Bitcoin continues trading above $100,000-$102,000, in fact, this range hasn't been tested as support so far and this is a bullish development. Not moving below 100K can lead to a new all-time high in the coming months.
What to expect short-term.
The action is bullish now and we see some rising volume. Very little volume but still rising with two green candles. We have multiple levels to consider.
1) The $106,000-$107,000 price range. This is the zone labeled "local resistance" on the chart. If Bitcoin manages to move and close above this level on a daily basis, we can say the bulls are back in. While Bitcoin trades below this level, market conditions remain bearish and you can expect lower prices. Right now it is still bearish.
2) Once this local resistance is broken the next resistance to consider sits around $110,000. As soon as Bitcoin breaks this level it is hyper-bullish and we can aim for 200K.
Let's visit the all-time high potential in late 2025.
» If Bitcoin crashes below 100K and reaches the low 90Ks or lower, then the 200K target for a new ath later this year becomes less likely.
» If Bitcoin never moves below 100K then 200K becomes a high probability target, makes sense?
Right now conditions are still bearish because Bitcoin trades below "local resistance." The small green candles are not enough and it is still too early to say. Market conditions remain the same.
A good scenario would be consolidation, sideways, before additional growth. This would produce the best possible conditions for the altcoins market to thrive and grow.
Namaste.

Bitcoin (BTCUSDT) - Price Testing 26EMA and 12EMA - Daily ChartBitcoin (BTCUSDT) price is currently testing the 26EMA and 12EMA price levels on the Daily chart.
Bitcoin price has been in a medium-term uptrend since April and May 2025.
However, a short-term downtrend pullback has occurred and the price recently bounced up from the 26EMA zone ($104,000).
A morning star candle price pattern printed above the 26 EMA support line.
Large buyer volume could confirm the price candle pattern and Bitcoin price could rally up above 12EMA resistance ($106,000).
If price continues to reject and fall below $106,000 the downtrend would likely continue into June 2025.
Breaking news and stock market correlations could affect the price of Bitcoin and cryptocurrencies.
Tariff news and trade deals are supposed to occur throughout June and July 2025.

Explanation of indicators indicating high points
Hello, traders.
If you "Follow", you can always get new information quickly.
Have a nice day today.
-------------------------------------
(BTCUSDT 1D chart)
If it falls below the finger point indicated by the OBV indicator, it can be interpreted that the channel consisting of the High Line ~ Low Line is likely to turn into a downward channel.
And, if it falls to the point indicated by the arrow, it is expected that the channel consisting of the High Line ~ Low Line will turn into a downward channel.
Therefore, if it is maintained above the point indicated by the finger, I think it is likely to show a movement to rise above the High Line.
In this situation, the price is located near the M-Signal indicator on the 1D chart, so its importance increases.
To say that it has turned into a short-term uptrend, the price must be maintained above the M-Signal indicator on the 1D chart.
In that sense, the 106133.74 point is an important support and resistance point.
(1W chart)
The HA-High indicator is showing signs of being created at the 99705.62 point.
The fact that the HA-High indicator has been created means that it has fallen from the high point range.
However, since the HA-High indicator receives the value of the Heikin-Ashi chart, it indicates the middle point.
In other words, the value of Heikin-Ashi's Close = (Open + High + Low + Close) / 4 is received.
Since the HA-High indicator has not been created yet, we will be able to know for sure whether it has been created next week.
In any case, it seems to be about to be created, and if it maintains the downward candle, the HA-High indicator will eventually be created anew.
Therefore, I think it is important to be able to maintain the price by rising above the right Fibonacci ratio 2 (106178.85).
Indicators that indicate high points include DOM (60), StochRSI 80, OBV High, and HA-High indicators.
Indicators that indicate these high points are likely to eventually play the role of resistance points.
Therefore,
1st high point range: 104463.99-104984.57
2nd high point range: 99705.62-100732.01
You should consider a response plan depending on whether there is support near the 1st and 2nd above.
The basic trading strategy is to buy at the HA-Low indicator and sell at the HA-High indicator.
However, if it is supported and rises in the HA-High indicator, it is likely to show a stepwise rise, and if it is resisted and falls in the HA-Low indicator, it is likely to show a stepwise decline.
Therefore, the basic trading method should utilize the split trading method.
Other indicators besides the HA-Low and HA-High indicators are auxiliary indicators.
Therefore, the trading strategy in the big picture should be created around the HA-Low and HA-High indicators, and the detailed response strategy can be carried out by referring to other indicators according to the price movement.
In that sense, if we interpret the current chart, it should be interpreted that it is likely to show a stepwise rise since it has risen above the HA-High indicator.
However, you can choose whether to respond depending on whether there is support from other indicators that indicate the high point.
On the other hand, indicators that indicate the low point include the DOM (-60), StochRSI 20, OBV Low, and HA-Low indicators.
These indicators pointing to lows are likely to eventually serve as support points.
I will explain this again when the point pointing to the lows has fallen.
-
Thank you for reading to the end.
I hope you have a successful trade.
--------------------------------------------------
- Here is an explanation of the big picture.
(3-year bull market, 1-year bear market pattern)
I will explain the details again when the bear market starts.
------------------------------------------------------

BTC Scalping / Intraday Signal – Entry, Stop & Target Ready!🕒 Timeframe: 15min / 5min
⚠️ Note: Manage your risk — intraday volatility is high.
This is a short-term opportunity, not a long hold.
Disclaimer: This is our personal analysis and not financial advice. Always do your own research before making any investment decisions.
💬 What’s your take on this? Drop your thoughts in the comments and feel free to share this with your friends! ❤️

BTCUSD: Neutral but long term still intact.Bitcoin has turned neutral on its 1D technical outlook (RSI = 50.968, MACD = 1795.700, ADX = 23.670) a direct consequence of last week's correction. That correction is though just a pullback on the 1W timeframe, which is more bullish than ever as it's coming off a May 1W MACD Bullish Cross. Since the 1W MA50 supported April's bottom and produced the current rebound (even ATH has been made) that also respected the powerful P1 trendline, this is a bullish wave similar to all prior since the late 2022 Bear Cycle bottom. As all 3 rallied by +100%, we can stay bullish aiming for 150,000 towards the end of the year.
## If you like our free content follow our profile to get more daily ideas. ##
## Comments and likes are greatly appreciated. ##

Bitcoin Bullish Bias Becomes Stronger —New All-Time High EasyWith every day that passes and Bitcoin doesn't move below 100K the bullish bias becomes stronger. It is a death sentence for the bears. Bitcoin can't never move lower as long as the $100-$102,000 mega support barrier continues intact. And it hasn't been tested yet.
Good afternoon my fellow Cryptocurrency genius, how are you feeling today?
The market gives, the market also takes.
When looking at Bitcoin with a short-term mindset, everything is possible, it is hard to predict what will happen next but, when we focus on the actual price action, no doubt remains. Let me explain.
It doesn't matter if a candle is big or small...
It doesn't matter if Michael Saylor and the ETFs are buying or selling Bitcoin, what matters most is resistance and support.
Bitcoin's strong long-term mega-support remains intact and that is $102,000. Bitcoin is hyper-bullish above $100,000 and this is obvious. We are near the all-time high and the closer the action happens to resistance, the stronger the market. As Bitcoin moves sideways, consolidation, the altcoins will grow.
The altcoins cannot grow if Bitcoin is going to crash and yet the altcoins are starting to recover and some are looking great. I will continue to share more and the more I share the more convinced you will become that the next major move is up. We are set to experience growth long-term.
Aim higher, we are now-already in the 2025 bull market.
Never short Bitcoin within a bull market.
Namaste.

BTC Enters Price Discovery Above $110K—A New Bull Cycle BeginsHistoric Breakout:
Bitcoin has officially entered uncharted territory, breaking decisively above the previous all-time high of $108,364 to surge past $110,000. This isn’t just psychological — it's a clear technical confirmation that the corrective phase is over and a new bullish cycle is underway.
Momentum Without Pause:
The impressive rally has unfolded with minimal pullbacks, a sign of:
Strong institutional accumulation
Growing retail FOMO
This sustained buying pressure suggests we’re witnessing more than a short-term rally — this could be the start of a parabolic move.
Risk Management & Key Support:
Even with minor pullbacks, the technical picture remains bullish.
The $102,000–$106,000 zone (previous resistance) is now key support
This area offers a strategic entry point for those waiting to buy the dip
Price Discovery Mode:
Now in true price discovery, Bitcoin faces no historical resistance overhead. The path of least resistance remains upward, with potential for explosive gains as we move into the summer months.
🚀 Next stop? Price targets in the $130K+ zone may soon come into focus.
#Bitcoin #BTC #AllTimeHigh #CryptoBreakout #PriceDiscovery #BullRun #CryptoMarket #TechnicalAnalysis #BitcoinToTheMoon

Bitcoin Reverses from Resistance, Eyes $100K SupportBitcoin's rally stalled at the $108,500 resistance level, with prices now pulling back and breaking below the steep uptrend line. The MACD is crossing lower and RSI is falling toward neutral, indicating momentum may be shifting. With the 50-day moving average near $94,400 and horizontal support around $100,000, traders may look for signs of stabilization in that zone before reassessing trend continuation.
-MW

BTC: Slowing DownBitcoin managed to stabilize over the weekend after its recent slide, nudging slightly higher from local lows. We continue to expect the current rebound—interpreted as wave B—to stretch into the blue Target Zone between $117,553 and $130,891. Once that move tops out, the next leg lower should follow, with wave C driving the price into the lower blue zone between $62,395 and $51,323. That would likely complete wave a in orange and pave the way for a temporary recovery before wave b rolls over into the final drop of wave (ii). The alternative scenario, which we’re still assigning a 30% probability, assumes Bitcoin is already in wave alt.(i) in blue—a more bullish path that would extend the rally well beyond $130,891 without another major correction first.
📈 Over 190 precise analyses, clear entry points, and defined Target Zones - that's what we do.

$BTC not finished yetHey!
I'm still me, just a quick rebranding honoring my father.
CRYPTOCAP:BTC cycle is far from over. Not saying we bottomed yet. I think prices bewteen 96 - 102k could be reached on the upcoming days.
Althought this bearish momentum, we should encounter a goooood support level which would lead us to a great short absortion. If price holds those levels this week (maybe next too) there is a high chance we will see a new leg above the ATH level.
Im long here. Stay tuned

Bitcoin Daily: It Will Go Lower, I Will Explain WhyIt is hard to make these predictions because there are so many different points of view, so many opinions. There is so much data available that one can easily become confused. We can write an entire book about Bitcoin's next move and still not know what will happen next. I will keep it simple and straight forward and you will be able to understand and appreciate how easy it is when we focus on the chart only. Bitcoin is breaking below 100K.
Bitcoin is already trading at support. The mid-May consolidation range. From this range Bitcoin produced an advance and hit a new all-time high. The all-time high is a triple-top when we take the highs from January 2025 and December 2024. The fact that the action happens below this level now is bearish and this range has been confirmed as resistance.
The market will look for strength and this simply means lower.
Since resistance has been confirmed after a 50% rise, it is normal to see a retrace, can be medium-sized to balance out the strong-long bullish wave. Bullish action was present between 7-April until 22-May, 45 days.
The current retrace can take only a few weeks, think about 15-21 June as a rough estimate but nothing more (can end much sooner).
If you are unprepared and don't have map of the bigger picture, this can become terrifying and even lead to poor decisions at some point. If you know that this is only a retrace and the market will continue growing after a test above 90K, you can rest easy or even take advantage of this situation.
Now, what Bitcoin does is not the entire market. In a bull market, when Bitcoin moves down, money flows to the Altcoins. When Bitcoin goes sideways, the Altcoins grow. So dynamics will be much, much different now compared to what you saw in 2024, 2023 and 2022. The way the market will behave it is basically new for most participants.
The conclusion is that all is good and the chart is pointing lower short-term. After a short-term retrace, we get additional growth. Simple isn't it? It is...
Thank you for reading.
Namaste.

TONCOIN Hits First Target with 27% Gain – More Upside Ahead?By examining the #TONCOIN chart on the 3-day timeframe, we can see that after the last analysis, the price successfully hit the $3.64 target and has gained a total of 27%. Following this rise, the price entered a corrective phase and is currently trading around $3.15. The analysis remains valid, and I still expect further upside from this cryptocurrency. The expected return is around 20% in the short term, 40% to 55% in the medium term, and 110% in the long term.
Please support me with your likes and comments to motivate me to share more analysis with you and share your opinion about the possible trend of this chart with me !
Best Regards , Arman Shaban

TradeCityPro | Bitcoin Daily Analysis #105👋 Welcome to TradeCity Pro!
Let’s dive into Bitcoin and key crypto indices. As usual, in this analysis, I’ll walk you through the triggers for the New York futures session.
⏳ 1-Hour Timeframe
On the 1-hour chart, as you can see, Bitcoin’s correction phase began after the breakdown of the 107010 level. Currently, after pulling back to the 105673 area, it seems ready to begin its next corrective leg.
✔️ One of the reasons Bitcoin has moved downward over the past few days is the escalation of war between Ukraine and Russia. As the conflict intensified, risk assets like Bitcoin dropped while safe-haven assets like gold surged.
🔍 Currently, price action is forming an expanding triangle and is trending downward. It was recently rejected from the triangle’s top and is now sitting on a key support at 103899.
💥 If 103899 breaks, a short position targeting 101750 could be triggered. Selling volume has increased significantly, confirming bearish momentum, so opening a short upon a break of 103899 appears logical. However, keep in mind that the primary market trend remains bullish, and there is a high probability that any short may hit stop-loss.
📈 For a long position, the first trigger would be a breakout above the triangle. In this case, breaking 105673 could justify entry. Key overhead resistances are located at 107010 and 110256.
👑 BTC.D Analysis
Looking at Bitcoin dominance, the metric continued its upward move to reach 64.67 and has since been rejected from that level.
⚡️ If the bullish move continues, the breakout above 64.67 would act as a bullish trigger. On the other hand, a breakdown below 64.29 would confirm a bearish shift.
📅 Total2 Analysis
Total2 is currently ranging between 1.13 and 1.16. A breakout from either side could serve as a trigger for a directional position.
📊 If 1.13 breaks, a short position could be considered. Conversely, breaking above 1.16 would signal a potential long.
📅 USDT.D Analysis
After breaking above 4.70, USDT dominance has been ranging between 4.70 and 4.79. It’s now heading back toward the 4.79 resistance.
🧩 If 4.79 is broken, the next bullish leg in dominance may begin. A drop back below 4.70 would bring the dominance back into its previous range and could lead to further downside toward 4.49.
❌ Disclaimer ❌
Trading futures is highly risky and dangerous. If you're not an expert, these triggers may not be suitable for you. You should first learn risk and capital management. You can also use the educational content from this channel.
Finally, these triggers reflect my personal opinions on price action, and the market may move completely against this analysis. So, do your own research before opening any position.

Does Bitcoin Keep You Up at Night?Just a meme I made this morning.
The Weekly All Time High Breakout has failed, twice, just like 2021...

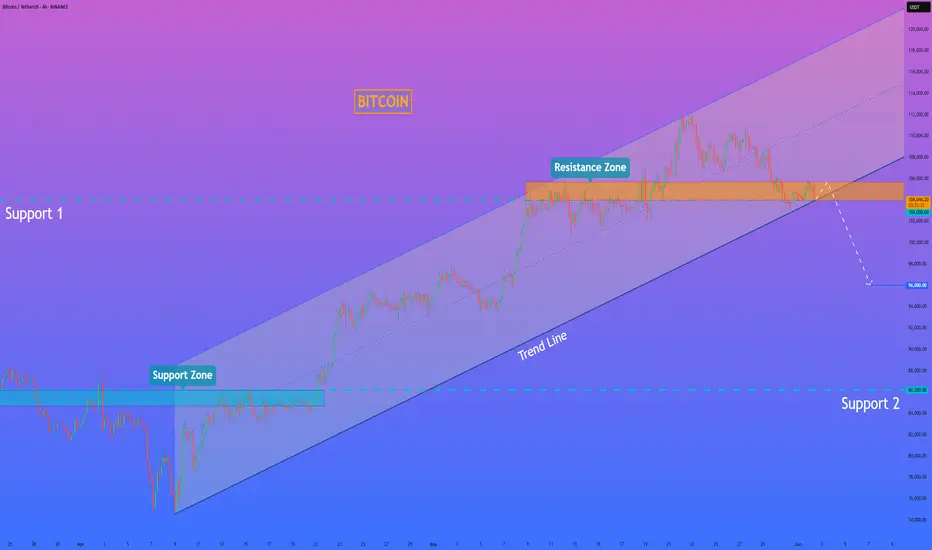
HelenP. I Bitcoin can exit break trend line and continue to fallHi folks today I'm prepared for you Bitcoin analytics. After looking at the chart, we can see how the price declined and broke support 2, which coincided with the support zone. Then the price rose to the support zone but turned around and dropped to the trend line. After this movement, BTC started to grow inside an upward channel, where it soon rose to support 2, which soon broke it and continued to move up. In the channel, price rose to support 1 and some time traded near this level. Later, BTC broke it and rose to the resistance line of the channel and turned around, and dropped to support 1. And at the moment, it traded inside the resistance zone, which coincided with the support level. So, I expect that BTCUSDT will break the support level, which coincides with the trend line, and continue to decline, thereby exiting from upward channel. That's why I set my goal at 96000 points. If you like my analytics you may support me with your like/comment ❤️