Bitcoin Mixed: Below Resistance, Above Support (Altcoins Update)I hope you are having a good Saturday and weekend my dear friend, I have a quick update on Bitcoin and the Altcoins market today. Good news and bad news.
Let's start with the good news.
The Altcoins are producing a higher low and bullish. This means that we will continue to see growth as expected. The market went through a shakeout, nothing more.
On the Bitcoin side, we have the bad news which is not that bad.
The action is happening above support (grey dashed line on the chart) but below local resistance. The market just went through a major shakeout. I shall explain.
People got greedy and ended up putting too much leverage on their positions, when this happens, the market needs to balance things out because it cannot grow in this way long-term. And thus the shakeout. 1 billion dollars worth of LONGs were liquidated.
The good news is that once this process is over, the market can resume with its usual cycle but...
The situation is tricky now but I can tell you exactly what will happen. Bitcoin will consolidate before additional growth. While Bitcoin consolidates, the Altcoins will move up. Plan and simple.
What happens next with Bitcoin, down or up?
As long as Bitcoin trades above $100,000-$102,000 weekly/monthly the chart and market bias is considered ultra-bullish . This means that Bitcoin is ultra-bullish right now.
If the action moves and closes weekly below 100K, nothing happens. A simple retrace that ends in a higher low followed by additional growth.
The market is bullish now and will continue bullish.
The Altcoins are a good buy and this recent flush gives an opportunity for those that missed early prices.
Market conditions remain the same. We are bullish and set to grow long-term.
We are 100% bullish on Bitcoin and the Altcoins market.
Namaste.
Bitcoin (Cryptocurrency)

Check support: Fibonacci ratio 1.902(101978.54) ~ 2(106178.85)
Hello, traders.
If you "Follow", you can always get the latest information quickly.
Have a nice day today.
-------------------------------------
(BTCUSDT 1M chart)
A new month begins.
The OBV indicator is currently rising again near the High Line.
We need to see if it can continue to rise by breaking above the High Line.
If not, there is a possibility of a decline near the Fibonacci ratio of 1.902 (101978.54) ~ 2 (106178.85).
If it declines with strong trading volume, there is a possibility of a decline near the StochRSI 20 point of 97209.25.
Therefore, we need to respond depending on whether there is support in the Fibonacci ratio of 1.902 (101978.54) ~ 2 (106178.85).
The most important support and resistance area on the current 1M chart is 69000-73499.86.
-
(1D chart)
It is showing a downward trend below the M-Signal indicator of the 1D chart.
Accordingly, the possibility of a short-term downtrend is increasing.
However, as mentioned earlier, the key is whether it can rise with support in the right Fibonacci ratio 1.902 (101978.54) ~ 2 (106178.85) section.
If not, it is likely to fall to around 97226.92.
-
The next volatility period is expected to be around June 6.
Accordingly, the current trend is likely to be maintained until the next volatility period.
In order to turn into an upward trend, the price must rise above the M-Signal indicator of the 1D chart and maintain it.
However, since the HA-High indicator is formed at the point of 108316.90, it is highly likely that the uptrend will begin only when it rises above this point.
Therefore, we need to check if it rises above 108316.90 and receives support.
-
In my chart, the basic trading strategy is to buy near the HA-Low indicator and sell near the HA-High indicator.
However, if it receives support from the HA-High indicator and rises, it is likely to show a stepwise uptrend, and if it receives resistance from the HA-Low indicator and falls, it is likely to show a stepwise downtrend.
The end of the stepwise uptrend is a downtrend, and the end of the stepwise downtrend is an uptrend.
Therefore, in order to establish a buying strategy, we need to meet the HA-Low indicator.
In other words, if the HA-Low indicator is newly created as the price falls, it is important to see whether there is support near it.
-
If it falls below the dotted line indicated on the OBV indicator, it will fall below the previous High Line, so there is a possibility that it will lead to an additional decline.
In particular, if it falls below the Low Line, the price is likely to fall.
However, since the channel of High Line ~ Low Line is still showing an upward trend, I think the overall movement is still maintaining an upward trend.
In order for the channel of High Line ~ Low Line to turn downward, it must fall to the area indicated by the arrow.
-
To summarize the above,
- Check for support in the right Fibonacci ratio 1.902(101978.54) ~ 2(106178.85) section
- The start of the uptrend is when the price rises above 108316.90 and maintains it
- Check for support near 97226.92 in the event of a further decline
- If the HA-Low indicator is newly generated in the event of a further decline, focus on finding the time to buy based on whether there is support near that area
-
Thank you for reading to the end.
I hope you have a successful trade.
--------------------------------------------------
- This is an explanation of the big picture.
(3-year bull market, 1-year bear market pattern)
I will explain more details when the bear market starts.
------------------------------------------------------

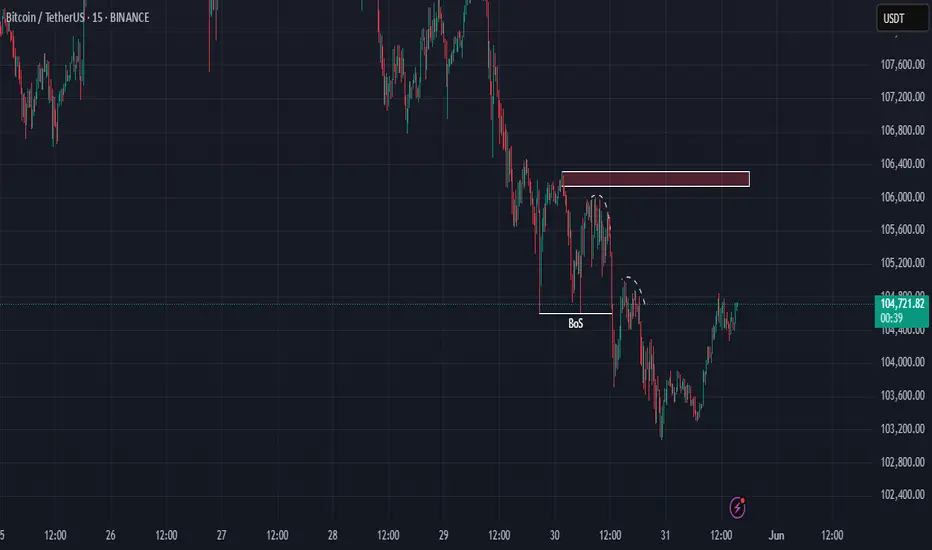
BTC/USDT: Correction to H1 Demand Zone? Multi-Timeframe Strategy🔹 H1 Context (Bullish):
- Demand zone (green) below Fib 0.5: Key support.
- Breakout (BOS) suggests bullish continuation *after possible correction*.
🔹 M5/M15 Situation (Short-Term):
- Price rejecting red zones (immediate resistance).
- Scenario 1 (Bearish):
→ If price respects red zones: Correction toward H1 demand ($103K).
→ Action: Short trades in M5/M15 targeting green zone.
- Scenario 2 (Bullish):
→ If red zones break: Confirmation of strength (new highs target).
🔹 Risk Management:
- Short entries: Rejection at M5/M15 red zones + M1 confirmation.
- TP: M15 lows ($103.5K) or H1 demand zone ($103K).
- SL: Close above red zones.
🔹 Technical Key:
- H2 Order Block as dynamic support: If respected, prevents drop to H1.
- Confluence: H1 demand + Fib 0.5 = High-probability area.
#BTC #Bitcoin #Trading #Crypto #H1 #M15 #TechnicalAnalysis #Fibonacci
Bitcoin is nearing a critical breakout zone at $86,000Bitcoin is nearing a critical breakout zone at $86,000.
If this level breaks with strong momentum, we could see a rapid bullish continuation toward the major resistance area around $105,000. The ascending channel remains intact, and aggressive buying near support points to a strong upside setup.
From a fundamental view, Bitcoin is gaining strength as global uncertainty rises. The latest escalation of trade tariffs has disrupted traditional markets, pushing more investors toward alternative assets like Bitcoin. Historically, Bitcoin has performed strongly during times of economic instability.
Tightening monetary policies worldwide are fueling recession fears, making Bitcoin even more attractive as a hedge — the new "digital gold." With institutional interest growing, Bitcoin is well-positioned for a significant capital inflow.
Stay ready — the next big move is close! 🚀

MOONPIG Is Taking Off — Thanks to James Wynn’s Viral CloutThe James Wynn Phenomenon:
James Wynn, a crypto trader who turned $4 million into $100 million before losing nearly all of it in leveraged Bitcoin futures, has become a polarizing figure in the crypto space. His massive trades, including a $1.2 billion Bitcoin long position that ended in a $17.5 million loss and a subsequent $1 billion short position with 40x leverage, have made him a viral sensation. Despite these setbacks, Wynn’s resilience and bold moves keep him in the spotlight, with thousands of traders and investors following his every step.
Wynn’s fame stems not just from his trading but from his ability to move markets. His posts on X, where he boasts a significant following, often trigger rapid price movements in the assets he mentions. This influence is now centered on $MOONPIG, a Solana-based meme coin that’s gaining traction thanks to his vocal support.
$MOONPIG: A Meme Coin with Momentum:
$MOONPIG, a meme coin built on the Solana blockchain, has seen its price surge by as much as 80% following Wynn’s endorsements, though it’s also faced volatility with a 30% drop in 24 hours and a 60% decline from its all-time high. Despite these fluctuations, the coin’s community-driven narrative and Wynn’s backing make it a compelling speculative play.
Wynn’s posts on X reveal his belief in $MOONPIG’s potential to be the “next SafeMoon” of this cycle, predicting a run to a billion-dollar market cap. He’s emphasized its appeal to retail investors, calling it “normie-friendly” and highlighting its strong community as a key driver. This narrative aligns with the meme coin mania that often propels tokens like CRYPTOCAP:DOGE or CRYPTOCAP:SHIB to explosive gains during bullish market phases.
Why I’m Bullish:
Wynn’s Influence as a Catalyst: Wynn’s fame amplifies $MOONPIG’s visibility. His posts on X, such as one claiming he transferred profits to the $MOONPIG reserves wallet, signal commitment and attract attention. When Wynn speaks, traders listen, and his endorsements have already driven significant price action, with one instance sparking an 80% surge.
Community Strength: Wynn has emphasized $MOONPIG’s community-driven ethos, stating it “doesn’t need KOLs or BS” and thrives on organic support. In the meme coin space, strong communities can sustain momentum, as seen with tokens like CRYPTOCAP:PEPE , which Wynn also supports.
Market Timing: With Bitcoin hitting new highs and retail interest flooding back into crypto, $MOONPIG is well-positioned to ride the wave. Wynn’s thesis that retail investors will soon pour into altcoins aligns with current market sentiment, making $MOONPIG a potential beneficiary.
Speculative Upside: Meme coins thrive on hype, and $MOONPIG’s low market cap relative to its potential—analysts like @KookCapitalLLC
speculate a $1 billion valuation—offers significant upside for early investors. Even after recent pullbacks, the coin’s volatility suggests opportunities for traders who can stomach the risk.

Bitcoin Bullish, Will Not Hit $200,000 This Cycle, $137,000 NextBitcoin is still bullish. A higher low is a bullish development. If Bitcoin stops bleeding at around a price of $88,888.88 this would be a strong, perfect, higher low compared to 7-April and it would match perfectly a classic correction because this price sits at the Fibonacci golden ratio.
Good afternoon my fellow Cryptocurrency trader, timing is important and we got perfect timing on this retrace. How far down will it go?
It is still too early to say but we know that below $74,500 isn't possible because that's the last low. $78,000 is possible but not necessary so we are betting that the lowest ever will be above $80,000. Remember, Bitcoin will never ever trade below $80,000 in its history. Sorry, but these prices are gone, nobody can buy this low again.
There is good news though. You can still buy when the next low is established.
It is impossible to predict the exact price when Bitcoin will stop dropping, but it is possible to see a support level being developed. So when the next support is in, we can cover (close the SHORT) and go LONG again.
Pretty simple. Buy when prices are low, sell when prices are high.
A new all-time high is pretty high and thus we sell (sold).
When the next support level is established, we buy again.
Thanks a lot for your continued support.
Each Altcoin needs to be considered individually because some will grow while others move down. We are more advanced now in this bull market cycle. You can visit my profile for more.
Namaste.
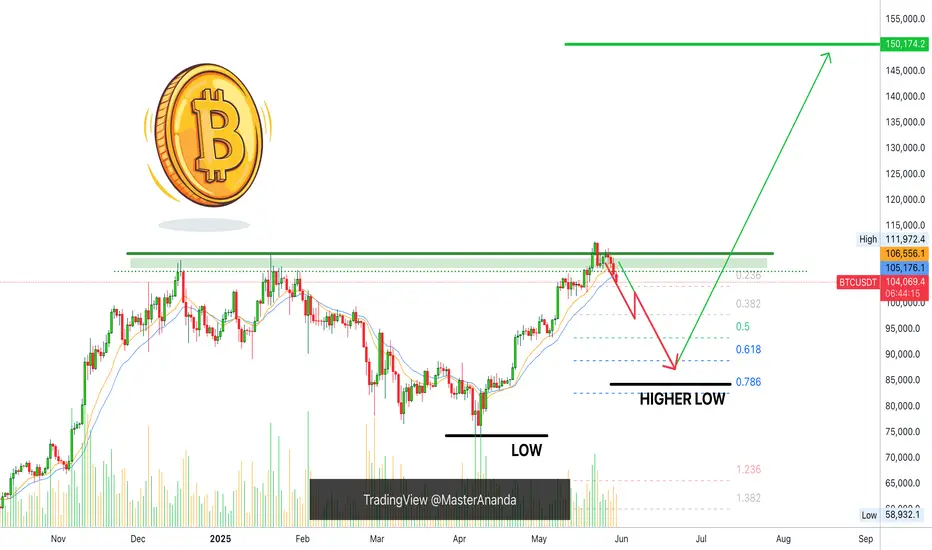
Maybe your biggest risk is your biggest chance !!!The price is currently forming the second corrective wave, and a slight price drop to reach higher levels is normal.
Give me some energy !!
✨We spend hours finding potential opportunities and writing useful ideas, we would be happy if you support us.
Best regards CobraVanguard.💚
_ _ _ _ __ _ _ _ _ _ _ _ _ _ _ _ _ _ _ _ _ _ _ _ _ _ _ _ _ _ _ _
✅Thank you, and for more ideas, hit ❤️Like❤️ and 🌟Follow🌟!
⚠️Things can change...
The markets are always changing and even with all these signals, the market changes tend to be strong and fast!!

BTCUSD Bearish Signal | Technical + Custom AlgoSmart Trend Signal | Technical Analysis + Custom Algorithm
This signal is the result of a combination of classic technical trend analysis and a proprietary software I personally developed.

BITCOIN Bearish Signal | Technical + Custom AlgoSmart Trend Signal | Technical Analysis + Custom Algorithm
This signal is the result of a combination of classic technical trend analysis and a proprietary software I personally developed.

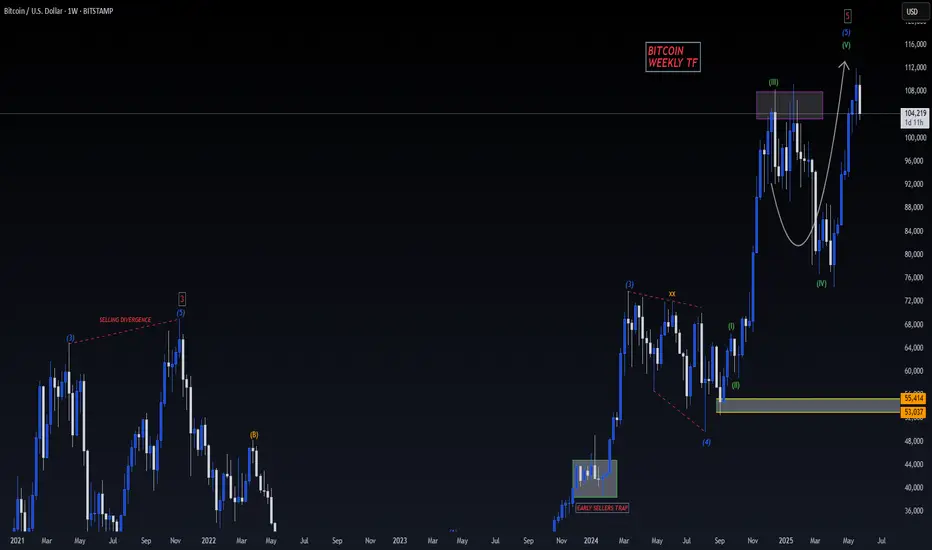
BITCOIN BULLISH TO $116,000 (UPDATE)Bitcoin has come very close to our $116,000 target, peaking at $112,000 just $4,000 away from our TP.
I still believe BTC prices will push higher for sure. But my only concern right now is will BTC have a huge correction ( Minor Wave 4) before it moves back up again? If it does then I'll most likely cash out my buy positions soon for my Crypto Fund investors, as we've already made decent profits & it is not worth holding on too much longer & risking it.

BITCOIN AT good Support. Will BTC BITCOIN move higher from here after taking supp at 23% of Fib ?
Lets see.

Skeptic | Bitcoin Weekly Recap #15 Bull Run On? Altcoin Next?Hey everyone, Skeptic here! Bitcoin’s been throwing curveballs this past week—did it leave you spinning? 😵 Still unsure if the bull run’s officially on, or hunting for the perfect altcoin entry? Don’t worry, in this recap, I’m laying it all out with clear reasoning to give you a crystal-clear view of the market and help you ditch those FOMO-driven decisions. Here at Skeptic Lab , we analyze Markets with one motto: No FOMO. No hype. Just reason. We’re not like others who panic over dumps or hype every pump—we’ve got risk management , stop losses , and we stay glued to the market’s pulse. Let’s dive into the Bitcoin Weekly Recap and unpack it all! 📊
Monthly Timeframe: The Big Picture
Let’s zoom out to the last three months. The 74,000 to 82,000 range has been a rock-solid support zone for Bitcoin, with heavy shadows every time we touch it. Big shadows like that scream potential trend reversal, and right now, Bitcoin’s major trend is firmly uptrend. Until we see a clear signal for a trend change, all that noise about Bitcoin crashing to 50K or “the bull run’s over” is pure nonsense. If you hear anyone making those bold future price predictions, run the other way! Our job isn’t to predict the future—it’s to map out scenarios and have a plan when they play out. Comparing the 2022 bear market to now is flat-out silly. Why? Back then, we’d already seen massive gains, but now, we haven’t had significant growth yet—altcoins are quiet, and total market volume hasn’t spiked. The end of a trend isn’t when everyone’s scared of losses; it’s when everyone’s dreaming of becoming a millionaire and the news is pumping FOMO. 😄 So, ignore those baseless analyses and let’s get to the real stuff.
Weekly Timeframe: Momentum Check
On the weekly chart, we kicked off a solid uptrend momentum, even hitting a new all-time high. Bears tried to jump in and sell, but here’s the catch: the previous ceiling hasn’t been technically broken yet, so we haven’t gotten a clear buy signal. Why? Because support and resistance levels aren’t static—they shift over time. The longer time passes, the higher or lower these levels move, and they need updating. Right now, we got rejected after testing the ceiling because our true resistance is still intact. So, when do we get confirmation? Let’s drop to the Daily Timeframe for clarity.
Daily Timeframe: Spot Trigger
After breaking 112,000 , we’ll get the main confirmation that the last ceiling before the correction is broken, signaling the continuation of the major uptrend per Dow Theory. That’s our spot buy trigger—buy above 112,000 with a stop loss below 100,000 , giving you a 10% stop loss size. Please, manage your capital so that if you hit the stop loss, you lose no more than 3% of your total capital. Staying alive in financial markets hinges on risk management. Now, let’s hit the 4-Hour Timeframe for long and short triggers.
4-Hour Timeframe: Long & Short Setups
We had a solid upward trendline on the 4-hour chart, but it broke to the downside. When this happens, two scenarios are possible: either the uptrend’s slope has just softened with no trend change, or we’re entering a correction. My take? We’re likely heading for a time-based correction (think range-bound boxes). If we start ranging, don’t beat yourself up or pile into trades impulsively—win rates for most traders tank in range phases, and losing streaks pile up. For long positions, I suggest waiting for a break above 108,900 . That’s where we got a strong rejection and pullback last time, so we need solid confirmation to go long since bearish momentum is stronger in this phase. For shorts, 105,000 was a good level, but the next short trigger is a break below support at 101,577 . If we see a strong reaction at any level on this timeframe before that, you could short on a break there too. For breakout confirmation, indicators like SMA or RSI work, but volume is king. High volume on a break means it’s likely to continue; low volume screams fake breakout, so cut your risk there.
Bitcoin Dominance (BTC.D): Altcoin Timing
Let’s wrap up with a quick look at BTC.D to figure out if it’s time to jump into altcoins. BTC.D shows Bitcoin’s share of the total crypto market cap—the higher it is, the more liquidity flows into Bitcoin, often from altcoin sales. On the daily chart, we’re still above an upward trendline I mentioned in previous analyses, and altcoins haven’t made any real moves. When I say “moves,” I mean serious 100-500% or even 10,000% rallies , not just 10-20% pops. An altseason would be confirmed by a break of this trendline and a drop below support at 60.27. That’s when we’d expect massive altcoin gains, but it only works if Bitcoin’s already in a strong uptrend with solid market liquidity. Otherwise, don’t expect crazy altcoin pumps. The total market cap needs to be growing too for this to happen.
💬 Let’s Talk!
If this recap sparked some ideas, give it a quick boost—it means a lot! 😊 Got a pair or setup you want me to tackle next? Drop it in the comments. Thanks for joining me at Skeptic Lab—let’s grow together with No FOMO. No hype. Just reason. Keep trading smart! <3✌️

BITCOIN BULLS WILL DOMINATE THE MARKET|LONG
BITCOIN SIGNAL
Trade Direction: long
Entry Level: 104,686.94
Target Level: 111,091.02
Stop Loss: 100,407.14
RISK PROFILE
Risk level: medium
Suggested risk: 1%
Timeframe: 9h
Disclosure: I am part of Trade Nation's Influencer program and receive a monthly fee for using their TradingView charts in my analysis.
✅LIKE AND COMMENT MY IDEAS✅

Be careful with BTC !!!Finally, the price broke the wedge, and the price experienced a significant drop. I think is the time for btc to rise again to 111k after more correction . STRONG SUPPORT 98k
Give me some energy !!
✨We spend hours finding potential opportunities and writing useful ideas, we would be happy if you support us.
Best regards CobraVanguard.💚
_ _ _ _ __ _ _ _ _ _ _ _ _ _ _ _ _ _ _ _ _ _ _ _ _ _ _ _ _ _ _ _
✅Thank you, and for more ideas, hit ❤️Like❤️ and 🌟Follow🌟!
⚠️Things can change...
The markets are always changing and even with all these signals, the market changes tend to be strong and fast!!

AKT/USDT Analysis💥 CSEMA:AKT - Swing Long Plan After 30% Correction 💥
AKT faced heavy selling pressure around the weekly pivot at $2.0640 , leading to a significant correction of nearly **30%**. The big question now: **Is it time to open a swing long?**
Here’s my take👇
Although we’ve already seen a 30% drop, that doesn’t mean the downside is over . For a high-conviction swing long, patience is key. I’m watching **three key levels** to build a position safely — no FOMO here.
🔹 Long Area 1 : $1.1291 (25% allocation)
🔹 Long Area 2 : $0.9722 (35% allocation)
🔹 Long Area 3 : $0.8234 (40% allocation)
💡 This is my ultimate swing long setup . Scaling in at these levels provides a better risk-reward profile rather than chasing the bounce.
But what if price only taps **Long Area 1** and then reverses? That’s fine too. The priority is **capital preservation and strategic entries**, not catching every single move.
✅ Focus: Make more with less risk
❌ Avoid: Emotional entries and overexposure
📌 Not financial advice. Do your own research. Trade safe! 🧠💰
#AKT #SwingTrade #CryptoAnalysis #TradingStrategy #DYOR #Altcoins

Technical Analysis – KASPA/USDT (1D) + spot trade planTechnical Analysis – KASPA/USDT (1D)
Trend Structure & Price Action
KASPA experienced a strong bullish rally (highlighted in orange) starting in mid-April, followed by a descending channel (bullish flag) correction (highlighted in green).
Currently, the price is approaching major support zones, indicating a potential reversal opportunity.
Support & Buy Zones (Marked)
Buy Spot 1: ~$0.062–$0.067 → Key historical support, potential bottom range.
Buy Spot 2: ~$0.070–$0.075 → Moderate support, former resistance turned support.
Buy Spot 3: ~$0.078–$0.081 → Current local demand zone and trendline interaction.
These zones represent incremental buying opportunities during correction.
Indicator Analysis
Market Cipher / Divergence Indicators
Multiple bullish divergence signals are forming (green dots), suggesting buyer interest is growing.
Momentum is in deep negative territory and may be bottoming.
RSI (14)
RSI is at 32.95, which is approaching oversold territory (below 30), signaling a potential reversal.
Money Flow Index (MFI)
MFI is at 19, which is also considered oversold, showing capital is leaving but likely nearing exhaustion.
Stochastic RSI
Stochastic RSI is below 10 (6.22) and starting to cross, indicating a strong potential bullish reversal in the short term.
Trading Plan – KASPA/USDT (Spot Strategy)
Entry Strategy (DCA)
Buy Spot Entry Range Allocation Reason
Spot 1 $0.062 – $0.067 50% Major long-term support, deep oversold zone
Spot 2 $0.070 – $0.075 30% Mid-range support, confirmation zone
Spot 3 $0.078 – $0.081 20% Early entry for aggressive traders
Risk Management
Stop Loss (optional): Below $0.060 (break of long-term structure)
Average Entry (if all 3 zones are filled): ~$0.071 (estimated)
Capital Allocation: Use max 3–5% of total capital per setup for risk control.
Profit Targets
Target Level Price Rationale
TP1 $0.092 – $0.095 Top of descending channel
TP2 $0.105 Previous swing high (April peak)
TP3 $0.120 Breakout and continuation target
KASPA is currently in a healthy correction within a bullish continuation pattern (falling channel). The confluence of oversold indicators (RSI, MFI, Stoch RSI), support zones, and bullish divergence suggests a favorable buying opportunity for swing or position traders. If the price respects these zones, a bounce toward the prior high or breakout levels is likely.

BTCUSD - Short Term Bear MarketExpecting BTC to slow down to allow alts to catch up to this massive run
Once the bottom trend line is hit BTC will probably keep going
Small Correction
Weekly timeframe

Bitcoin's at ALL TIME HIGHS and I'm going ALL IN!!As Bitcoin surges to new all-time highs, I've made a pivotal decision: to stop saving in dollars and start holding Bitcoin.
Why Bitcoin? Self-Custody:
Owning Bitcoin means true ownership. With self-custody, I control my private keys, ensuring my wealth isn't subject to third-party risks like bank failures or government seizures.
Declining Dollar Value: The U.S. dollar continues to depreciate due to inflation and economic policies. Holding Bitcoin, a deflationary asset, offers a hedge against this erosion of purchasing power.
Global Accessibility: Bitcoin transcends borders, providing financial inclusion for anyone with internet access, especially in regions with unstable currencies.
Security and Privacy: With proper self-custody practices, my Bitcoin holdings are secure from hacks and offer enhanced privacy compared to traditional financial systems.
As I monitor the BTC/USD daily chart, the trend is clear: Bitcoin isn't just a speculative asset; it's a movement towards financial sovereignty.

Market3I haven’t been posting much lately simply because there’s nothing particularly interesting to say, the market has been a bit dull.
2025 should be a strong year for altcoins, as they’ve been consistently suppressed. With BTC dominance reaching 64%, which is quite significant, all attention remains on Bitcoin.
On this chart, you can see that $1.17 trillion acted as a rejection level for the crypto market (excluding BTC and ETH). Time will tell, but I anticipate a $4 trillion altcoin bull market before the end of 2025.
Remember, Fibonacci plays a crucial role in long-term market predictions.
Invest wisely and at the right time.
Happy Tr4Ding !

Altcoins The Moon AwaitsLike always, everything is clearly outlined on the charts :
- As a trader, it's crucial to follow logic and technical analysis. If you get caught up in the news and listen to everyone on Twitter, you won't last long.
- The first major altcoin rally was in 2018, pushing the market to $300 billion. This level later acted as a key support throughout the 2022–2023 bear market.
- The last all-time high for the crypto market (excluding Bitcoin and Ethereum) reached $1.15 trillion in 2021. ( blue doted vertical line )
- This all-time high was retested in December 2024, with this ATH acting as strong resistance. ( second blue doted vertical line )
- The next move could be a breakout above this resistance. According to Fibonacci projections, the altcoin market has the potential to reach $4 trillion.
While the spotlight remains on Bitcoin and ETFs, altcoins could catch up with a sudden and powerful surge, so make sure you’re not left behind.
Hodl!
Happy Tr4Ding !

$BTC.D Dominance forecast: update May 2025📉 BTC Dominance (%BTC.D) Update – At Resistance, Altseason in the Balance
Back on April 5th, I published a forecast highlighting the critical 65% resistance level on BTC Dominance. That analysis still holds: BTC.D reached 65% and got rejected, pulling back to 62% as of now.
⚔️ What’s Happening?
Bitcoin dominance is compressing, and we're approaching a make-or-break moment:
🔹 Resistance confirmed at 65%
🔹 We bounced down to 62% — not up
🔹 Market is hesitating, and the next move will shape the short-term direction for alts
🔍 The Bigger Picture
Bitcoin pumped hard recently, mostly due to:
MACD reversal on the weekly
Oversold conditions now turning bullish
Renewed institutional interest in risk-on assets
But let’s be clear:
🚫 We’re not in a full altseason yet.
What we’re seeing is cautious altcoin rotation, not a blow-off alt rally.
📊 Tech Indicators
MACD: Overheated
RSI: Still has room to move up
So technically, BTC.D could still break out above 65% — but it hasn’t yet.
⚠️ What to Watch:
If BTC.D breaks out above 65%, expect:
➡️ Altcoin bloodbath
➡️ BTC.D could head toward 70%, crushing the mini-altseason
But if BTC.D continues to drop from here?
➡️ Altseason starts to heat up
🔮 Outlook
A true altseason might not arrive until September/October. For now, the market is stuck in a range of uncertainty.
Keep your eyes on:
BTC.D reaction at 62%–65%
TradFi stress (bond markets, macro fears)
Bitcoin strength and ETH/BTC ratio
🧠 Take profits when you can. Protect your capital.
📌 Follow me for future updates—and don’t forget to DYOR.
📎 Original forecast:

Bitcoin Challenges Support —Never Ever Below $80,000 (80K)I updated this chart to show the full support range. This is Bitcoin's main support. Between $100,000 and $103,000. If this level breaks, prepare to see Bitcoin producing another week red then consolidation, on and on, before the next high.
If this support holds, then we can expect a soon and fast recovery.
The most likely scenario is that it will take around 2-3 weeks before the retrace-correction is over followed by new growth.
Remember, always a higher low. Just look back to August 2024. After the major low was in, there was indeed retraces and corrections as part of the bullish phase. It is the same.
Retraces and corrections are just an opportunity to buy-in, rebuy and reload.
If you missed below $80,000 in the last drop, you can get below $90,000 in this drop. But not much lower.
Bitcoin will never ever trade below 80K.
Thank you for reading.
Namaste.
