Bitcoin to $115k or pullback to $91kGood Evening Traders,
First I would like to say, congratulations to all of you who have been in the game for the last 3 bitcoin halving cycles. Through all of the "You buy fake internet money" comments or the never ending explaining of the Tokenomics of different cryptocurrencies, I have to say KUDOS to all of us who saw the vision, stuck to your guns and intricately added to your bags over the years! We are finally here on the cusp of full regulation and a final hush of the naysayers!
Ok, now down to brass tax! On the chart I have Highlighted a few important details. Something I did not point out on the chart is the massive printing of USDT that has been happening over the past few days. It seems to me that we are on the cusp of a massive influx of capital into the alt coin markets. But, for now lets focus on Bitcoin! As stated, you can see multiple points that I have highlighted... These being mostly bearish for the big dog of market cap and the grandfather coins of crypto Bitcoin. The first few things to notice is the bearish divergence on the MACD histogram, the bearish down cross of the MACD line over the signal line on the MACD indicator. You can also note the overbought area on the RSI right above that. In addition to this we do have some gaps on CME:BTC1! Which generally get filled sooner than later on most charts.
With this in mind, it is possible that we could have some good news amongst the movers and shakers down at the Bitcoin conference this week. Yet, we could get some sell the news type events that could ease the price downward to fill in these gaps that we have below. In my experience at the beginning of each alt coin season Bitcoin generally leads the rally and can trade sideways to down during the upward movement of the majority of the altcoin market.
My personal thoughts on the chart currently is shown at the top of the chart. if we close the daily candle underneath the hyperlocal resistance shown on the red line at the top of the chart, then we will most likely start pulling back to fill the first gap that is shown on the chart below in yellow. Albeit, the MACD is a lagging indicator, we can gain a lot of insight using it and my favorite sign on the MACD is using the histogram to point out bearish and bullish divergences. This shows a lack in momentum in the current trend that is shown through the price action of the assets trend. Especially, after a straight run up like we have just experienced as of late.
In conclusion, you can make the assumption that if we close the current day under the red line above it is very possible that we begin what could turn out to be an ABC correction leading us down to fill in the gaps on BTC1! to the downside. If we hold the first support, BTC may show us a little more juice potentially reaching for just under $115k. This in my opinion would likely be a bull trap for the time being. Summers are not the best when it comes to crypto growth and it always seems like we are waiting for the Ground Hog to see its shadow to find out if we are to the moon or back to McDonalds with our friends!
I hope that this analysis has helped you gain some insight in your research. I have added supports to the chart to show you where we may turn around and start heading back into price discovery.
Stay Profitable,
Savvy
Bitcoin (Cryptocurrency)

BTCUSD: About to explode to 135k by July.Bitcoin is about to turn neutral again on its 1D technical outlook (RSI = 57.730, MACD = 3423.900, ADX = 23.501) as it is expreriencing the strongest pullback since the start of its April bottom. Having completed a 1D Golden Cross like on October 27th 2024, this pullback seems a lot like the one that suceeded that Cross, which tested the LH trendline and marginally crossed under it and as it held the 1D MA50, resumed the uptrend and exploded to the 3.382 Fibonacci extension. That is our target on a July horizon (TP = 135,000).
## If you like our free content follow our profile to get more daily ideas. ##
## Comments and likes are greatly appreciated. ##

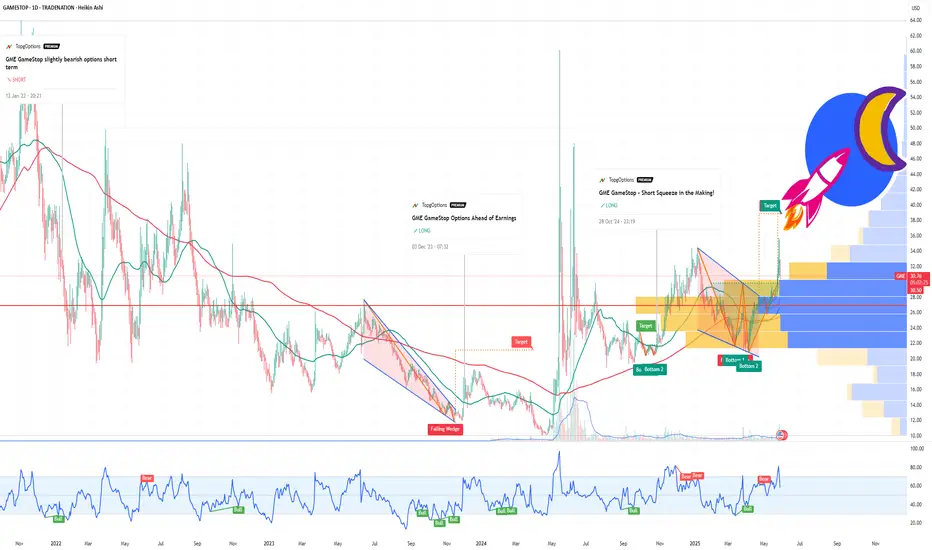
GameStop (GME) Is the New MSTR — And It Might Moon Harder ! If you haven`t bought the dip on GME:
Now You need to know that GameStop (GME) is the new MSTR MicroStrategy — But With Meme Power!
GME GameStop just made its boldest move yet: the company revealed it has purchased 4,710 Bitcoin, officially entering the crypto game in a serious way. While it hasn’t disclosed the total price paid, the intent is loud and clear — GameStop is transforming into a Bitcoin-holding company, just like MicroStrategy (MSTR) did back in 2020.
This isn’t just about hype. In March, GameStop raised $1.3 billion through a convertible note offering, specifically to help fund Bitcoin purchases. It also updated its investment policy to formally add Bitcoin as a reserve asset — the same exact strategy that led to MicroStrategy’s 10x stock explosion.
But here’s the twist: GameStop brings more than just Bitcoin exposure — it brings meme momentum. Unlike MicroStrategy, which had to win over the market, GME already has an army of loyal retail traders, massive online visibility, and a cultural legacy as the original meme stock. If MicroStrategy was the corporate face of Bitcoin adoption, GameStop is the internet’s version — louder, faster, and potentially more explosive.
Yes, the stock dipped on the announcement — typical for big moves like this — but long-term, the upside is undeniable. Bitcoin on the balance sheet gives GME new life, and volatility is GameStop’s comfort zone. With Bitcoin becoming a political and financial flashpoint — highlighted by major figures like JD Vance and Donald Trump Jr. attending the 2025 Bitcoin conference — GME’s move couldn’t be more timely.
This is more than a pivot. It’s a power play. GameStop is no longer just a nostalgia-fueled retailer — it’s a digital asset powerhouse in the making.
If you missed MicroStrategy’s rise, GameStop might just be your second chance — with even more firepower behind it.
Disclosure: I am part of Trade Nation's Influencer program and receive a monthly fee for using their TradingView charts in my analysis.
HolderStat┆BTCUSDCRYPTOCAP:BTC trend watch: Within an ascending channel, Bitcoin keeps carving triangles from consolidation clusters, defending mid-support near 108k while bulls eye the upper rail close to 116k. This technical analysis keeps the bias firmly bullish.

Gold has recently reclaimed liquidity from its previous two-day!Gold's Recent Market Behavior and Potential Outlook
Gold has recently reclaimed liquidity from its previous two-day lows, indicating a potential shift in market dynamics. Currently, the price is approaching a weekly bullish Fair Value Gap (FVG), suggesting a possible upward movement. Additionally, the 4-hour chart reveals that a minor bearish FVG has been broken, further supporting the notion of a bullish reversal.
Despite these bullish signals, gold is entering a larger bearish FVG zone. If the market provides confirmation of a sell signal from this level, a downward movement could be anticipated. Conversely, if the price breaks through this bearish FVG, it may continue its upward trajectory.
In summary, while short-term indicators favor a bullish outlook, the larger bearish FVG zone presents a critical juncture. Traders should monitor for confirmation signals to determine the next market direction.
DYOR! Not Financial Advice.

TON/USDT on Fire: Bullish Momentum Builds Toward Major Targets!By examining the #TONCOIN chart on the 3-day timeframe, we can see that after correcting down to $3, the price has started pumping again and is showing strong bullish momentum. So far, it has gained over 15%, and I expect this uptrend to continue! The next targets are $3.64, $4.20, and $4.66. The expected return is around 20% in the short term, 40% to 55% in the medium term, and 110% in the long term. Support this analysis and stay tuned for more updates, my friends!
Please support me with your likes and comments to motivate me to share more analysis with you and share your opinion about the possible trend of this chart with me !
Best Regards , Arman Shaban

Bitcoin will fall to support line of channel and then rebound upHello traders, I want share with you my opinion about Bitcoin. Bitcoin spent a considerable period trading within a horizontal range, bounded by the buyer zone around 92000 - 93000 points and the upper boundary just below 103000 points. Throughout this phase, the price respected both limits, bouncing between support and resistance, forming a stable consolidation base. Eventually, BTC broke out of this range with a strong bullish impulse, entering a clearly defined upward channel. Since then, price action has been guided by the structure of this rising channel, consistently forming higher highs and lows. Multiple clean retests of the support line confirm the integrity of the trend, and recent movement shows BTC pulling back from mid-channel after a short-term correction. Now the price is approaching the support area between 102000 - 103000, which aligns with the channel’s lower boundary. Given the pattern’s consistency and strength in previous rebounds, I think BTC can correct to the support line and continue to grow. For this case, I set my TP at 113000 points, near the resistance of the upward channel. Please share this idea with your friends and click Boost 🚀

TONUSDT Forming Falling Wedge TONUSDT is currently forming a classic falling wedge pattern—a historically bullish setup that often precedes major price breakouts. The recent breakout from the wedge accompanied by a significant surge in volume indicates a shift in market sentiment. This pattern suggests the end of a downtrend and the beginning of a new bullish wave. Such formations often result in strong upward price action once the resistance trendline is broken with volume confirmation.
Market participants have shown renewed interest in TON, with price currently stabilizing above a previous key resistance level, now potentially acting as support. This shift aligns with the historical behavior of wedge breakouts, where the asset consolidates briefly before continuing its climb. The current structure and momentum signal a potential 90% to 100% price appreciation, especially as investors recognize the strength of the breakout and the fundamental developments behind the project.
The volume profile further supports this bullish thesis. An increase in buying pressure at the breakout level reinforces the conviction that a trend reversal is in play. If TON maintains its bullish structure, the next major resistance zones could be tested, offering traders and long-term holders a strong opportunity to capitalize on this technical shift.
With rising investor interest and a textbook bullish pattern breakout, TONUSDT is a crypto pair to watch closely. The breakout from the falling wedge combined with solid volume growth and increasing sentiment across crypto communities signals that a new uptrend could be underway.
✅ Show your support by hitting the like button and
✅ Leaving a comment below! (What is You opinion about this Coin)
Your feedback and engagement keep me inspired to share more insightful market analysis with you!

BTC shell fall!!!?This is how i am looking at market...
I can see a bearish triangle pattern in 4hr chart, which shows that btc may go 109,000-109,800 to complete third spike, then it might fall, main Support level will be 107,000-106,890, if market breaks it successfully then BTC may show 102,000 or if btc respect it's support level, then market may touch all time high 114,000!!!.

Bitcoin + $200k is magneI disagree with the claim that bitcoin local peak was seen highlighted in ct. I think the bitcoin run will continue and the local peak will be around +$200k
If we take the stretched cycles as a basis, we can understand this through many indicators.

BITCOIN Desperately needs that weekly closing!Bitcoin (BTCUSD) broke last week above its January Resistance, effectively making a new All Time High (ATH). Technically, within BTC's dominant 2.5-year Channel Up, that is not enough to generate a bullish extension on its own and the reason is that a 1W candle closing above the Resistance level is needed and not just a break.
At least that's what happened during the last two Bullish Legs, where it required a convincing 1W candle close considerably above the Resistance, to confirm the Bullish Extension. In fact the break-out candles on both previous Bullish Legs is fairly identical.
The minimum % rise on the pattern's three Bullish Legs has been +96.75% with the others not falling way off that range (+98.74% and +106.94%). As a result, the bare minimum Target we can be expecting, in the event of a 1W candle closing above the $109500 Resistance, is $147000.
Do you think that' within the market's immediate reach? Feel free to let us know in the comments section below!
-------------------------------------------------------------------------------
** Please LIKE 👍, FOLLOW ✅, SHARE 🙌 and COMMENT ✍ if you enjoy this idea! Also share your ideas and charts in the comments section below! This is best way to keep it relevant, support us, keep the content here free and allow the idea to reach as many people as possible. **
-------------------------------------------------------------------------------
💸💸💸💸💸💸
👇 👇 👇 👇 👇 👇

Bitcoin is correcting to support. Possible growth to 110.000Bitcoin failed to hold above 110000, but at the same time the price is forming a flat. The support has not been tested yet (the cascade of orders below the level has not been touched) and within the uptrend the area of 106700 plays an important role.
Based on bitcoin is inside the flat you can consider trading between its boundaries.
Scenario: Within the current movement, the price is likely to form a retest of the 106700 support with the aim of liquidation and accumulation inside the flat. False break of support may attract buyers and in this case bitcoin may test 110000 again.

Minor advantage on the bullish sideMorning folks,
So, downside AB-CD action is started as we suggested. But, it is very slow and going heavy. Appearing of triangle shape here and early signs of bullish dynamic pressure on daily chart turns the balance slightly on the bullish side.
Still, we do not have yet any clear patterns that makes us sure. So, if you're conservative - it would be better to wait a bit. If you still want to buy inside the triangle - it would be better to place initial stop below OP target, just not to be washed out occasionally, if AB=CD will be completed. Because it doesn't break the bullish context but could give us "222' Buy instead.

Strategy Set To Drop —Selling Bitcoin?If you knew a stock was going to crash but this stock is related to Bitcoin and always moves with Bitcoin but now is about to detach, would you tell others?
Bitcoin is already trading at a new All-Time High and six weeks green. Ok, let's forget about Bitcoin because this is about MicroStrategy (now Strategy).
The MSTR stock is bearish now. Very bearish.
The top happened in November 2024.
9-May 2025 we have a long-term lower high. Days at resistance and this lower high is confirmed.
A scandal is about to be uncovered?
A change of "strategy"? Hah, nice play on words.
Is strategy going to have a change of strategy?
This change of strategy obviously will end up screwing everybody who holds this stock?
I don't know... I mean, who knows.
Here is what I know. The chart signals are pointing down. Bearish confirmed so, down we go.
Namaste.

my prediction is on bitcoin downward correction is onprevious post i told you guys bitcon need a downward correction. now see the results already its' going down.
BITCOIN LOCAL LONG|
✅BITCOIN is trading along the rising support line
And as the coin is going up now
After the retest of the line
I am expecting the price to keep growing
To retest the supply levels above at 110k$
LONG🚀
✅Like and subscribe to never miss a new idea!✅
Disclosure: I am part of Trade Nation's Influencer program and receive a monthly fee for using their TradingView charts in my analysis.

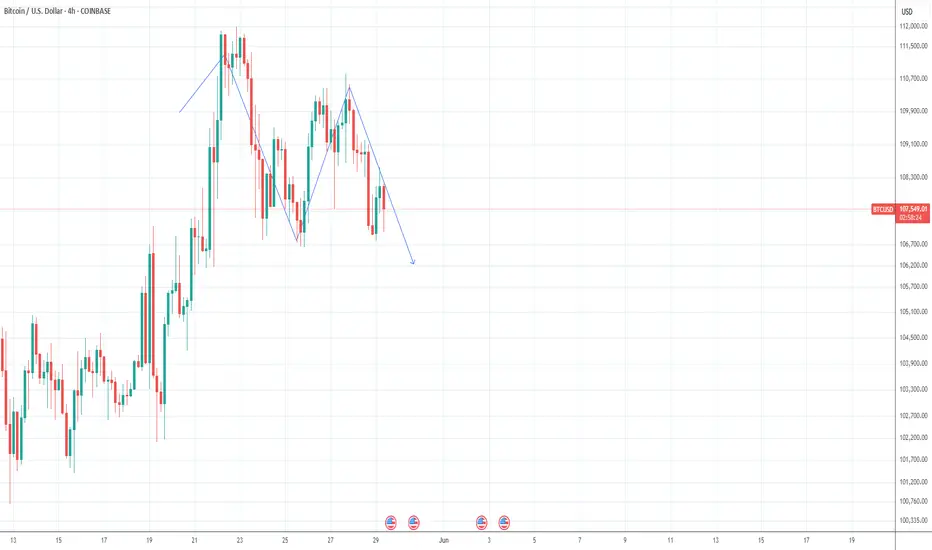
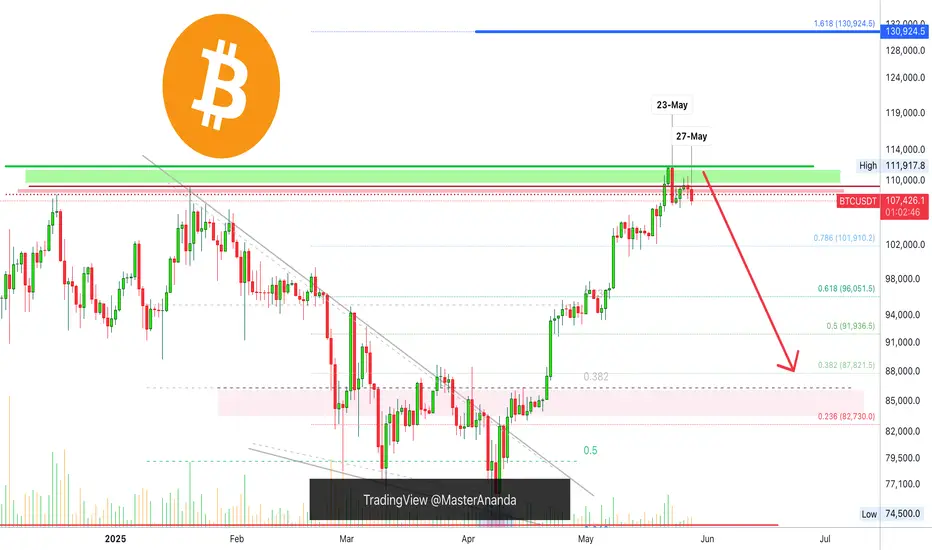
Bitcoin's Bearish Potential Explained Using Candlestick ReadingI will explain the chart as it is now based on candlestick reading and then add some additional information. The bearish bias short-term has been confirmed.
The green line marks Bitcoin's all-time high.
Dark red is the previous ath 20-Jan. 2025 and the dark red dotted line the high from 17-Dec. 2024.
Bitcoin (BTCUSDT) now trade below all three levels on a daily basis.
Right after the all-time high, 23-May, we have a full red candle.
The full red candle is a rejection as Bitcoin produced this new ath which is also a technical double-top.
After three days green, Bitcoin produces a lower high in the form of a Doji. 27-May. This Doji confirms the candle from 23-May.
Today, 28-May, Bitcoin produces a red candle as continuation of the action from 23 and 27 May.
Trading volume is super low.
Big institutions are buying and these always tend to buy at the top. The top means higher no more. A correction is upon us.
Resistance has been confirmed, how can Bitcoin turn bullish again short-term?
It needs to move and close above the all-time high on a daily basis. Anything lower and you can SHORT.
The fact that Bitcoin closed 7 consecutive weeks green, with the last few weeks become smaller, it is a sign of exhaustion, the market is looking for a relief.
A retrace can turn into a correction and if panic sets in a correction can turn into a crash.
It is still early though, but these things tend to unravel pretty fast.
Are you paying attention?
What will happen now?
A bullish trend is based on higher highs and higher lows. The bigger structure is not likely to break but, Bitcoin is going down, it doesn't matter if it is short or mid-term... Do what you have to do to protect yourself or secure profits. You can never go wrong by securing some profits when your pairs grew by 300 to 500%. If you are waiting for more, forever more, you are just a greedy ... trader.
Thanks a lot for your continued support.
Secure the win and forget the greed.
Win, win, win. And you will have the chance to play again.
Plan before buying. Develop a plan and use this trading plan to achieve trading success.
Whatever you do is up to you.
I am just reading the chart.
I left one question unanswered on purpose; How far down will it go?
Tell me in the comments, if you tell me your version I will tell you mine.
Thanks a lot for your continued support.
Buy and sell.
Sell, not hold.
Namaste.
Next Volatility Period: Around June 6
Hello, traders.
Please "Follow" to get the latest information quickly.
Have a nice day today.
-------------------------------------
(BTCUSDT 1D chart)
This is the last day of this volatility period.
To continue the uptrend, the price needs to rise above at least 109403.63 and hold.
If it fails to rise, we need to check if it is supported near 106843.58.
And we need to see if it can touch the M-Signal indicator on the 1D chart and rise.
If the price is maintained above the HA-High indicator, it is also important to see if the price can be maintained above 106843.58, as there is a possibility of a stepwise rise.
The next volatility period is expected to be around June 6.
-
(30m chart)
It seems that the basic trading strategy is being followed faithfully.
That is, it is showing a pattern of buying near the HA-Low indicator and selling near the HA-High indicator.
Therefore, we need to focus on finding a trading point when the HA-Low or HA-High indicator is touched.
However, if it is supported by the HA-High indicator and rises, it is likely to show a stepwise upward trend, and if it is resisted by the HA-Low indicator and falls, it is likely to show a stepwise downward trend.
Even so, we must not forget that the end of a stepwise upward trend is a decline, and the end of a stepwise downward trend is an increase.
At the current price position, the important points on the 1D chart are 111696.21, 109403.63, and 106843.58.
Therefore, when looking at the 30m chart, if the HA-Low and HA-High indicators are generated near the important points above, it is necessary to interpret that point as forming a more important section.
In other words, the HA-Low indicator was generated at the 107096.41 point near the current 106843.58 point, and it eventually showed an upward trend.
Therefore, if the HA-Low indicator is newly generated as the price falls, you should check if there is an important point near it.
Otherwise, if it touches the existing HA-Low indicator point of 107094.41 again, it is more likely to fall because it touches the second time, so you need to be careful when trading.
This means that the HA-Low indicator is likely to rise when it is first generated, and is likely to fall when it touches the second time.
Conversely, the HA-High indicator is likely to fall when it is first generated, and is likely to rise when it touches the second time.
Since the interpretation of the indicator is not 100% applicable, you should check the support and find the trading point.
-
Thank you for reading to the end.
I hope you have a successful trade.
--------------------------------------------------
- This is an explanation of the big picture.
(3-year bull market, 1-year bear market pattern)
I will explain more details when the bear market starts.
------------------------------------------------------

Bitcoin 6X Lev. Full PREMIUM Trade-Numbers —2nd Entry (PP: 540%)I will explain my thinking as usual so you can make an informed decision.
I believe Bitcoin will make a new advance. When there is a move that leads to the challenge of resistance or support, there is always a stop, a retrace or pullback before additional action. Bitcoin here stopped at 95,000, which is the first resistance from our previous trade-signal and did produce a retrace but it was extremely small. This is a bullish signal.
The fact that the action remains at resistance and this resistance continues to be challenged, is also a bullish signal. The more this resistance gets challenged the weaker it becomes.
Now, a 2nd entry is riskier than the first one of course because the action is more advanced but not everybody can enter perfectly at bottom prices nor at the same time.
We manage risk through capital allocation and relatively low leverage, which is actually pretty high.
See the full numbers and you will see that risk is low.
The stop goes below the low 13-Jan. 2025. The lowest after the final advance happened at $91,688 on 24-April. This is a relatively safe chart setup.
_____
LONG BTCUSDT
Leverage: 6X
1) $96,000
2) $93,000
3) $90,000
Targets:
1) $104,250
2) $120,000
3) $131,400
4) $143,300
5) $165,000
6) $181,000
Stop-loss:
Close weekly below $86,000
Potential profits: 540%
Capital allocation: 5%
_____
I think timing is good on this one. The next move can happen within days because consolidation has been happening already for an entire week without much change in price, clearly a continuation pattern. Volume being low at this point is also a signal of consolidation.
The fact that there is no volume indicates that the true bullish action is yet to start.
Bears not being present indicates that growth will happen long-term as the bearish cycle (the previous correction) is over.
I wishing you great luck and profits.
The market always offers a second chance, always.
Namaste.

Bitcoin 5X Lev. Full PREMIUM Trade-Numbers (PP: 710%)Bitcoin is presenting us with a very clear and strong bullish bias. The action is happening within a very tight falling wedge pattern. All market conditions are bullish, technical and fundamentals. Everything is pointing up starting several days ago. 7-April Bitcoin produced its 2025 market bottom low. From this date on, we will see growth until late 2025 or maybe until early 2026 or beyond.
This is a high probability trade setup. The market produced many shakeouts already and the majority of weak hands have been removed. All the people around now, all remaining participants, are solid players with diamond hands. These people, you, have a plan and know how to play the long-term game.
For people like us, the market is making this opportunity available.
Make the best of it. Aim high.
Full trade-numbers below:
_____
LONG BTCUSDT
Leverage: 5X
Entry levels:
1) $85,000
2) $82,000
3) $78,000
Targets:
1) $95,000
2) $104,250
3) $120,000
4) $131,400
5) $143,300
11) $165,000
12) $181,000
13) $203,000
Stop-loss:
Close monthly below $74,000
Potential profits: 710%
Capital allocation: 5%
_____
Strategy: Buy and hold. If prices drop, buy some more. The market will take care of the rest.
Just make sure to keep your position active, do not allow to be liquidated. That's the only important point. Bitcoin will soon grow.
Patience is key.
Use low risk.
Success is yours.
Namaste.

GameStop goes crypto: what 4,710 BTC means for the chartGameStop has disclosed a $500 million investment in Bitcoin, marking its first significant move into the crypto space.
The video game retailer is sitting on $4.76 billion in cash and hasn’t disclosed a limit on future purchases.
GameStop shares fell 10% following the announcement, while Bitcoin pulled back toward $107,000. A 14% rally would be needed for BTC to reach the 127.2% Fibonacci extension at $122,000, while $103,800 could be a key support level where we previously saw consolidation.
CEO Ryan Cohen addressed the Bitcoin 2025 Conference in Las Vegas via pre-recorded video Wednesday too, citing macroeconomic concerns as a key driver behind the company’s decision. These likely include rising U.S. debt levels and trump tariffs.

BTC OUT OF STEAM - $84.5 K Updating the BTC coverage. Was hoping to push thru directly to $132k, that did not happen. It looks more likely BTC will drop back to $84,500 before a resumption of trend can continue. There is a chance she can hold at $95,600 but currently not the best odds for that. A full dip looks to be coming. Take profits on BTC now.

BTCUSD: 1M turned overbought and that's not alarming at all! Bitcoin has turned bullish even on its 1M technical outlook (RSI = 70.030, MACD = 16,156.720, ADX = 38.100) but that's not a reason to expect any strong corrections as this is the part were it technically rises more during Bull Cycles. The basic structure of the Cycle is an Ascending Triangle which breaks when the parabolic rallies begin. Based on the ratio of the last two Cycles, the new rally should be around +130% from the top of the Ascending Triandle. That gives a $160,000 fair estimate as far as the Cycle top is concerned.
## If you like our free content follow our profile to get more daily ideas. ##
## Comments and likes are greatly appreciated. ##
