Bitcoin: 3 Of 5 Sub Waves In, Two To Go.Bitcoin not only reached my 113K profit objective, it blew right through it and is now closing in on the 120K objective. I have been writing about this Wave 5 formation for weeks now. 3 sub waves can be counted in the current move, which means Wave 4 retrace and then one more leg higher which can put price anywhere above 120K. Whole numbers, especially every 10K points, like 130K, 140K, etc. serve as psychological reference points. The main thing to keep in the forefront of your mind is once the 5th wave completes, the probability of a BROAD corrective move becomes highly likely.
This move largely has to do with the combination of the effects of the U.S. tariffs and a declining faith in the U.S. dollar. Either way, the reasons do not matter. What matters is the RISK. Wave counts are a measure of emotion in the market and have nothing to do with fundamental drivers. 5th Waves usually represent the situation where the market becomes saturated on one side (all the buyers have bought for now etc.). While the market can still continue higher for irrational reasons, 5th Waves mean it becomes highly vulnerable to bearish catalysts which can suddenly come out of nowhere.
My Trade Scanner Pro called a long two weeks ago which reached its profit objective on this time frame. There have been multiple opportunities to participate on smaller time frames for swing trades and plenty of day trade signals. As Bitcoin continues to complete this 5th Wave, it is best to avoid new investments at these levels because of the risk, and just trade the price action. As for investors, there is no reason to take profits YET, in terms of sell signals, but watch for large reversal candles around 120K, 125K or 130K. The LEVEL and the CONFIRMATION is what should help in your decision to lock something in.
Thank you for considering my analysis and perspective.
Bitcoin (Cryptocurrency)

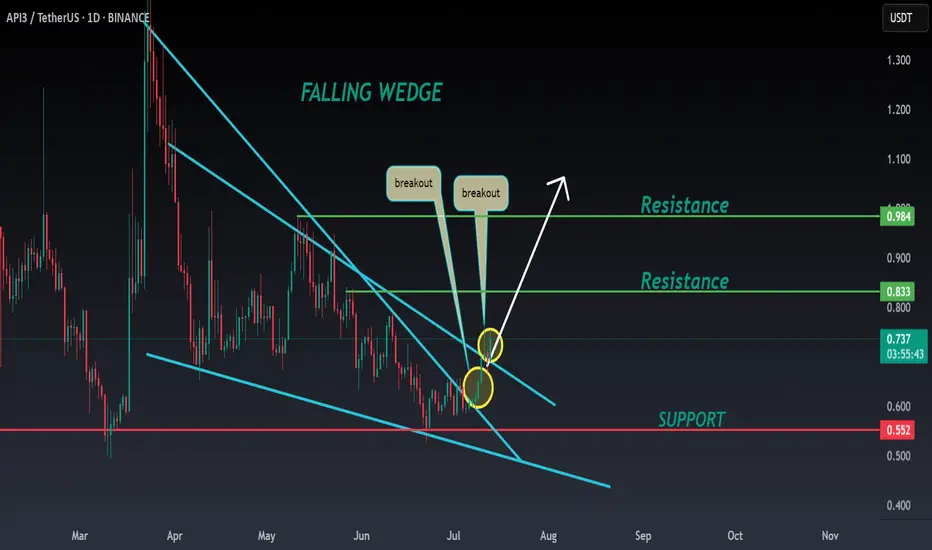
API3 ANALYSIS🚀#API3 Analysis :
🔮As we can see in the chart of #API3 that there is a formation of "Falling Wedge Pattern". In a daily timeframe #API3 broke out the pattern. Expecting a bullish move in few days if #API3 retest the levels
⚡️What to do ?
👀Keep an eye on #API3 price action. We can trade according to the chart and make some profits⚡️⚡️
#API3 #Cryptocurrency #TechnicalAnalysis #DYOR
BTC – Textbook Pullback. New ATHs. What’s Next?Back in mid-June, I published a BTC update calling for a local correction into HTF demand while most were screaming bear market and waiting for deeper breakdowns.
Price action played out exactly as forecasted.
BTC swept the $100k swing low, front-ran my first demand zone by $400, and launched into a powerful reversal — just like it did back in April, where it also front-ran the key HTF demand before rallying.
That move took us straight into new all-time highs (ATHs) — now trading comfortably around $118k.
🧠 What Happened?
✅ Liquidity sweep of the prior low
✅ Front-run demand zone (perfect HTF structure)
✅ Strong bullish reaction and higher high
✅ Confluence from USDT.D rejection at 5.25%
✅ Alts showing signs of strength as BTC rallies
The entire setup aligned perfectly across BTC, USDT.D, TOTAL, and OTHERS.D — all of which I’ve been tracking in tandem.
🔮 What Now?
With BTC now in price discovery, I expect continuation higher — but not without the possibility of a short-term pullback.
📉 A potential retest of the $108k zone isn’t off the table. This level aligns with:
- Prior breakout structure
- Range high retest
- Local demand before continuation
But even if we go straight up — I remain HTF bullish into the final phase of this cycle, supported by:
- USDT.D structure still bearish
- BTC.D showing signs of distribution
- ETH.D and OTHERS.D gaining momentum
- Altseason rotation already starting to pick up
🧭 The Macro Outlook
The 4-year cycle projection still points to a Q3 2025 top — likely between August late and September based on historical cycle timing, but this could deviate.
That gives us a window of 2–3 months for this final leg to unfold — and it’s already in motion.
Stay focused. Stick to your plan. Ride the trend, don’t chase it.
Let me know what levels you're watching next, and whether you think we get that $108k retest — or we go vertical from here.
1D:
3D:
4D:
1W:
1M:
— Marshy 🔥
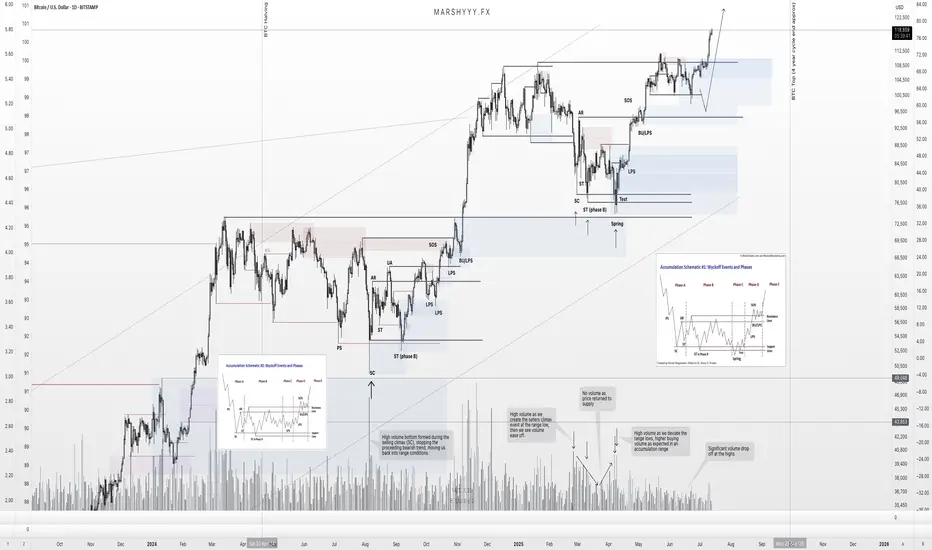
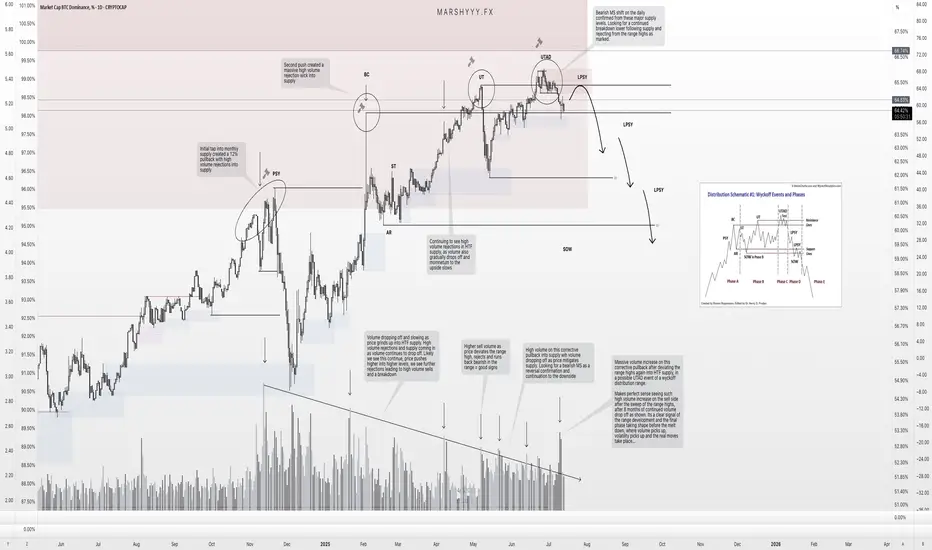
BTC.D – Distribution Confirmed. Is the Final Altseason Next?Over the past couple of months, I’ve been tracking the development of a potential high time frame (HTF) Wyckoff distribution range forming on BTC Dominance (BTC.D), and it’s now looking like that structure is starting to break down.
Back on June 14th, I noted that while we hadn’t confirmed a trend shift yet, BTC.D was showing strength and likely to push into the 65% region, with altcoin weakness to follow. The very next day, I shared my idea of a potential Wyckoff distribution forming — and since then, it’s followed that path almost perfectly.
🧠 What’s Happened Since?
✅ Sweep of the HTF range high at ~65%
✅ Second deviation of the highs
✅ Volume divergence into supply — declining volume + strong rejection candles
✅ Formation of a UTAD (Upthrust After Distribution)
✅ 1D bearish market structure break after the sweep
✅ Price now back inside the range
This is textbook distribution behaviour — even if it doesn’t follow the Wyckoff schematic to the letter, the key elements are present: deviation, volume drop-off, and structural breakdown.
🔮 What Comes Next?
BTC.D is currently holding inside a prior unmitigated daily demand, but given the structural shift, I’m expecting:
A pullback to 65–65.5% (daily supply + range high retest)
Then a continuation bearish, targeting:
🔸 49% (prior accumulation range high)
🔻 46% (FVG fill + range breakout retest)
These lower targets align with where I expect altcoins to top out — so as BTC.D breaks down, I expect capital to rotate hard into ETH and alts, triggering the final phase of altseason before the macro cycle top.
⚠️ Why This Matters
This distribution range has been developing since late 2024, and with BTC.D now showing bearish market structure, combined with:
- ETH.D flipping bullish
- OTHERS.D pushing higher
- Stablecoin dominance pairs breaking down
…we’re seeing confluence across the board for a risk-on altcoin environment.
I believe this is the setup that leads to the final euphoric altcoin rotation before the 4-year cycle top prints later this year.
📌 Watch for the retest. Watch for the rejection. The breakdown will be fast.
This is the window — time to stay sharp.
Let me know in the comments if you’ve been tracking this too, or drop your altcoin rotation picks.
— Marshy 🔥
1D:
3D:
1W:
1M:
Bitcoin - BTC | Weekly Market Recap & Outlook 13.07.2025What Happened Last Week?
Bitcoin broke out of the recent downtrend structure and established a bullish leg with clear momentum.
The breakout was supported by volume and price structure, suggesting a trend reversal rather than a temporary deviation.
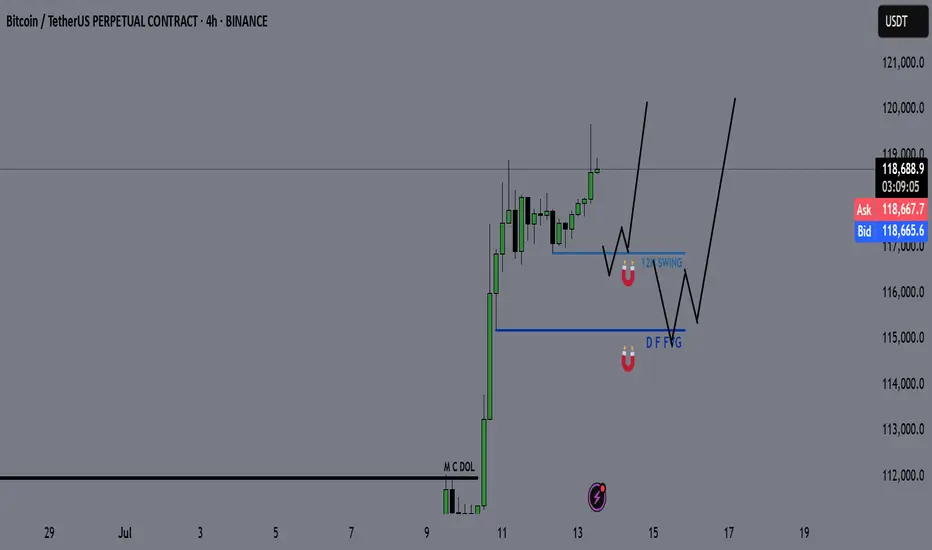
Weekly Bias and Strategy
The current outlook is bullish.
A retracement or sideways consolidation between the $120,000 and $114,000 zone is possible.
This zone may act as accumulation before further upside.
Key Points of Interest (POIs):
12H Swing Liquidity (turquoise line)
Daily FVG (blue line)
These levels will be monitored for long setups with confirmation on lower timeframes.
Macro Consideration – Fed Chairman Jerome Powell
Recent market speculation has increased regarding Jerome Powell potentially stepping down as Chair of the Federal Reserve.
If such a resignation is confirmed, it may act as a significant bullish catalyst for Bitcoin and other risk assets, possibly accelerating upside without allowing for any meaningful pullback.
Summary
• Bullish breakout confirmed
• Long bias maintained unless major invalidation occurs
• Watching retracement levels for entries
• Macro catalyst (Powell resignation) may trigger strong continuation without retrace
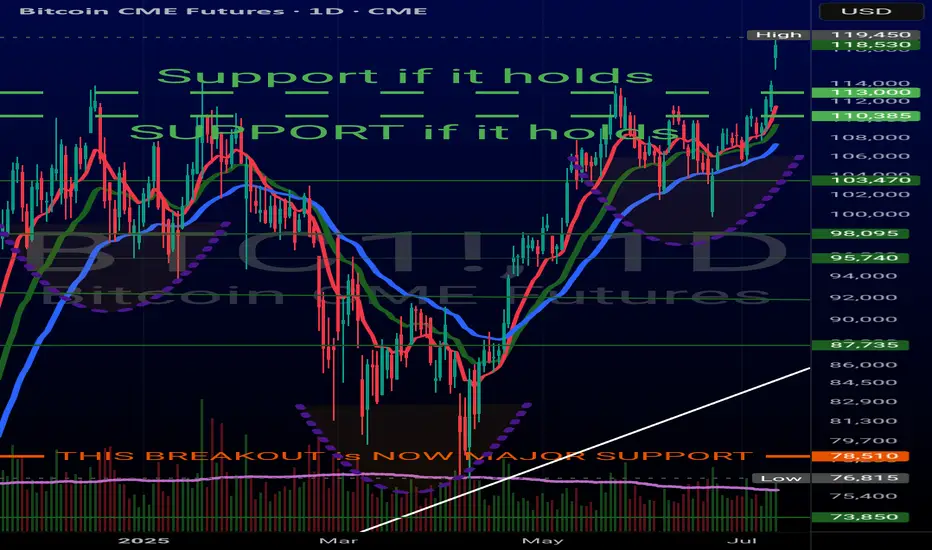
Bitcoin Roadmap=>End of RallyBitcoin ( BINANCE:BTCUSDT ) has gained nearly +10% in the recent weekly candle so far. The question is where this rally could end up. So to get to that zone, let’s go to the weekly timeframe .
Before we start this analysis, let’s take a look at my last analysis on the weekly timeframe , which was well into the Potential Reversal Zone(PRZ) . ( Analysis time: 9 JUN 2025 )
Bitcoin has now entered the Potential Reversal Zone(PRZ) and Time Reversal Zone(TRZ=June 23 to August 4) , and these zones could be the zones where this Bitcoin rally will end. Do you agree with me?
In terms of Elliott Wave theory , Bitcoin appears to be completing a main wave 5 , as the main wave 3 was an extended wave . The main wave 5 could end at the Potential Reversal Zone(PRZ) .
I expect Bitcoin to start a main correction from the Potential Reversal Zone(PRZ) and could continue to support lines and near the $105(at least) .
What do you think about the end of the Bitcoin rally?
Note: Sell orders near $120,000 are very heavy.
Note: Cumulative Long Liquidation Leverage attractive volume for liquidation.
Note: If Bitcoin goes above $130,000, it can continue to rise to the Resistance lines (near $150,000).
Please respect each other's ideas and express them politely if you agree or disagree.
Bitcoin Analyze (BTCUSDT), weekly time frame.
Be sure to follow the updated ideas.
Do not forget to put a Stop loss for your positions (For every position you want to open).
Please follow your strategy and updates; this is just my Idea, and I will gladly see your ideas in this post.
Please do not forget the ✅' like '✅ button 🙏😊 & Share it with your friends; thanks, and Trade safe.

TradeCityPro | Bitcoin Daily Analysis #127👋 Welcome to TradeCity Pro!
Let’s dive into the Bitcoin analysis and the key crypto indexes. In this analysis, as usual, I want to review the New York session futures triggers for you.
⏳ 1-Hour timeframe
In the 1-hour timeframe, as you can see, Bitcoin, after the correction down to the 116829 level, is now breaking the 118494 top again.
🔔 This move can potentially start Bitcoin’s next bullish leg. In that case, I think this leg will be a strong one because the correction was very shallow and didn’t even reach the 0.236 Fibonacci level, so the price may perform another sharp move.
💥 On the other hand, the RSI oscillator is entering Overbuy, which increases the probability of a bullish scenario and a sharp next leg.
📈 If the 118494 level is broken, we can open a long position. We already have suitable confirmations for this position since volume and RSI are aligned with price, and also the SMA25 is supporting the price and pushing it upward.
👑 BTC.D Analysis
Let’s move on to Bitcoin Dominance. The dominance trend is still bearish and continuing downward.
⭐ Currently, it’s sitting on a key support at 64.44, and breaking this level can continue the bearish move in dominance.
📅 Total2 Analysis
Let’s go over Total2. Yesterday, after correcting to the 1.26 level, it seems the next bullish move has started and it’s heading toward 1.3.
🎲 The main resistance I see for Total2 is still 1.33, and I believe this will be the main ceiling that Total2 will struggle with.
📅 USDT.D Analysis
Moving on to Tether dominance. This index is still dropping and is now sitting at the 4.36 support.
✨ Breaking this level will start the next bearish leg, and the price can move toward 4.22. If a correction occurs, the first level will be 4.49.
❌ Disclaimer ❌
Trading futures is highly risky and dangerous. If you're not an expert, these triggers may not be suitable for you. You should first learn risk and capital management. You can also use the educational content from this channel.
Finally, these triggers reflect my personal opinions on price action, and the market may move completely against this analysis. So, do your own research before opening any position.

Weekly Close Watch: Bitcoin’s Key Level Could Shift the ChartsGood morning, Guys
There's only 1 day and 13 hours left until the weekly Bitcoin candle closes.
It's crucial that this candle closes above the 112,331 level with strong volume. Anyone experienced in economics and technical analysis knows just how significant this is.
If we get that close above the level, I’ll share a powerful analysis with a clear target.
I want to sincerely thank everyone who’s been supporting my analyses with likes—your support is
my biggest source of motivation when it comes to sharing content.
Much love to you all—we’re more than just a community, we’re a family. 💛

ETH/BTC: Golden Cross Reloaded?This is ETH/BTC on the daily chart.
A major event is about to unfold: the golden cross, where the 50MA crosses above the 200MA.
The last time this happened was in early 2020, around the same price zone, right after a bounce off the 2019 low double bottom and a rejection from the 0.5 Fib level, which sits halfway between the 2019 low and the 0.786 Fib.
In 2025, we’re seeing a strikingly similar pattern:
– Price bounced off the 2019 low
– Got rejected again from the 0.5 level
– And now appears to be gathering strength to flip that level and the 200MA to confirm the Golden Cross
Always take profits and manage risk.
Interaction is welcome.

20 year long BTC analysisTaking into account the halvening and the recent bullish news of countries and big companies wanting to establish a BTC reserve. I think we can see some crazy cycles in the future.
These entities are most likely planning to hold for a minimum of 20 years. And countries won't be shy to print some extra dough for it. Some may see it as an opportunity to finally get rid of their national debt.
As long as fiat exists BTC will most likely keep going up. Its that simple.

🐋 Deep Dive Part II: Whale Behavior & Market Mastery! 🌊📚Hey Crypto Enthusiasts! 🚀
In a recent analysis, I not only nailed Bitcoin's (BTC) movement but also illuminated the subsequent altcoin surge, driven by insightful whale behavior observations. Let's merge these insights with a focus on ADA (Cardano), OP (Optimism), SOL (Solana), and BTC. 📊
Cardano's (ADA) Meteoric Rise 🌟
ADA's journey began with a break above a pivotal support-resistance level. My entry point at 0.256 turned into a remarkable rally, hitting 52 cents. This movement was a classic case of altcoin buoyancy following Bitcoin's pause.
Optimism (OP) and the Altcoin Breakouts 🌈
In the shadow of Bitcoin's stagnation, altcoins like OP exhibited significant breakouts, showcasing the shifting focus of market whales from Bitcoin to promising altcoins.
Bitcoin (BTC) and Whale Dynamics 📉
Bitcoin's behavior provided a crystal ball into the whale activities. As BTC approached a major resistance level, it signaled a strategic move by whales to divert funds towards altcoins, catalyzing their surge.
Solana (SOL) and Market Trends ☀️
Solana's chart also mirrored this trend, highlighting the broader market dynamics influenced by these significant players.
🔍 Insight on Whale Behavior:
My analysis delved deep into the whale behavior, highlighting how Bitcoin's rally and subsequent pause was a precursor to altcoin dominance. This strategic pause in Bitcoin's ascent was a clear signal for the whales to redistribute their focus and capital, sparking a remarkable rise in altcoins like ADA, OP, and SOL. 🔄
The Bigger Picture - Understanding Market Shifts: What this trend teaches us is the importance of reading between the lines. Whale movements often precede major market shifts, and by understanding these patterns, we position ourselves to make informed decisions. 🧠
Future Outlook: As we continue to monitor these market dynamics, it's crucial to stay vigilant. The crypto market is known for its volatility, and while the current trend favors altcoins, it's essential to be prepared for any shifts that may arise. Always keep an eye on key resistance and support levels, market sentiment, and global economic factors that could influence the next big move. 🌐
Together, let's stay ahead of the curve in this fascinating and ever-evolving world of cryptocurrency. Your insights and engagement are what make this journey exciting and rewarding!
One Love,
The FXPROFESSOR 💙
part 1:

BTCUSDTHello Traders! 👋
What are your thoughts on BITCOIN?
Bitcoin has recently broken above its all-time high and printed a new record high, signaling strong bullish momentum. Currently, the market has entered a consolidation phase, which is typical after such a major breakout.
A pullback toward the previous breakout level (the old all-time high) is expected, which now acts as new support.
After this consolidation and pullback, the price could resume its bullish trajectory and move toward higher targets, including the upper boundary of the current bullish channel.
As long as the price remains above the key support zone, the overall trend remains bullish and any dip could be seen as a buying opportunity within the broader uptrend.
Will this consolidation lead to the next leg up, or is a deeper correction ahead? Share your thoughts below! 🤔👇
Don’t forget to like and share your thoughts in the comments! ❤️
TradeCityPro | Bitcoin Daily Analysis #126👋 Welcome to TradeCity Pro!
Let’s dive into the Bitcoin analysis and key crypto indices. As usual, in this analysis I’ll review the potential triggers for the New York futures session.
⏳ 1-Hour Timeframe
As you can see on the 1-Hour chart, Bitcoin started a bullish move after breaking the 111747 resistance, which continued up to 118494.
✨ Currently, the price is consolidating after reaching that resistance and has formed a range box between 116829 and 118494, fluctuating within this zone.
💥 The RSI oscillator has exited the Overbuy zone and is now near the 50 level. If it drops below 50, there is a possibility of a deeper correction.
⚡️ Confirmation of a deeper correction would come with a close below the 116829 level. The next support areas will be Fibonacci levels, which I have marked on the chart.
✔️ Since the SMA25 has reached the candles and there is no significant momentum yet, we’ll need to wait for the SMA99 to approach the price to see if momentum enters the market.
👑 BTC.D Analysis
Looking at Bitcoin Dominance, yesterday it reached the 64.18 support level and managed to bounce back, closing above 64.44.
🔔 Currently, it’s consolidating above 64.81, and if this holds, the trend could turn bullish for now.
📅 Total2 Analysis
Total2’s main resistance is at 1.33, but the price was rejected at 1.3 and is now correcting toward 1.26.
🔍 If the correction continues, the 0.382 and 0.618 Fibonacci levels would be reasonable areas to watch. If the upward move resumes, the next target will be 1.33.
📅 USDT.D Analysis
Tether Dominance has had a steep drop from 4.72 and has now reached 4.36. If support holds at this level, we could see a correction back toward Fibonacci zones.
🎲 A break below 4.36 would confirm continuation of the downtrend.

bitcoin - Time to buy again!As I mentioned, the price has started the third bullish wave and has shown good growth so far, with the bullish wave still ongoing. In my opinion, the price could rise to $127k, after which it may correct to form the fourth corrective wave.
previous analysis

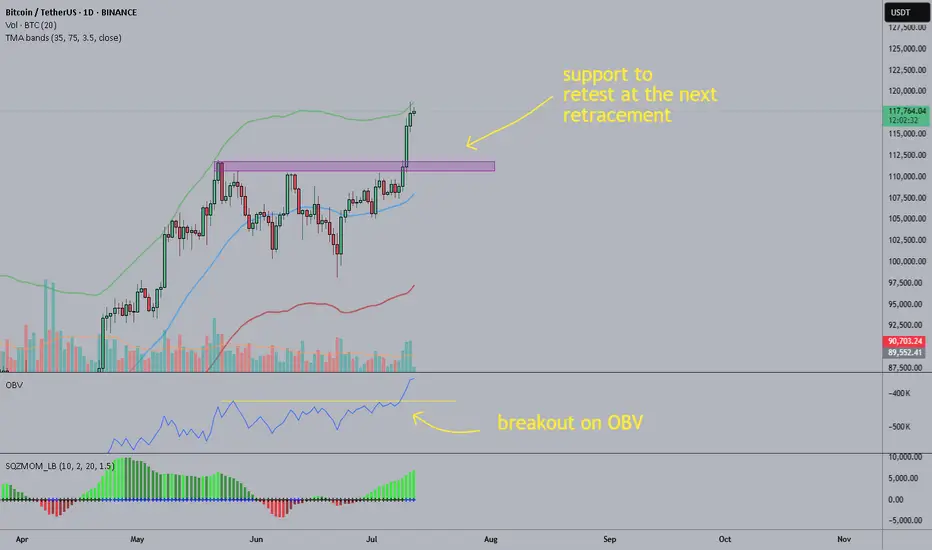
BTC: the breakout should be legitAs you can see the breakout had 3 days of rising volume and OBV also broke out so it should bne legit. On daily the upper band of the TMA bands is being tested, probably soon we'll see a retracement, I suppose the former resistance is now the support to test, however if the euphory continues we could see another peak of the price while RSI stays below the "overbought zone".
I'd look at opportunities to short although I usually don't trade BTC, I use it mostly as indicator on when to buy alts.
Good luck
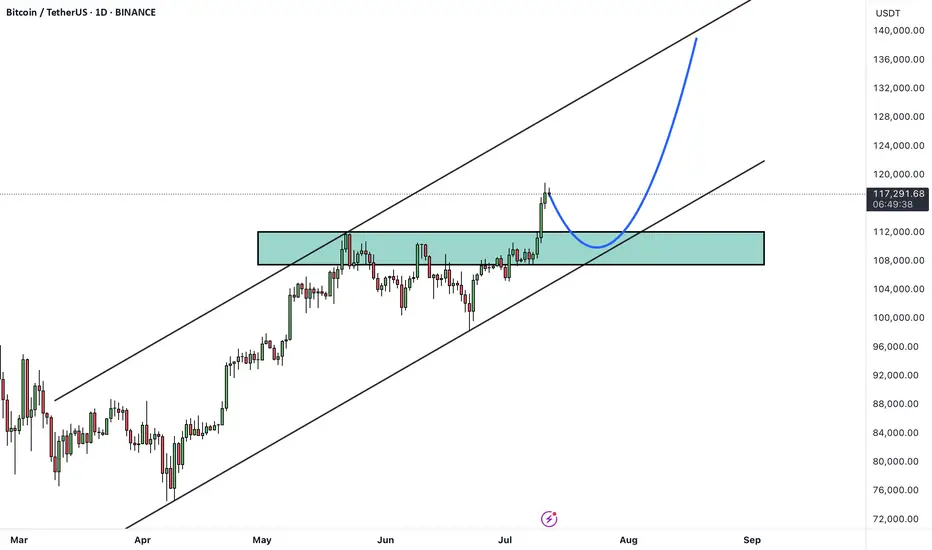
BTC is Back in Price Discovery Mode — Targeting $140K!After a clean break above the previous all-time high, Bitcoin has officially entered a new impulse phase, trading within a steep rising channel.
The green zone around the previous ATH is now acting as a strong support zone, confirming the shift in market structure.
🟠 The macro trend remains intact, and bulls are clearly in control.
🌀 Corrections continue to offer opportunities for trend-following entries, and if momentum holds, BTC could be on its way toward the $140,000 mark — the upper boundary of the macro channel.
Until then, every dip is a gift in this bullish cycle. 🔥
🧠 Trade with the trend. Manage your risk. Stay ready.
📚 Always follow your trading plan regarding entry, risk management, and trade management.
Good luck!
All Strategies Are Good; If Managed Properly!
~Richard Nasr

BTC - Falling Correction = Continuation?BTC has been playing by the rules lately!
Every time Bitcoin forms a falling correction, it turns out to be a bullish continuation pattern — and history might be repeating itself 👀
As shown on the chart:
Previous falling channels (flag/wedge structures) have consistently led to strong bullish impulses.
The current correction also appears to be a falling channel, hinting at another potential bullish leg soon.
As long as the structure holds and no major support is broken, the next target could be a new all-time high.
Let’s see if BTC continues to respect this textbook behavior.
📌 Remember: Falling corrections in an uptrend = healthy continuation!
📚 Always follow your trading plan regarding entry, risk management, and trade management.
Good luck!
All Strategies Are Good; If Managed Properly!
~Rich

SOLUSDT → Countertrend correction and hunt for liquidityBINANCE:SOLUSDT looks quite promising on the bullish side. The price is testing one of the key resistance levels within the local trend rally. A correction is forming. Is it beneficial for us?
On the higher timeframe, we see a change in character, a breakout of the trend resistance, and the formation of an upward trend support line. Bitcoin is still bullish (locally) at this time, but it is consolidating, which generally provokes a correction in SOL as well. Focus on the 150-149 area. If the bulls are able to keep the price above this zone after the retest, followed by the formation of momentum, this can be considered a positive medium-term sign.
Locally, the price within the trading range of 149.36 - 158 is heading towards the area of interest and liquidity (eql) at 149.36. The current sell-off is most likely triggered by a large player seeking a more favorable entry into the market.
Resistance levels: 154.75, 156.8
Support levels: 149.36, 147.93
In the current situation, it makes the most sense to consider an intraday trading strategy. A countertrend correction and a retest of support could attract buyers...
Best regards, R. Linda!

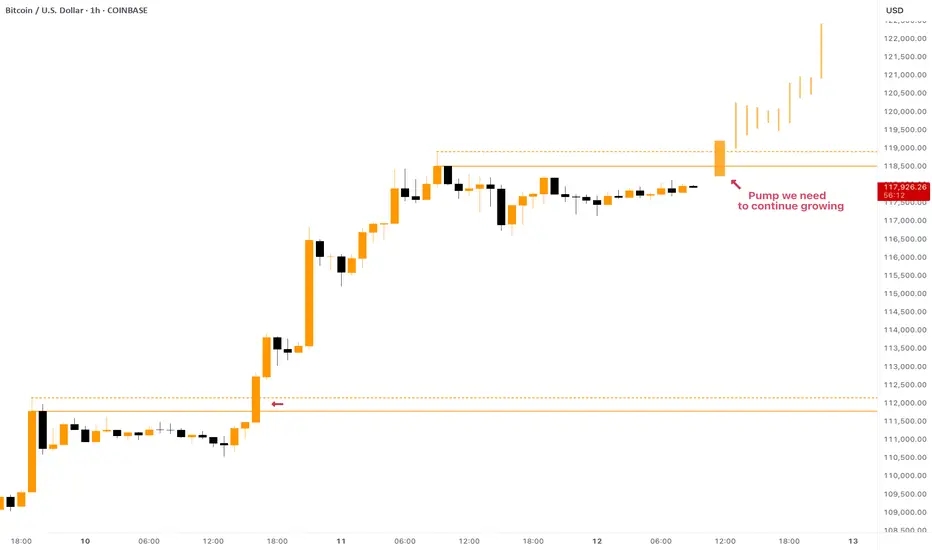
BITCOIN - Local Conditions for Growth ContinuationCRYPTOCAP:BTC showed us an astonishing growth from $108,000 to $118,000 in a few days! But what is next and where is the next target?
At the moment the price is consolidating below the ATH, in fact there are two resistances: $118,500 and $119,000. To continue pumping, Bitcoin has to break both of them with strong impulse.
To be honest , the current price development reminds me of what we've seen a couple days ago: breakout of the resistance -> consolidation below local highs -> strong breakout and growth continuation. Something similar can be expected now as well.
In the past couple of years CRYPTOCAP:BTC taught us a lesson of waiting no time to hop on the train . When it pumps - it does it quickly, just like it does it this time. So, waiting for the best entry near $109,000 - $110,000 might leave you behind while Bitcoin will be pumping towards $125,000.
Beautiful Bitcoin breakout, as called. PLEASE SEE PROFILE FOR MORE INFO!
What an absolutely gorgeous Inverse Head & Shoulder for #Bitcoin.
Had suspicion this time WAS different for #BTC.
Let's talk ROUGH ESTIMATES for social #gold.
CRYPTOCAP:BTC is no longer a hard to anticipate as it's become an institutional asset. Follow the $, volume. ETF's are performing similar. Leveraged funds, not so much
Anyway, enjoy the ride #Crypto!
btcusd bull bear when monthly crossing DMAEvery time monthly closes below DMA 200 (Daily moving average) it could be start of bear market but it came out last times there were more fake (lila arrows).
But when it croses DMA 400 then it goes into multi month sell off to DMA 1400
Currently it is close to top and start of next 400 day sell off.
Bull market lasts 1000 days

15% for MEME soonMEME is showing strength as market is bullish, I am expecting continuation with 15% minimum gain tomorrow.
NOT A FINANCIAL ADVICE
MANAGE YOUR RISK AND ALWAYS USE STOPLOSS

btcusd bull bear when monthly crossing DMAEvery time monthly closes below DMA 200 (Daily moving average) it could be start of bear market but it came out last times there were more fake (lila arrows).
But when it croses DMA 400 then it goes into multi month sell off to DMA 1400
Currently it is close to top and start of next 400 day sell off.
Bull market lasts 1000 days
