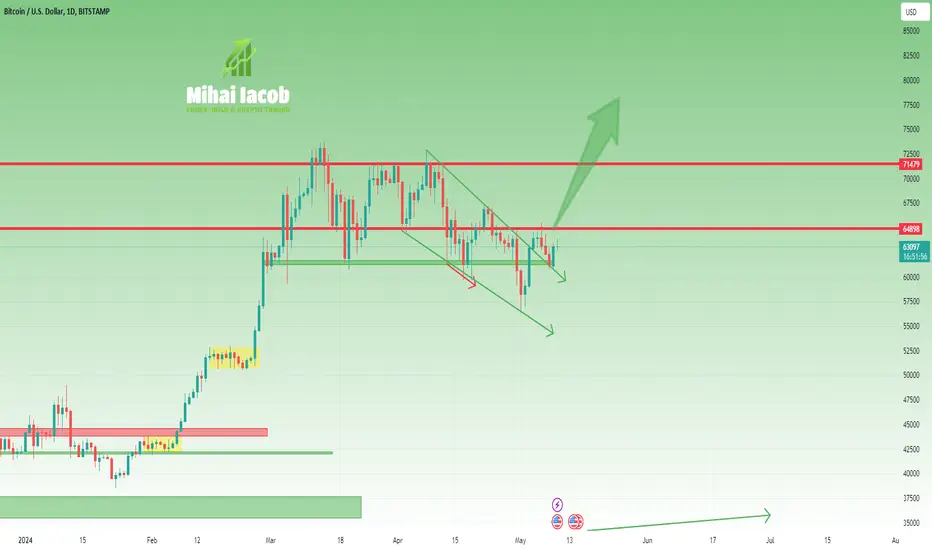
BTC LEVELS FOR LONG Currently, we received a reaction from the daily level, which was at 65k, and the price is holding for now. If at some point we see that the correction continues, the FVG located from 63k-64.5 is an excellent longa zone. Of course, we always have to be ready for both cases, below there are strong levels of 60-61k. Only below that is the possibility for 50k. Better to go step by step and follow the changes
FVG BTC-a se takodje poklapa sa daily fvg na total marketu.
Bitcoinanalysis

Bitcoin is Ready to Attack the Heavy Support zone!!!Bitcoin managed to break the Support zone($66,080_$65,860)(15-minute time frame) .
I expect Bitcoin to continue its decline to at least the previous low of $65,000 and likely break the Heavy Support zone($65,730_$64,240) .
Note: An important point you should always remember is capital management and lack of greed.
Bitcoin Analyze (BTCUSDT), 15-minute time frame ⏰.
Do not forget to put Stop loss for your positions (For every position you want to open).
Please follow your strategy; this is just my Idea, and I will gladly see your ideas in this post.
Please do not forget the ✅' like '✅ button 🙏😊 & Share it with your friends; thanks, and Trade safe.

Bitcoin Roadmap==>>FallingBitcoin is breaking the Important Support line .
According to Elliott's wave theory , Bitcoin seems to be completing wave 4 .
I expect Bitcoin to fall at least to the Potential Reversal Zone(PRZ) and attack the Support zone($65,730_$64,240) .
Note: An important point you should always remember is capital management and lack of greed.
Bitcoin Analyze (BTCUSDT), 15-minute time frame ⏰.
Do not forget to put Stop loss for your positions (For every position you want to open).
Please follow your strategy; this is just my Idea, and I will gladly see your ideas in this post.
Please do not forget the ✅' like '✅ button 🙏😊 & Share it with your friends; thanks, and Trade safe.

BTC buy setupBTC still has good momentum. Bitcoin is trading in a range.
It is expected to reject upwards when it reaches the POI.
Closing a daily candle below the invalidation level will violate the analysis.
Note that the financial market is risky, so:
Do not enter any position without confirmation and trigger.
Do not enter a position without setting a stop.
Do not enter a position without capital management.
When we reach the first TP, save some profit and try to move the stop continuously in the direction of your profit.
If you have any comments please post them, comments will help us improve our performance
Thanks

Bitcoin - On the EdgeHello everyone,
today I decided to do a quick update before I come back with Q3 update in July.
I haven't planned to do more updates this month, but I noticed something very interesting in my opinion and I think that more people should pay attention to it.
As I said before - my Base Case for Q2 was that this quartal may be the BAD time to Invest in BTC for a longer period of time due to previous experience when we had similar macroeconomic conditions. Today, we are about the same Price range, in fact, we are around 7% lower than we were at the time of that statement. So I am still going to stick with that idea until my requirements are no longer met.
Now, to the reason why I am doing this Saturday morning update...
Reason is that 20SMA & 21EMA CROSSED . It may look like nothing extraordinary we should pay attention to, but I think otherwise. Looking back on the whole History of Bitcoin, we can see that this Case didn't occur so many times, but when it did, most of the time it resulted into the decline of price in upcoming weeks/months.
For better visualization I decided to use simple Arrows, to point out the magnitude of the move before 20SMA&21EMA crossed.
- If we count the relevant Cases (ones that occurred after the STRONG upwards move) - it looks like 7 out of 7 times we experienced a significant correction in price.
- If we count all cases then it is 7 out of 11 times. In these 4 cases, we moved sideways with slightly bearish price action, BUT once we tested the price at 20SMA&21EMA and were able to hold above that price, it continued to rally to higher prices.
At this exact moment, it's hard to say with Higher% certainty which of these cases we are experiencing right now because our criteria are mixed up...
We got BOTH - strong move upside & at the same time we have been in SIDEWAYS move for several weeks already...
So I am looking for what is going to happen next week/s when we reach our 20SMA&21EMA price, because it may give us a CLEAR signal in which group we are right now.
Until then I would suggest everyone practice patience, unless you like to gamble.
Hopefully, this update was helpful for some of you in further market navigation.
If YES, please consider liking or sharing this post, it would mean a lot to me.
Also, if you are interested in more updates or you would like to receive more predictions with lower time frame updates daily, let me know in the comments or DM.
Best Regards,
Joe

Bitcoin is Ready to Attack the Resistance zone!!!Bitcoin started to rise above the Support line after the Consumer Price Index (CPI) announcement.
Currently, Bitcoin has managed to go above the Support zone($69,340_$69,000) and 100_SMA(4-hour TF) again and break the Resistance line .
According to the Elliott wave theory , Bitcoin seems to have succeeded in completing wave 4, and we should wait for Bitcoin to attack the Resistance zone($70,890_$70,140) .
I expect Bitcoin to go up to at least $70,600(Cumulative Short Positions Liquidation) .
Note: An important point you should always remember is capital management and lack of greed.
Bitcoin Analyze (BTCUSDT), 15-minute time frame ⏰.
Do not forget to put Stop loss for your positions (For every position you want to open).
Please follow your strategy; this is just my Idea, and I will gladly see your ideas in this post.
Please do not forget the ✅' like '✅ button 🙏😊 & Share it with your friends; thanks, and Trade safe.

Is it time for a Bitcoin rally?
BTCUSD :
Bitcoin is out of our flag channel but should hold above 67000.
The movement we expect from Bitcoin is to move up to the specified targets.
But we have two scenarios in mind.
1. Shorts position scenario:
If it loses the support range of 67,000, it will move to the price of 65,000
And you can wait for the price to return to 67000 for a sell position down to 63000.
2. Long position scenario:
Consider the flag is completed.
And open your position at this point for buying with a stop loss of 59800
Or to be more sure of the start of the upward trend, we should set our buy stop position at the limit of 72500 and 74000.
For the specified targets:
84
100
110

Bitcoin Roadmap==>>15-minute time frameBitcoin is moving near the Resistance zone($70,890_$70,140) .
According to the theory of Elliott waves , it seems that Bitcoin has succeeded in completing the main wave 4 . So far, the main wave 4 structure is a Zigzag(ABC/5-3-5) .
I expect Bitcoin to fall at least to the Support zone($69,280_$69,120) . If the support zone breaks , we can confirm the end of main wave 4.
This post is a continuation of the following post.
Note: If Bitcoin manages to break the Resistance zone($70,890_$70,140), The scenario will change.
Note: An important point you should always remember is capital management and lack of greed.
Bitcoin Analyze (BTCUSDT), 15-minute time frame ⏰.
Do not forget to put Stop loss for your positions (For every position you want to open).
Please follow your strategy; this is just my Idea, and I will gladly see your ideas in this post.
Please do not forget the ✅' like '✅ button 🙏😊 & Share it with your friends; thanks, and Trade safe.

Bitcoin Bull Flag: Last Hurdle for a Major Rally
Over six weeks ago, Bitcoin start forming a Bull Flag pattern. The breakout above the 20-day and 50-day Simple Moving Averages (SMAs) confirmed a low, setting the stage for a potential rally towards the Bull flag's target of approximately $100K. Fast forward to today, BTCUSD has not only surpassed these SMAs but also cleared the Ichimoku Cloud, positioning the price above the 20-day, 50-day, and 200-day SMAs. This alignment signals a bullish outlook.
Recent Price Action
Recently, Bitcoin has surged past the $71,600 mark, showing a 3.30% increase in the last 4 days. This rise is driven by renewed enthusiasm from both new and short-term investors. According to GlassNode’s latest report, the market is seeing a resurgence in speculative interest. Long-term holders (LTHs), considered the most experienced market participants, are maintaining their positions and continue to accumulate Bitcoin, indicating strong confidence in its long-term growth potential.
Technical Resistance and Support
Since its all-time high in March, Bitcoin has faced resistance at the Bull flag's upper trend line, with three failed breakout attempts in April an May. As of June 7, BTCUSD is testing this critical resistance again. A successful breakout could lead to a significant rally to $100K, while failure to clear this trend line might result in a correction towards the $54-55K range — watch carefully on SMAs an Ichimoku Cloud.
Market Sentiment
The "Sell-Side Risk Ratio" suggests that most profit-taking has already occurred within the current price range, pointing to the potential for volatile movements soon. Despite recent market consolidation, long-term holders have shown minimal selling activity, reinforcing their confidence in Bitcoin's future appreciation.
Conclusion
Bitcoin’s market outlook remains optimistic. The alignment of key SMAs and the Ichimoku Cloud supports a bullish scenario, with further gains likely as speculative interest increases and long-term holders remain steadfast. The next critical test is the $71,300 resistance level, which, if cleared, could pave the way for a substantial rally.

Bitcoin is Ready to Fall===>>Symmetrical TriangleBitcoin has managed to break the lower line of the ascending channel and is moving in a symmetrical triangle .
We can also see the Sell signal between 50_SMA(Daily) and 100_SMA(Daily) in the chart (it is a bearish sign ).
I expect Bitcoin to break the lower line of the symmetrical triangle and fall to the targets I have specified in the chart.
Important Support Zone($69,500_$68,820) : Monthly Pivot Point//Fib Cluster//100_SMA(Daily)//50_SMA(Daily) .
Note: An important point you should always remember is capital management and lack of greed.
Bitcoin Analyze (BTCUSDT), 4-hour time frame ⏰.
Do not forget to put Stop loss for your positions (For every position you want to open).
Please follow your strategy; this is just my Idea, and I will gladly see your ideas in this post.
Please do not forget the ✅' like '✅ button 🙏😊 & Share it with your friends; thanks, and Trade safe.

Unprecedented time for BITCOIN - first time in the HistoryHello everyone, last update I said that we are in an unprecedented time
for Bitcoin so I decided today to shed more light on this statement.
I said it because it is the FIRST TIME in Bitcoin History we doing something
that never happened before.
--- BITCOIN is consolidating ABOVE its MONTHLY ATH Close ---
This should be enough as a reason for everyone interested to pay some
EXTRA attention since we may experience something unexpected...
↓↓↓ more inside ↓↓↓
1M History
1W 2011
1W 2013
1W 2017
1W 2021
1W
BULLs Case
BEARs Case
1D Summary
Hopefully, this elaboration was helpful for some of you in further market navigation.
If YES, please consider liking or sharing this post, it would mean a lot to me.
Also, if you are interested in more updates or you would like to receive more predictions with lower time frame updates daily, let me know in the comments or DM.
Best Regards,
Joe

Bitcoin is Ready for PUMP to $69,000(at least)Bitcoin is currently moving near the Potential Reversal Zone(PRZ) , the lower line of the ascending channel , and the 100_SMA(4-hour TF) .
In terms of Elliott wave theory , Bitcoin seems to be completing wave C . The correction pattern is Zigzag(ABC/5-3-5) .
In terms of Classic Technical Analysis , Bitcoin is moving in a Falling Wedge Pattern .
I expect Bitcoin to rise to at least the Resistance zone($69,500_$68,820) .
Note: If Bitcoin manages to break the lower line of the ascending channel, we should wait for Bitcoin to attack the support zone ($65,730_$64,180).
Note: An important point you should always remember is capital management and lack of greed.
Bitcoin Analyze (BTCUSDT), 1-hour time frame ⏰.
Do not forget to put Stop loss for your positions (For every position you want to open).
Please follow your strategy; this is just my Idea, and I will gladly see your ideas in this post.
Please do not forget the ✅' like '✅ button 🙏😊 & Share it with your friends; thanks, and Trade safe.

Bitcoin Analysis(More fall)After Mt. Gox moved $840 million in Bitcoin to a new wallet , Bitcoin started to fall.
Bitcoin has managed to break the lower line of the ascending channel .
According to the theory of Elliott waves , it seems that the next corrective waves have started .
I expect Bitcoin to fall at least to the Potential Reversal Zone(PRZ) .
Note: An important point you should always remember is capital management and lack of greed.
Bitcoin Analyze ( BTCUSDT ), 1-hour time frame ⏰.
Do not forget to put Stop loss for your positions (For every position you want to open).
Please follow your strategy; this is just my Idea, and I will gladly see your ideas in this post.
Please do not forget the ✅' like '✅ button 🙏😊 & Share it with your friends; thanks, and Trade safe.

Eyes on $74,000Bitcoin has encountered resistance at the $71,300 level once again.
Should Bitcoin successfully break through this resistance, the next target is projected to be $74,000.

🗺️Bitcoin Roadmap🗺️⏰(15-minute time frame)⏰🌐 Bitcoin seems to have started to increase under the influence of Ethereum ETF news ➕ Inflows into Bitcoin ETFs hit $237 million on Monday .
🏃♂️ Bitcoin is currently moving near the 🔴 Resistance zone($73,780-$71,920) 🔴 and the Resistance line .
🌊According to the Elliott wave theory , Bitcoin seems to be completing microwave 4 of the main wave 5 .
🔔I expect Bitcoin to Attack the Resistance zone after the completion of micro wave 4 from the main wave 5 .
❗️⚠️Note⚠️❗️: An important point you should always remember is capital management and lack of greed.
Bitcoin Analyze ( BTCUSDT ), 15-minute time frame ⏰.
Do not forget to put Stop loss for your positions (For every position you want to open).
Please follow your strategy; this is just my Idea, and I will gladly see your ideas in this post.
Please do not forget the ✅' like '✅ button 🙏😊 & Share it with your friends; thanks, and Trade safe.

Bitcoin Analysis (It's time for Bears🐻🧸🐼)✅ As I expected , Bitcoin reached the 🔴 Resistance zone($65,700-$67,520) 🔴.
🌊According to Elliott's wave theory , Bitcoin is completing wave 5 .
💡Also, we can see Regular Divergence(RD-) between two Consecutive Peaks .
📈Looking at the Market Cap USDT Dominance% (USDT.D%) chart , I see that USDT.D% has completed its Zigzag correction(ABC/5-3-5) in the 🟢Support zone(4.72%-4.53%)🟢. We should expect at least a temporary growth of USDT.D% , which means that Bitcoin should have a minimal correction.👇
🔔I expect Bitcoin to start falling from the 🔴 Resistance zone($65,700-$67,520) 🔴 and continue falling to at least the 🟢 Support zone($65,700-$64,180) 🟢 and the 50_SMA(Daily) .
❗️⚠️Note⚠️❗️: An important point you should always remember is capital management and lack of greed.
Bitcoin Analyze ( BTCUSDT ), 2-hour time frame ⏰.
Do not forget to put Stop loss for your positions (For every position you want to open).
Please follow your strategy; this is just my Idea, and I will gladly see your ideas in this post.
Please do not forget the ✅' like '✅ button 🙏😊 & Share it with your friends; thanks, and Trade safe.

🚀Bitcoin will Go Up after Pullback🚀💡 Bitcoin managed to break the 🔴 Resistance zone($65,700-$64,180) 🔴, Resistance line and 50_SMA(Daily) yesterday.
💡 Bitcoin seems to be completing a pullback right now.
🌊Regarding Elliott wave theory , Bitcoin seems to have completed the main wave 3 above the resistance zone and is currently completing wave 4 .
📈In terms of Classic Technical Analysis , Bitcoin managed to break the resistance zone , resistance line, and 50_SMA(Daily) with the help of the Inverse Head and Shoulders Pattern . Bitcoin seems to have increased at least to the 🎯Target🎯 of this pattern.
💡Let's take a look at the Market Cap USDT Dominance% (USDT.D%) chart .
💡 USDT.D% seems to start falling after reaching the 🔴 Resistance zone(4.92%-4.87%) 🔴, which is in line with Bitcoin's analysis. ⚠️The scenario will change if USDT.D% can break the resistance zone⚠️.👇
🔔I expect Bitcoin to rise to the next 🔴 Resistance zone($65,700-$67,520) 🔴 after the completion of wave 4 (pullback) .
❗️⚠️Note⚠️❗️: If Bitcoin falls below the 🔴 Resistance zone($65,700-$64,180) 🔴, the scenario will change.
❗️⚠️Note⚠️❗️: An important point you should always remember is capital management and lack of greed.
Bitcoin Analyze ( BTCUSDT ), 2-hour time frame ⏰.
Do not forget to put Stop loss for your positions (For every position you want to open).
Please follow your strategy; this is just my Idea, and I will gladly see your ideas in this post.
Please do not forget the ✅' like '✅ button 🙏😊 & Share it with your friends; thanks, and Trade safe.

✈️Bitcoin is Ready to Pump✈️🏃♂️ Bitcoin is moving in the 🔴 Resistance zone($63,440-$62,690) 🔴
🌊According to the theory of Elliott waves , Bitcoin seems to be forming a main wave 3 (the next 5 impulsive waves).
📈In terms of Classic Technical Analysis , Bitcoin has succeeded in breaking the upper line of the Descending Broadening Wedge Pattern .
💡Looking at the chart of Market Cap USDT Dominance% (USDT.D%) , we can see that USDT.D% managed to break the Support line and expect a drop to the 🟢 Support zone(4.72%-4.53%) 🟢 as I expected in the " USDT.D% will ⚔️Attack⚔️ to Support zone again " post.👇
🔔I expect Bitcoin to rise to at least the 🔴 Resistance zone($65,700-$64,200) 🔴 and the 50_SMA(Daily) .
❗️⚠️Note⚠️❗️: An important point you should always remember is capital management and lack of greed.
Bitcoin Analyze ( BTCUSDT ), 1-hour time frame ⏰.
Do not forget to put Stop loss for your positions (For every position you want to open).
Please follow your strategy; this is just my Idea, and I will gladly see your ideas in this post.
Please do not forget the ✅' like '✅ button 🙏😊 & Share it with your friends; thanks, and Trade safe.

Quick Bitcoin Update and Revealing Exclusive Research to allHello Traders,
Checkout the latest update on Bitcoin and ETH. Also in this video i have revealed our exclusive research on Bitcoin and ETH.

Bitcoin Fail in the ⚔️Third Attack⚔️ on the Resistance zone⚠️First, I must say that the Consumer Price Index(CPI) rates will be published today ( so be careful about your positions when they are published ).
🏃♂️ Bitcoin is currently moving in the 🔴 Resistance zone($63,440-$62,690) 🔴 (this is the third time it has attacked this zone).
🌊According to Elliott wave theory , Bitcoin seems to be in corrective waves . ( If the 🔴Resistance zone🔴 breaks, the scenario will change again) .
🔔I expect Bitcoin to start going down after the completion of main wave B to complete main wave C and at least fall to the Support line .
❗️⚠️Note⚠️❗️: if Bitcoin can break the 🔴 Resistance zone($63,440-$62,690) 🔴, the scenario will be changed.
❗️⚠️Note⚠️❗️: An important point you should always remember is capital management and lack of greed.
Bitcoin Analyze ( BTCUSDT ), 15-minute time frame ⏰.
Do not forget to put Stop loss for your positions (For every position you want to open).
Please follow your strategy; this is just my Idea, and I will gladly see your ideas in this post.
Please do not forget the ✅' like '✅ button 🙏😊 & Share it with your friends; thanks, and Trade safe.

Bitcoin- Bullish Engulfing on retestAs I mentioned a few days ago, BITSTAMP:BTCUSD has broken above the descending resistance level of its downward channel. This breakout could signal the end of the recent correction.
Following the initial climb to the critical horizontal level at 65k, Bitcoin experienced another drop, testing the previously broken resistance level, which this time acted as support. Yesterday, we observed a strong bullish engulfing pattern at this level.
These are positive indicators for bulls, suggesting potential further upward movement in price. The key level to monitor is 65k, and a breakout above this level could pave the way for a new all-time high in the near future.
My outlook remains bullish.
✈️Bitcoin is Ready to Go Up✈️🏃♂️ Bitcoin is moving near the 🟡 Potential Reversal Zone(PRZ)($61,800-$60,900) 🟡 and 100_SMA(Daily) and Support lines .
🌊According to Elliott's wave theory , Bitcoin is completing corrective waves , most likely a Zigzag(ABC) corrective wave structure.
💡We can consider corrective waves in the form of a pullback to the upper line of the descending channel .
📈According to Classical Technical Analysis , Bitcoin seems to have formed a Falling Wedge pattern . ( Of course, it is not very standard ).
🔔I expect Bitcoin to start rising from the 🟡 PRZ 🟡 and at least rise to the 🔴 Resistance zone($65,650-$64,200) 🔴.
❗️⚠️Note⚠️❗️: An important point you should always remember is capital management and lack of greed.
Bitcoin Analyze ( BTCUSDT ), 1-hour time frame ⏰.
Do not forget to put Stop loss for your positions (For every position you want to open).
Please follow your strategy; this is just my Idea, and I will gladly see your ideas in this post.
Please do not forget the ✅' like '✅ button 🙏😊 & Share it with your friends; thanks, and Trade safe.

