BTC mini dump comingBtc forming ascending broadening wedge pattern. Soon it will breakdown and price will go down.
Bitcoinanalysis

⚠️Bitcoin will Go Down Again⏰(1-Hour)⏰⚠️👋Hi everyone, I hope that you have a great weekend.🥳
🌊It seems that the corrective structure of Bitcoin continues so that the Wave A had an Expanding Leading Diagonal structure, and in general, it seems that the corrective structure will be a Zigzag type(ABC/5-3-5) .
📚It is better to know that generally, on Saturdays and Sundays , Volume Trading is low , so there is a high probability that Bitcoin will move in the form of Range in the next two days and will make its main move at the beginning of next week.
💡Also, we can see Regular Divergence(RD-) between two consecutive peaks.
🔔I expect Bitcoin to eventually break back below the 🟢 Support zone($27,920-$27,800) 🟢 and once again attack the 🟢 Heavy Support zone($27,600-$27,300) 🟢 and the lower line of the Ascending Channel .
❗️ Note ❗️: If BTC can break the 🔴 Heavy Resistance zone($28,440-$28,060) 🔴, the scenario will change.
--------------------------------------------------------------------------------
🌐➕ Positive News ➕🌐:
Spot Bitcoin ETFs Could Send BTC Skyrocketing by Over 3,200%, Says InvestAnswers Host.
Bitcoin miners Marathon, Riot, CleanSpark increase BTC output in September.
Hong Kong crypto VC opens $100M fund for Asian blockchain startups.
Robert F. Kennedy Jr. Pledges to Protect Bitcoin When President.
🌐➖ Negative News ➖🌐:
JPEX converts user stablecoins to native token without notice: Report.
Ledger lays off 12% of staff, citing ‘macroeconomic headwinds’.
Binance Losing Market Dominance at Rapid Pace.
Dark Side Of Crypto: $7 Billion Laundered Across Chains, According To Elliptic.
--------------------------------------------------------------------------------
Bitcoin Analyze ( BTCUSDT ), 1-hour time frame ⏰.
Do not forget to put Stop loss for your positions (For every position you want to open).
Please follow your strategy; this is just my Idea, and I will gladly see your ideas in this post.
Please do not forget the ✅' like '✅ button 🙏😊 & Share it with your friends; thanks, and Trade safe.

Bitcoin will ⚔️Attack⚔️ to Downtrend line⏰(15_min)⏰👋Hi, everyone.
🏃Bitcoin is running on 🟢 Heavy Support zone($27,600-$27,300) 🟢 and 🟡 Price Reversal Zone(PRZ) 🟡.
🌊In terms of Elliott wave theory , Bitcoin seems to be completing a Zigzag Correction(ABC/5-3-5) so that wave B could end at 🟡 Price Reversal Zone(PRZ) 🟡.
🔔I expect Bitcoin to Attack the Downtrend line in the coming hours to complete Wave C .
--------------------------------------------------------------------------------
🌐➕ Positive News ➕🌐:
The user account "Satoshi" says that he/she will publish documents to prove her identity in 2024 (On Twitter).
Bitcoiner drops BitVM paper — Bringing Ethereum-like contracts to Bitcoin.
Weekly Crypto Inflows Surge by 370%, According to CoinShares.
Bitcoin’s exchange balance plummets to five-year low.
Arthur Hayes Says AI and Historic Money Printing Will Create ‘Most Epic’ Bull Market for Crypto.
Former BlackRock Manager Says Prepare For $17.7 Trillion Inflow Into Bitcoin If This Happens.
Bitcoin is a ‘super logical’ step on the tech tree — OpenAI CEO.
Bitcoin Is Better Than Digital Gold: Matrixport.
South Korea’s Crypto Market Cap Leaps to $21.1 Billion in H1
🌐➖ Negative News ➖🌐:
Binance users in Hong Kong lose $450K in wave of fraud texts: HK police.
Huobi & KuCoin Added to UK Warning List for Operating Without Registration.
Binance Losing Market Dominance at Rapid Pace.
Instagram’s Stance on Bitcoin: Why Accounts Get Suspended.
Bitcoin Could Plunge by Nearly 50%, According to Crypto Analyst Nicholas Merten – Here’s Why.
Stablecoin Market Hits 2-Year Lows In Terms Of Market Cap – What’s Going On?
Bitcoin Mining Giant Bitmain Halted Employee Salaries.
--------------------------------------------------------------------------------
Bitcoin Analyze ( BTCUSDT ), 15-minute time frame ⏰.
Do not forget to put Stop loss for your positions (For every position you want to open).
Please follow your strategy; this is just my Idea, and I will be glad to see your ideas in this post.
Please do not forget the ✅' like '✅ button 🙏😊 & Share it with your friends; thanks, and Trade safe.

Bitcoin Possible Short Squeez IncomingBitcoin grabbed a big liquidity to the downside and now the liquidity at 28K is more than 1 Billion. will btc comes back to retake 28K ? Watch this to find out
Thanks for your support

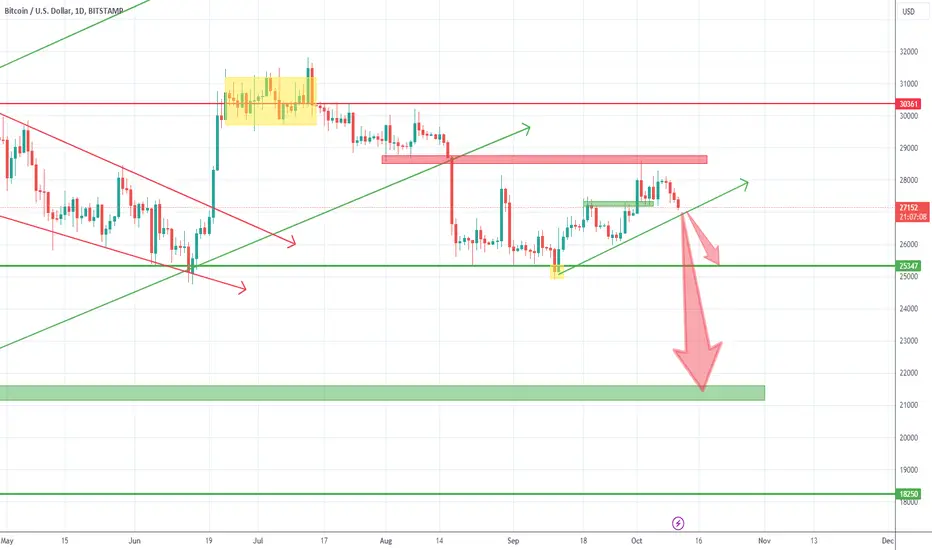
Bitcoin could dive soonAfter the reversal from 25k and the reach of my target at 28.500, Bitcoin started to consolidate.
Friday we had a new attempt to reconquer resistance and bulls failed again and BtcUsd started to fall again.
At the time of writing the price sits on confluence support, but the structure is not bullish at all and we could witness a break down
In such an instance, the first target for bears is 25k horizontal support, but, in the longer-term 21k is not out of the question.
I'm bearish on BTC as long as the price is under 28.500
Bitcoin Consolidation Could Endup 26.2KBitcoin been consolidating and while there is liquidity to the upside we could see another leg down today.
Thanks for watching

Bitcoin Weekly Review And Scenarios!BTC Did what we expected on out last week preview. can it follow the target to 29.7 for another weekly high clear out ?
Extreme To Upside : 29.7K
Extreme To Lowside : 23.8K
Thanks for watching

Bitcoin will ⚔️Attack⚔️ to Heavy Support Zone⏰(1-Hour)⏰✅Bitcoin seems to have succeeded in forming an Ascending Broadening Wedge Pattern .
🌊Regarding Elliott waves , corrective waves in the Ascending Broadening Wedge Pattern follow the Double Three Correction structure(WXY) .
🔔After breaking the lower line of the wedge pattern, I expect Bitcoin to fall at least to 🟡 Price Reversal Zone(PRZ) 🟡and break the 🟢 Heavy Support zone($27,600-$27,300) 🟢.
❗️ Note ❗️: Corrective waves can continue; we can Confirm the end of corrective waves in the 1-hour time frame after breaking the 🟢 Heavy Support zone($27,600-$27,300) 🟢.
--------------------------------------------------------------------------------
🌐➕ Positive News ➕🌐:
Satoshi Nakamoto (Bitcoin creator) woke up after 5 years! (in Twitter).
Ethereum Futures ETFs Debut on Low Volumes.
Blockchain finance to grow into $79.3B market by 2032
CBDC lays foundation for new global monetary system: French central bank.
Elon Musk Believes Fiat Money is a Scam.
Hong Kong Stock Exchange launches settlement platform powered by smart contracts
🌐➖ Negative News ➖🌐:
Peter Schiff: ‘We Are Still Early in the Biggest Bond Market Crash in U.S. History’.
--------------------------------------------------------------------------------
Bitcoin Analyze ( BTCUSDT ), 1-hour time frame ⏰.
Do not forget to put Stop loss for your positions (For every position you want to open).
Please follow your strategy; this is just my Idea, and I will gladly see your ideas in this post.
Please do not forget the ✅' like '✅ button 🙏😊 & Share it with your friends; thanks, and Trade safe.

Bitcoin Crawling To Upside For Another Leg UpBTC yesterday had a sudden dump which is now getting slowly retraced.since we touched 28.1 lots of orders moved to 28.5 now, taking that level could result in a new legup.A New method to look at market too
Thanks for watching

🚧Bitcoin will Go Down Again🚧🔨Bitcoin started to rise from the 🟢 Heavy Support zone($25,280-$23,900) 🟢 and was able to break the Downtrend line yesterday.
✅Also, Bitcoin has managed to form an Ascending channel .
🏃♂️Bitcoin is currently moving in the 🔴 Resistance zone($28,460-$28,000) 🔴 near the SMA(100) and near the upper line of the ascending channel .
💡Also, we can see the Regular Divergence(RD-) between Price and Volume.
🌊In terms of Elliott Waves , Bitcoin managed to complete the main corrective wave A at the 🟢Heavy Support zone($25,280-$23,900)🟢 and is currently completing the main wave B.
📚Since the main wave A is five microwaves, we have to wait for the Zigzag correction(ABC/5-3-5) , and the higher the end of the main wave B is at higher prices, we expect the main wave C to be weaker.
📚☠️ Death Cross Signal ☠️: The death cross appears on a chart when an asset's short-term Moving Average(MA) , usually the 50-day, crosses below its long-term moving average, usually the 200-day.
🔔I expect the microwave C of the main wave B to finish at the 🔴 Resistance zone 🔴 or at the 🟡 Price Reversal Zone(PRZ) 🟡, and then Bitcoin will ⚔️ Attack ⚔️ the lower line of the ascending channel.
Bitcoin Analyze ( BTCUSDT ), Daily time frame ⏰.
Do not forget to put Stop loss for your positions (For every position you want to open).
Please follow your strategy; this is my Idea, and I will gladly see your ideas in this post.
Please do not forget the ✅' like '✅ button 🙏😊 & Share it with your friends; thanks, and Trade safe.

Bitcoins next 6 months outlookBitcoin is still clearly in the bear market and won't make it's initial big push out for 6 months most likely. This should be good news to you if you are stacker. The bears have a strong hold over price action, but as we can see on the RSI, the hold is weakening with bullish divergence forming in this underling indicator that simply determines "relative strength". If bitcoin maintains this divergence you can expect a very quick price pop up by the end of the month (seems likely) . The down trend resistance levels are color and thickness coded by strength. Each time any one is conquered, meaning a break above and stay above, our attention is then focused on the next one until all are broken and defeated.
Stronger to weaker
RED
ORANGE
GREEN
BLUE
Thanks for looking at my chart and leave a comment on what you think. My chart is educational analysis and is not to be taken as financial advice. We are all here to make money and limit our risk is the best way to do so. Contrary to the news, from what the chart is showing us... it's telling us that risk is low, the RSI has bottomed and showing signs of strength.
* Bear markets are buyers markets, Bull markets are sellers markets*
PS: The arrows are only examples
Once again... thanks,
WeAreSat0shi
Stay Blessed!

Bitcoin Wants To Retake 28.1K For Higher Price!BTC cleared 27.8 yesterday and now consolidating for a bigger move which in my opinion is to the upside. could perform a liquidity grab to the downside as well.
Thanks for watching

Bitcoin will go UP to my 🎯Target🎯⏰(15Min)⏰🏃Bitcoin is running on 🟢 Heavy Support zone($27,600-$27,300) 🟢 and 🟡 Price Reversal Zone(PRZ) 🟡.
🔔I expect Bitcoin to rise toward the 🎯 Target 🎯 that I specified in my chart after breaking the 🔴 Resistance zone 🔴.
❗️ Note ❗️: if Bitcoin goes below the 🟢 Heavy Support zone($27,600-$27,300) 🟢 we have to expect that Bitcoin will go down more.
--------------------------------------------------------------------------------
🌐➕ Positive News ➕🌐:
In general, October has been a good month for cryptocurrencies.
Ethereum Futures ETFs Debut on Low Volumes.
Grayscale Moves to Convert Its Ethereum Trust to a Spot ETH ETF
🌐➖ Negative News ➖🌐:
Peter Schiff: ‘We Are Still Early in the Biggest Bond Market Crash in U.S. History’.
Stablecoin Economy Sheds $1.52 Billion in September, Revisiting a 2-Year Low.
This Crypto Exchange Reportedly Suffered a $13 Million Hack
--------------------------------------------------------------------------------
Bitcoin Analyze ( BTCUSDT ), 15-minute time frame ⏰.
Do not forget to put Stop loss for your positions (For every position you want to open).
Please follow your strategy; this is just my Idea, and I will be glad to see your ideas in this post.
Please do not forget the ✅' like '✅ button 🙏😊 & Share it with your friends; thanks, and Trade safe.

Bitcoin Big Liquidity Till 28.1KBitcoin is crawling back up to 28.1K.can it make it there to take the big liquidity or it will get rejected and collapse to 25.9K at least
thanks for watching

Bitcoin BTCUSDT Price Analysis (8h)Bitcoin Price Action Update:
Yesterday, Bitcoin retraced to the triangle breakout zone, indicating a potential retest.
This move aligns with a surge in buying volumes according to on-chain data, sparking optimism.
If validated, a market rise could be imminent. Keep an eye on the $29,000 resistance; it might offer an excellent profit-taking opportunity for short-term traders. Stay vigilant and trade wisely.📈💰
👇 Long-term analysis chart 👇

Bitcoin Analysis - Will History Repeat Itself?Hi traders..
Bitcoin's October Rally: Will History Repeat Itself?
October has traditionally been a bullish month for Bitcoin, with notable price surges since 2013. The only exceptions were in 2014 and 2018.
This year follows a similar pattern. Bitcoin showed stability leading up to the October 1st weekly close, having surpassed the previous month's end with minimal volatility.
However, as the week concluded, Bitcoin experienced a sudden surge, propelling its price just shy of $28,000. Shortly after, it reached new heights, hitting $28,451 on Bitstamp.
As of October 1st, the leading cryptocurrency has seen a 4.5% increase, based on data from allmost markets on TradingView.
A closer look at the numbers reveals not only positive returns for Bitcoin in October but also an impressive average return rate of over 15% during this month historically.
Considering this data and the average return rate, there is a compelling argument for Bitcoin's price potentially reaching approximately $32,500. Following this, it might reach a price between $34,000 and $35,000 in October.
However, it's crucial to note the volatility of the crypto market. Bitcoin's price fluctuates due to factors such as supply and demand, investor sentiment, government regulations, and media hype, all contributing to its volatility.
Note:
In essence, while Bitcoin has a strong historical performance in October, there are no guarantees for this year. Investors must conduct thorough research before making any investment decisions.
BINANCE:BTCUSDT BITSTAMP:BTCUSD Bitcoin vs US Dollar
⚠️ Disclaimer: The following insights reflect my personal perspective on the market, relying on publicly available information and historical data. While some opinions stem from my actual trades, others do not. I am not a financial advisor, and I bear no responsibility for your trading choices.
✅ Feel free to reach me out with any questions or recommendations. I am more than willing to assess and analyze any currency pair or index that piques your interest.

Bitcoin More Bullish Signals For 29.4!Bitcoin yesterday pump cleared weekly high and performed a SL hunt to 28.5, after that NY retraced it all back and In My Opinion we will crawl up today then jump to 29.4 at least. Could go to 26.9 or 26.8 but losing that level will send it down to 25.1.
Thanks for watching

Bitcoin will go UP by Bullish 🏁Flag🏁 Pattern⏰(15Min)Hi guys, I hope that you had a great weekend.🥳
✅Bitcoin seems to have managed to break the Important Resistance line ( at least temporarily ) and is currently completing a pullback to this line.
🏃Currently, Bitcoin is moving near the 🟢 Support zone($27,100-$27,040) 🟢and SMA(100) .
🏁In terms of classic technical analysis, it seems that Bitcoin has succeeded in forming a Bullish Flag Pattern .
🌊The structure of the waves inside the Flag is the Double Three Correction(WXY) type.
🔔I expect Bitcoin to rise toward the 🔴 Resistance zone($27,600-$27,300) 🔴 after breaking the upper line of the descending channel .
❗️ Note ❗️: if Bitcoin goes below the 🟢 Support zone($27,100-$27,060) 🟢 we have to expect that Bitcoin will go down more.
--------------------------------------------------------------------------------
🌐➕ Positive News ➕🌐:
In general, October has been a good month for cryptocurrencies.
🌐➖ Negative News ➖🌐:
New U.S. Bill Proposes Enhanced Oversight for Cryptocurrency Transactions
Gemini Crypto Exchange Exits Dutch Market.
Major Exchange Experienced $116 Million in Outflow in Ethereum, Bitcoin, and USDT.
Fornite Developer Cuts 16% of Workforce Amid Metaverse Revenue Shortfall.
SEC Files Lawsuit Against FTX Auditor.
--------------------------------------------------------------------------------
Bitcoin Analyze ( BTCUSDT ), 15-minute time frame ⏰.
Do not forget to put Stop loss for your positions (For every position you want to open).
Please follow your strategy; this is just my Idea, and I will be glad to see your ideas in this post.
Please do not forget the ✅' like '✅ button 🙏😊 & Share it with your friends; thanks, and Trade safe.

Bitcoin hit our 28.1K.Will It Hold ?Bitcoin cleared 28.1 as I mentioned in my previous videos.can we go to 29.4 today ? or we lose this and retrace it all back ? watch this to findout
Thanks for your support

Bitcoin will Attack to Important Resistance line Again🚀⏰(15Min)🔄Bitcoin made some changes in its waves after yesterday's pump .
🌊In terms of Elliott waves , Bitcoin seems to be completing wave 4 with the Double Three Correction (WXY) .
🔔I expect Bitcoin to attack the Important Resistance line and 🔴 Resistance zone($27,600-$27,300) 🔴again in the coming hour.
Bitcoin Analyze ( BTCUSDT ), 15-minute time frame ⏰.
Do not forget to put Stop loss for your positions (For every position you want to open).
Please follow your strategy; this is just my Idea, and I will be glad to see your ideas in this post.
Please do not forget the ✅' like '✅ button 🙏😊 & Share it with your friends; thanks, and Trade safe.

🚨Bitcoin will Go Down to support lines again🚨⏰(1-Hour)⏰✅Bitcoin reacts well to 🟡 Price Reversal Zone(PRZ) 🟡 and 🟣 Weekly Pivot Point 🟣.
🔔I expect Bitcoin to decline from the 🟡 Price Reversal Zone(PRZ) 🟡 to the support lines and 🟢Support zone($26,240-$26,000)🟢 again.
--------------------------------------------------------------------------------
🌐➕ Positive News ➕🌐:
Ethereum futures ETFs could start trading next week — Bloomberg analyst.
Crypto Exchange Kraken to Explore Stock Trading: Bloomberg.
Gemini invests $24M for expansion in India.
Shanghai publishes blockchain plan to support trade, metaverse, government affairs.
6th Swiss bank joins SDX crypto exchange.
🌐➖ Negative News ➖🌐:
Bitcoin miner Marathon mines invalid block in failed ‘experiment’.
Binance's CZ Could Face Criminal Charges: WSJ
Binance fully exits Russia with sale to CommEX.
Bitcoin Miner Selling Pressure Mounts as Hash Rate Peaks.
--------------------------------------------------------------------------------
Bitcoin Analyze ( BTCUSDT ), 1-hour time frame ⏰.
Do not forget to put Stop loss for your positions (For every position you want to open).
Please follow your strategy; this is just my Idea, and I will be glad to see your ideas in this post.
Please do not forget the ✅' like '✅ button 🙏😊 & Share it with your friends; thanks, and Trade safe.

BTC Possible Movements For Next Week!BTC weekly review and possible scenarios for both LONG and SHORT for next week.
New Extreme Level upside is 29.6 and to downside is 23.8
Thanks for watching

BTC 28.1K Target Remains To Be SweepedOur Targets which were 26.8 and 27.3 are hit. now we are wating to see if bitcoin has the strenght to clear out Previous Week High (PWH) at 28.1K.After that we either consolidate at the top or retrace the whole move back.
Thanks for watching
