Bitcoin Grabbing Lower Liquidation For Higher Price.Bitcoin Grabbed the high leverage longers and now is ready to go higher.PPI today could bring more volatility to the market.Still rooting for 32K.could happen today or tomorrow then a drop in volume on weekends like always.
thanks for watching
Bitcoinanalysis

Bitcoin and Symmetrical Triangle🚩(15-Min)⏰Bitcoin has managed to form a Symmetrical Triangle Pattern in the last 24 hours.
Since the symmetrical triangle is considered a continuation pattern most of the time, But we must be ready for both movements. In case of breaking any of the symmetrical lines, we must expect Bitcoin to move up to the Top or bottom of the Rectangle Pattern .
What do you think❗️❓
Which of the lines of the symmetrical triangle pattern will Bitcoin break❗️❓
Bitcoin Analyze ( BTCUSDT ), 15-minute time frame ⏰.
Do not forget to put Stop loss for your positions (For every position you want to open).
Please follow your strategy, this is just my Idea, and I will be glad to see your ideas in this post.
Please do not forget the ✅' like '✅ button 🙏😊 & Share it with your friends; thanks, and Trade safe.

Bitcoin 32K This Week Then Huge Rejection Will FollowBitcoin spiked up to 31K yesterday triggering lots of Stop losses and grabbing liquidity,making the way to the upside clear for today.first 32K touch will have a nice rejection in my opinion
Thanks for watching

Bitcoin- 35k could be nextSince the beginning of the year, Bitcoin is in an up trend contained in a nice rising channel, and after the break of the corrective falling wedge that followed the high of the year, the price rose again and for 3 weeks already is consolidating in this 30k zone.
This consolidation has formed a rectangle pattern which normally is a continuation pattern.
I expect this to be the case now and a new leg up will follow after the break above resistance.
35k is my target for BTC

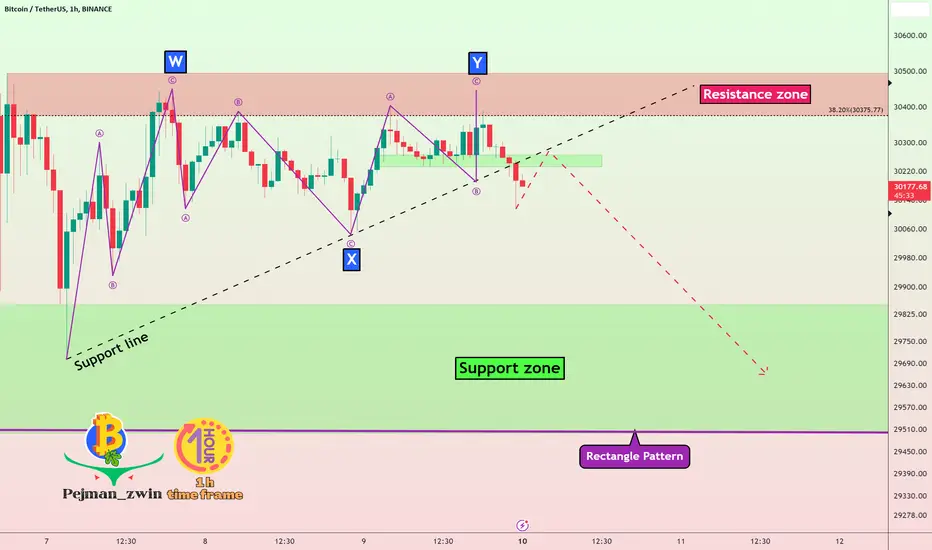
✂️Bitcoin LOST the support line✂️(1-hour time frame)It seems that Bitcoin managed to complete the correction structure of Double Three Correction(WXY) in the last three days.
The 💡 Sign 💡 of the completion of the Double Three Correction structure can be the breaking of the support line .
➕Also, if we look at the RSI indicator in the 1-hour time frame, we can see the 🗻Double Top Pattern🗻 , and I expect the RSI to move downward in the coming hours .👇
🔔I expect Bitcoin to attack⚔️ the 🟢 support zone($29,860-$29,420 )🟢 again after breaking the support line .
Bitcoin Analyze ( BTCUSDT ), 1-hour time frame ⏰.
Do not forget to put Stop loss for your positions (For every position you want to open).
Please follow your strategy, this is just my Idea, and I will be glad to see your ideas in this post.
Please do not forget the ✅' like '✅ button 🙏😊 & Share it with your friends; thanks, and Trade safe.
Bitcoin Holding Low 30K For A Pull Up Or A Crash!BTC holding 30K after blackrock refiled the application.At the same time BTC looks very weak.will this 30K hold become bullish or bulls are out of breath ?
Thanks for watching

#Bitcoin stagnant; will BTC bears force prices below $30k?Past Performance of Bitcoin
Bitcoin prices were technically unmoved over the weekend, looking at price charts. Therefore, while there was a notable contraction on July 6 at the back of expanding volumes, the rejection on July 7 relieved buyers. Still, from an effort-versus-result perspective, sellers have the upper hand in the short term. This can only change if buyers flow back, reversing the June 6 loss at the back of rising trading volumes.
#Bitcoin Technical Analysis
The path of least resistance remains to be northwards despite the current consolidation, from a top-down preview. Prices are boxed inside a $1.5k zone with caps at around $29.8k and $30k on the lower end, and $31.3k on the upper end. As it is, BTC prices are inside a developing bull flag where volumes are relatively light. Therefore, unless there is a conclusive close with rising volumes confirming sellers of July 6 below $29.8k, buyers of the second half of June are in control. For now, aggressive sellers may search for entries, unloading on attempts higher but below $31.3k with targets at $30k and $29.8k in the short term.
What to Expect from #BTC?
For now, traders should be patient considering the light trading volumes and the failure of bulls to wipe losses of July 6 that skews price action in favor of sellers. This formation could be a precursor for more losses this week, slowing down the upside momentum, especially if prices dip below the $29.8k and $30k support zone.
Resistance level to watch: $31.3k
Support level to watch: $29.8k
Disclaimer: Opinions expressed are not investment advice. Do your research.

💡Signs of the FALL of Bitcoin(4-hour time frame)💡Bitcoin has NOT seen an upward or downward Sharpie movement for about 12 days and is moving in the form of a Range market ; this Range movement generally causes the formation of a Rectangle pattern .
Bitcoin is currently moving above the rectangle pattern and the 🔴 resistance zone($31,420-$31,220) 🔴.
💡 Signs 💡 of Bitcoin falling again from the resistance zone can be candlestick patterns: Hanging Man , Shooting Star , and Marubozu Candle .
Also, if we look at the RSI indicator , we can see that there is a strong Regular Divergence (RD-) between two consecutive peaks inside the rectangle pattern. In addition, the RSI indicator seems to be issuing one of the most reliable sell signals, the Bearish Failure Swing .👇
🔔I expect Bitcoin to fall to at least the 🟢 support zone($29,860-$29,420) 🟢 and the bottom of the rectangle pattern after breaking the uptrend line .
Bitcoin Analyze ( BTCUSDT ), 4-hour time frame ⏰.
Do not forget to put Stop loss for your positions (For every position you want to open).
Please follow your strategy, this is just my Idea, and I will be glad to see your ideas in this post.
Please do not forget the ✅' like '✅ button 🙏😊 & Share it with your friends; thanks, and Trade safe.

#Bitcoin Falters and Drops 2%, BTC Bulls Find Support at $30kPast Performance of Bitcoin
Bitcoin is lower when writing, dropping towards the $30k level. The sell-off stems from developments on July 6 and follows a refreshing surge to $31.3k before tumbling to spot levels. Despite traders--and the general BTC structure supporting buyers, the failure of buyers to push prices above the April high is a concern. Subsequently, the series of lower lows registered this week could fast-track the dump toward $30k or worse in future sessions.
#Bitcoin Technical Analysis
The path of least resistance, from the top-down preview, is northwards—but this is fast changing considering the sell-off of the past few trading days. The support zone between $29.8k and $30k is critical for now. Moreover, the long-upper wick of July 6 suggests that sellers are firm, and there could be more room for bears to press on today. Still, conservative traders can wait until there is a clear breakout below $29.8k before committing. In that case, a clean break with expanding volumes may open up BTC for a retest of $28.3k. Conversely, a recovery reversing yesterday's loss may be the base for a retest of $31.3k.
What to Expect from #BTC?
BTC is weak and could reverse recent gains posted in early July. At spot rates, the odds are high for more sell-off below $29.8k. Based on this formation, risk-on traders should wait for a clear definition below $29.8k, or $31.3k, before riding the emerging trend.
Resistance level to watch: $31.3k
Support level to watch: $29.8k
Disclaimer: Opinions expressed are not investment advice. Do your research.

#Bitcoin in a Bullish Formation with Caps at June 2023 HighsPast Performance of Bitcoin
Bitcoin prices slipped on July 6 but remain bullish, per the formation in the daily chart. At spot rates, the coin remains within a consolidation, moving tightly inside a $1.5k zone with caps at $31.3k and $29.8k on the lower end. Technically, buyers have the upper hand, but there can be more upsides if traders shake off the current weakness and boost prices above immediate liquidation levels.
#Bitcoin Technical Analysis
The June 30 doji bar defines the current trade range. Even though prices increased in early July, there must be a conclusive break above $31.3k for buyers to be in control. As it is, the consolidation might offer entries for aggressive buyers loading the dips. However, being on the cautious side, conservative, risk-on traders can wait for a clean, high-volume breakout in either direction before riding. Any confirmation of buyers above $31.3k may see BTC rise to $32.5k in a buy trend continuation formation. Conversely, losses below $29.8k cancel this upbeat forecast, paving the way for sellers angling for $28.3k, and lower.
What to Expect from #BTC?
Traders are confident, but the failure of higher highs in the past few days has been heaping pressure on bulls and slowing down the uptrend. Nonetheless, there could be more upswings should BTC break $31.3k.
Resistance level to watch: $31.3k
Support level to watch: $29.8k
Disclaimer: Opinions expressed are not investment advice. Do your research.

Bitcoin decline after completion of pullback(1-hour time frame)Hi everyone👋 (Reading time less than 2 minutes⏰).
First, I recommend you look at the 4-hour Bitcoin chart I shared yesterday.👇
Bitcoin started to decline after contacting the upper line of the rectangle pattern ; the first support in front of Bitcoin was the uptrend line .
Bitcoin managed to break the uptrend line (as I expected in yesterday's post) and started to go down and managed to break the 🟢 support zone($30,700-$30,560) 🟢 a few hours ago.
Bitcoin is currently completing a pullback to the broken 🟢 support zone($30,700-$30,560) 🟢.
Also, the 20 Simple Moving Average (20-SMA) went below the 60-SMA , which is a sell signal , and the resistance in front of the Bitcoin are 20-SMA and downtrend line , which has reacted well to this extreme move in the previous two minor pivots .
🔔I expect Bitcoin to fall to at least the 🟢 support zone($29,860-$29,420) 🟢 and the bottom of the rectangle pattern.
Bitcoin Analyze ( BTCUSDT ), 1-hour time frame ⏰.
Do not forget to put Stop loss for your positions (For every position you want to open).
Please follow your strategy, this is just my Idea, and I will be glad to see your ideas in this post.
Please do not forget the ✅' like '✅ button 🙏😊 & Share it with your friends; thanks, and Trade safe.

#Bitcoin Bulls Firm, Primary Support at $30kPast Performance of Bitcoin
Bitcoin prices are steady and bullish despite the contraction on July 4. Overall, the $31.3k remains a critical buy trigger level. For the uptrend of June's last few trading days to continue, there must be a comprehensive, high-volume close above this level. Even so, aggressive traders could find entries to load on dips above $30k in the days ahead.
#Bitcoin Technical Analysis
BTC prices broke higher on July 3, but buyers failed to maintain yesterday's uptrend. At this pace, the uptrend remains despite the losses. Technically, in a bullish formation led by the July 3 bar following consolidation, traders can look to buy the dips above $30k with targets at $31.3k and later $32.5k. Conversely, conservative traders can wait for a clean break above April highs while targeting $32.5k or $35k. Any loss below $30k will slow down buyers, and BTC could drop toward $28.3k in a cool-off.
What to Expect from #BTC?
Buyers are upbeat, but this can change if BTC continues falling today. The uptrend remains, but there can be more gains above $31.3k in future sessions, validating the June 21 and 23 bull bars.
Resistance level to watch: $31.3k
Support level to watch: $30k
Disclaimer: Opinions expressed are not investment advice. Do your research.

Bitcoin Printed The 8H Exhaustion candle.Down Side ImminentBitcoin printed 8H candle stick that shows exhaustion in the market and will start the sell off
the video is about btc mostly but I published it while being on ETH.fix this tradingview let us choose what category we want it.OHN JEEZUS KRIST
Thanks for watching

#Bitcoin Firm, Buyers Targeting New 2023 Highs to $32.5kPast Performance of Bitcoin
Bitcoin prices are firm when writing, floating above the FWB:31K level as the recent consolidation proves to be an accumulation. How fast bulls will push above $31.3k and even new 2023 highs will determine the speed of the rebound after the slowdown in the final days of the last days of H1 2023.
#Bitcoin Technical Analysis
From the daily chart, the path of least resistance is northwards from an effort versus result perspective. Presently, buyers have the upper hand, and this forecast holds, provided prices are floating above the $29.8k support level. Considering the expansion yesterday, traders can look for long entries, buying the dips and looking to align with the short-term uptrend set in motion by the June 21 anchor bar. As it is, BTC buyers may look for $32.5k and $35k as immediate targets.
What to Expect from #BTC?
Buyers are optimistic, and this holds, reading from the candlestick arrangement. Overall, the uptrend remains, and every low above $29.8k and $30k support zone provides entries for determined traders. BTC is likely to start July from a stronger footing at this pace, registering new 2023 highs.
Resistance level to watch: $32.5k
Support level to watch: $29.8k
Disclaimer: Opinions expressed are not investment advice. Do your research.

#Bitcoin Bulls Confident, Will The Uptrend Continue?Past Performance of Bitcoin
Based on the candlestick arrangement in the daily chart, bitcoin prices are in a tight range. Even though the uptrend remains, the past few trading sessions have been volatile, but prices remain within the $31.3k and $29.3k zone. Therefore, the rejection of lower prices could support bulls. However, conservative traders can opt to watch price action unless there is a clear close above June highs.
#Bitcoin Technical Analysis
The uptrend remains since prices are above the $29.8k and $30k tight support zone. Technically, every low above this zone may offer entries for aggressive traders. Note that prices are volatile, and there are dojis indicating that the market is balanced. Nonetheless, the dropping upside momentum and the failure of buyers to press higher over the weekend cast doubt on the strength of bulls. For now, unless there is a conclusive close above $31.3k, risk-on traders can opt to keep track of price action. On the other hand, gains/losses above or below $31.3k or $29.8k, respectively, may shape the near-term formation.
What to Expect from #BTC?
Buyers are optimistic since the overall, medium-term trend points to supportive price action favoring bulls. Still, bulls can only commit once there are conclusive breakouts above crucial resistance/support levels in the coming sessions.
Resistance level to watch: $31.3k
Support level to watch: $29.8k
Disclaimer: Opinions expressed are not investment advice. Do your research.

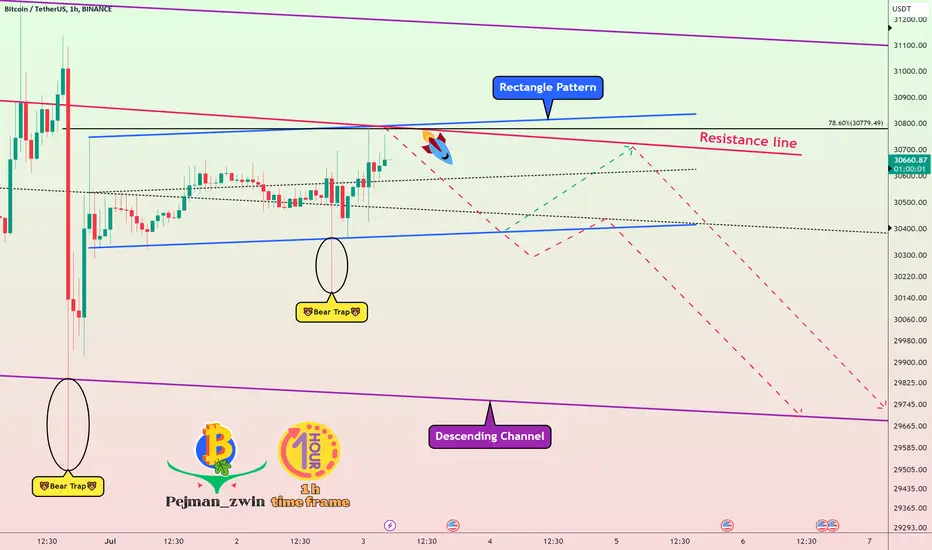
🚨Bitcoin Falls to the bottom of the Descending Channel🚨Bitcoin managed to form a Rectangle Pattern on Saturdays and Sundays when the trading volume was low.
I expect Bitcoin to react to the upper line of the rectangle pattern and the resistance line as the week begins and Bitcoin to fall to the bottom of the descending channel.
Bitcoin Analyze ( BTCUSDT ), 1-hour time frame ⏰.
Do not forget to put Stop loss for your positions (For every position you want to open).
Please follow your strategy, this is just my Idea, and I will be glad to see your ideas in this post.
Please do not forget the ✅' like '✅ button 🙏😊 & Share it with your friends; thanks, and Trade safe.
Bitcoin Analysis: Unleashing the Bullish SurgeWe predicted that Bitcoin would lead the way!
Bitcoin experienced a significant upward breakout with substantial trading volume, reaching levels not seen since mid-March. This leads me to believe that Altcoins will soon follow suit.
As Bitcoin gains momentum, the entire market tends to experience growth.
However, it's important to note that when Bitcoin temporarily pauses or retraces, Altcoins tend to see a surge in value.
It's crucial to keep in mind that market fluctuations, shakeouts, and volatility are all part of the journey towards higher prices.
Remember that the overall trend is characterized by higher highs and higher lows, indicating long-term growth.
Although Bitcoin is currently exhibiting a bullish trend, it's worth considering that we might still witness a significant correction or consolidation phase before the next full-blown bull market emerges.

Bitcoin Performed A Spiky Dump! Real Or Jebait ?Bitcoin can consolidate here and even make a new high before a complete crash.
These 3 upcomin days very important specially sunday due to quarterly close
Thanks for watching

#Bitcoin Bulls Firm, BTC Stuck in a Choppy Sideways ConsolidatioPast Performance for Bitcoin
Based on the performance in the daily chart, bitcoin prices remain volatile and choppy. Even though the primary trend remains northwards, there are hints of weakness, looking at the candlestick arrangement. The only positive is that sellers have been unable to break below the $29.8k and $30k primary support. The $31.3k is a liquidation level to watch out for.
#Bitcoin Technical Analysis
The uptrend remains, and prices are inside a bull flag, looking at the performance in the daily chart. The consolidation remains, but the breakout direction would shape the short-to-medium-term trend. For now, conservative traders can wait until there is a clear trend definition, aware that gains above $31.3k would likely pump the coin to $32.5k or better. Conversely, sharp losses below $29.8k invalidate the current preview, possibly allowing the coin to retest $28.3k and later $27k.
What to Expect from #BTC?
Buyers are optimistic, but the current formation points to balanced price action. The overall trend, set by events in the last weeks of June, dictates price action. Aggressive, risk-off traders may load as prices move sideways, aligning with the primary trend if prices are above $29.8k.
Resistance level to watch: $31.3k
Support level to watch: $29.8k
Disclaimer: Opinions expressed are not investment advice. Do your research.

Bitcoin potential bottom in placeLooking for further upside into wave {iii} as we seem to have a potential bottom in place.
We reached 61.8% of (c) vs. (a), where we ideally would have liked to reach equality. Looking for further upside and a break of wave (b) to then look for longs, or else we could double correct lower.
Feel free to ask me questions and trade safe!

#Bitcoin Consolidates, BTC Resistance Remains At $31.3kPast Performance of Bitcoin
At spot rates, there is nothing to write home about BTC. Prices remain within a consolidation, moving below $31.3k and above the primary support zone at between $29.8k and $30k. Even though buyers are optimistic, the rejection of higher highs can be a concern for bulls. Still, with prices consolidating horizontally, the breakout direction could shape the short-to-medium-term trajectory.
#Bitcoin Technical Analysis
Buyers are confident; every low should theoretically provide entries for buyers targeting $31.3k or better. The rejection of higher prices on June 28 was with light volumes. Therefore, the uptrend remains from an effort-versus-result perspective unless there are deep losses below $30k. Conversely, there could be a reprieve if there are gains above $31.3k. Before committing, conservative, risk-on traders can wait for definitive, high-volume breakouts above/below $31.3k and $29.8k, respectively.
What to Expect from #BTC?
Traders are closely watching how price action unfolds in the daily chart. As it is, the path of least resistance is northwards at least from a top-down preview. Even so, the weakness in the recent retracement questions the strength of buyers. Therefore, while bulls remain in control, a break below last week's lows could define the immediate trend for Bitcoin.
Resistance level to watch: $31.3k
Support level to watch: $29.8k
Disclaimer: Opinions expressed are not investment advice. Do your research.

BITCOIN's situation+next targets and expected movements!!❗The BTCUSDT is in a Bullish phase by reaching a PRZ zone.
➡️The Major support for the daily time frame will be 28300$ or between the 0.5 to 0.618 fib level.
➡️Short Term Resistance are 31k to 31.300$.
➡️ Bitcoin and the market is bullish, but it needs corrections to the right points to form bases and the next movement step.
➡️Also Bitcoin created Double top in daily time frame that's very important.
🌟 Bullish signals in the PRZ area are:
- Support zone
-Double Top
⭐ Note if the PRZ is broken downwards with the strength of Bearish candles from the bottom , this analysis of ours will be failed.
⏮️Previous Analysis:
✅If this post was useful for you, like it ❤️ and if you think it is useful for your friends, be sure to send it to them.
_ _ _ _ _ _ _ _ _ _ _ _ _ _ _ _ _ _ _ _ _ _ _ _ _ _ _ _ _ _ _ _ _
🌍Thank you for seeing idea .
Have a nice day and Good luck.

#Bitcoin Soaks Selling Pressure; Will BTC Rally Above $31.3k?Past Performance of Bitcoin
Bitcoin is roughly 20% from June 2023 lows and resilient, soaking selling pressure, looking at the performance in the daily chart. Even though there were attempts for lower lows, prices are firm above the $30k psychological level and $29.8k. Meanwhile, the coin is defying selling pressure and may break above $31.3k in the days ahead in a buy trend continuation formation.
#Bitcoin Technical Analysis
Traders are upbeat, but BTC, at the moment, remains inside a horizontal range with caps at $31.3k and $29.8k support. Unless there is a comprehensive, high-volume close above last week's highs, conservative, risk-on traders can wait for trend definition. Only after then can they search for loading entries to buy on dips in a buy trend continuation formation that could lift BTC towards $32.5k. Even so, BTC remains within a bullish formation, and the contraction from last week has formed a minor bull flag. The uptrend will be valid if prices are inside the June 21 to 23 trade range.
What to Expect from #BTC?
Risk-off traders can load on dips, expecting Bitcoin to resume the uptrend. Traders are bullish, but this can change if the upside momentum is not sustained above the $29.8k primary support level.
Resistance level to watch: $31.3k
Support level to watch: $29.8k
Disclaimer: Opinions expressed are not investment advice. Do your research.
