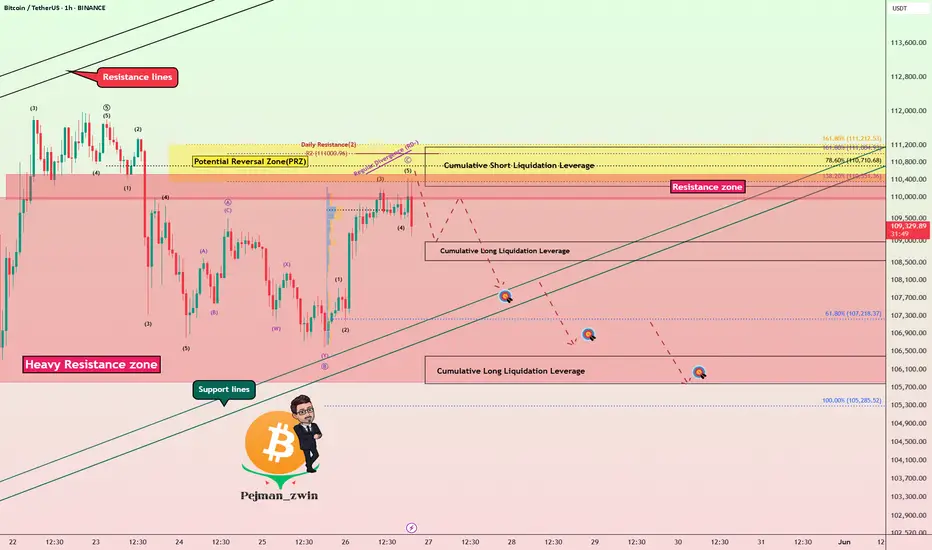
Bitcoin Bounce on Trump Tariff Delay – Short Setup Still Valid!Bitcoin ( BINANCE:BTCUSDT ) started to fall as I expected in the previous idea , and declined near the Support lines .
Bitcoin started pumping after the news that " US President Trump agreed to postpone 50% EU tariffs until July 9th ." Do you think this pumping of Bitcoin will continue?
Bitcoin is trading in a Heavy Resistance zone($110,000-$105,800) near the Potential Reversal Zone(PRZ) .
From the Elliott Wave theory perspective , Bitcoin appears to be in corrective waves , which is why I am labeling this idea as a ''Short''. The corrective waves structure is of the Expanding Flat(ABC/3-3-5) type.
I expect Bitcoin to attack the Support lines once again, and if these lines are broken, it will decline to the Targets I have indicated on the chart.
Notes :
MicroStrategy bought another 4,020 Bitcoins, but it didn't have much of an impact on the market.
If the Bitcoin price falls back below $109,000, about $185 million in long Bitcoin positions will be liquidated . = Attractive for exchanges
Bitcoin 2025 Conference to be Held in Las Vegas, Tuesday-Thursday = Could Cause Market Excitement .
Note: If Bitcoin touches $112,080, we should expect more pumping.
Please respect each other's ideas and express them politely if you agree or disagree.
Bitcoin Analyze (BTCUSDT), 1-hour time frame.
Be sure to follow the updated ideas.
Do not forget to put a Stop loss for your positions (For every position you want to open).
Please follow your strategy and updates; this is just my Idea, and I will gladly see your ideas in this post.
Please do not forget the ✅' like '✅ button 🙏😊 & Share it with your friends; thanks, and Trade safe.
Bitcoinanalysis
LongTerm BITCOIN LINEAR chart & NUPL tells a story -August Top
We can start with the main chart.
This is a LONG TERM LINEAR chart, showing the price action Directly, unaltered by mathmatics,
Long Term charts usualy are shown by logarithmic charts.
Linear and logarithmic trading charts differ in how they represent price changes. Linear charts display equal price changes the same, making them suitable for short-term traders focusing on exact price movements. On the other hand, logarithmic charts show percentage changes, which makes them better for long-term investors or volatile assets, as they help in analyzing trends and patterns more clearly over time.
This chart starts just before the 2017 ATH and you can easily see the line that rejects ATH and how PA is up near that area right now.
Things to note are the day count from 2017 ATH to 2021 Final ATH and the day count between that double Top in 2021.
These numbers are projected to our current cycle and show we are near the projected Top using this style of Chatr, The Log charts project further into the year.
It may also be worth noting how the 50 EMA (red) was used by PA after the Drop after the first ATH, to bounce back up to the next ATH at the end of that year.
We have just done exactly the same again, PA was rejected by that long term Line and Dipped down to the 50 EMA and has since bounced back up to the rejecting line.
IS REJECTION LIKELY NOW? [/b
This is something that is impossible to answer with any real Fact But we can look at data and make eductaed projections.
PA has the ability and strength right now, to range high, running up under this line of rejection until it becomes overbought on the long term MACD, RSI , TSI etc
But something that will absolutely decide when the top is in is the Profit taking by Holders.
We are currently seeing Selling taking place and we can see the potential profit by looking at NUPL
NUPL, or Net Unrealized Profit/Loss, is an indicator used in trading to measure the difference between unrealized profits and losses in the Bitcoin market.
Here is the chart from all the way back to 2010
Lots to see here but to summerise.
See how there are Peaks each cycle of Maximum available profit. The point where profit taking Tops out is arrowed. This area, up to the red line, shows us the TOP zone.
What is VERY noticable this cycle is how we have not yet reached that upper Red line.
Sellers appear to be taking theor profits earlier.
The upper day counts have been consistant in the past, with 2 double tops of potential profit before the selling sold it all off.
Many people, including me, have been saying "This time is different" and this is VERY clearly shown here by the fact that we have already had the 2 peaks of potential profit and we are currently climbing to the 3rd
This has NEVER happened before and, technicaly, this could continue.
The Lower day counts are from Mid Double Tops to the Next Mid double top of potential profits mentioned above,
The Next "Mid point" is projected to be around July.
This NUPL also shows ua how the high level of potentia profits was reached Quicker this cycle than previously. This was helped by the Corporations buying Early and Massive amounts, putting Large numbers of coins into profit
In Conclusion [/i
We have the Linear Bitcoin chart pointing towards a JULY / August Top
We have the NUPL also pointing towards a July / August Mid point of Potential profits.
If you loo cloely, BOTH charts, using differnet data, suggest 28 July
What also maybe worth considering here is how we see that Potential profits are reducing in availability. As the asset becomes more expensive to buy, it also gets harder to push the price higher and so make more profit. I,E. It was eaier to double the price of Bitcoin when it was $50 a coin
Of course, non of this may play out, Things ARE DIFFERNT but I have now decided to have another plan ready for August and we need to wait and see what happens Next
BE PREPARED FOR ALL POSSIBILITIES

BTC finds support around ATHsBitcoin is potentially finding support around $107k after making new ATHs last week around $112k.
Assuming these levels as S and R, a strong break could signal the direction of price in the coming days.
If local support is lost, we can expect price to at least test $104.9k.
Assuming the bullish momentum continues, breaking resistance would signal higher prices. Still in tact, a continued bull flag breakout from $104.9k (20 May) could still put BTC at around $115k.

BTCUSD Rejection Setup – Order Block Hit, Weak Lows in Sight!📉 BTCUSD is setting up a textbook bearish reversal — Smart Money style.
This 1H chart shows Bitcoin tapping into a high-timeframe Order Block at ~$104,190–104,560, with a clear rejection from the premium zone and confluence with the upper trendline.
📊 Technical Breakdown:
✅ Order Block tapped at $104,190–104,560
✅ Strong rejection candle near the trendline resistance
✅ Price failed to break above the Strong High — a sign of Smart Money distribution
✅ Targeting Sell-Side Liquidity at $101,420
✅ Final target? Weak Low and liquidity pool around $99,189
🔍 Smart Money Confluence:
Price has moved into a premium selling zone, aligning with the upper bounds of market structure
Order Block rejection suggests institutional selling interest
Weak lows below $100K are prime targets for liquidity grabs
Retail longs are likely trapped — ideal conditions for a downward sweep
🧠 Institutional Logic:
Smart Money doesn’t chase price — it delivers it. This move likely represents a "Mitigation and Distribution" phase before a deeper selloff:
📌 Mitigation of previous long positions inside the OB
📌 Distribution at the highs before targeting the next liquidity pool
📉 Trade Idea:
Short Entry Zone: $104,200–104,500
Targets:
TP1: $101,420 (Sell-side Liquidity)
TP2: $100,000 (Psych level / Weak Low)
TP3: $99,189 (Liquidity Magnet)
Invalidation: Clean break and close above $104,800 (above the OB and Strong High)
🧠 Tip for Traders:
Wait for a confirmation bearish structure shift or lower high on the LTF (15m/5m) before entering full size. Smart Money leaves clues — not impulses.
💬 Comment "BTC Setup" if you’re trading this drop
🔁 Save this analysis — this is how Smart Money dominates crypto markets.

Bitcoin Lines- What you can see if you remove Bars and replace them by Lines ?
- Congratulation, you just removed the noise in the chart.
- Everything is in graph.
- Covid19 Black Swan included.
- Not a price prediction.🤷♂️.
Happy Tr4Ding !

Bitcoin Be Setting Bull Trap?_Breakout Without High VolumeBitcoin ( BINANCE:BTCUSDT ) started to fall yesterday after forming a new All-Time High(ATH) with high volume , but started to rise again. One of the reasons for Bitcoin’s sudden drop yesterday was the sharp drop in the S&P 500 ( SP:SPX ) index .
First of all, I must say that Bitcoin’s situation is a bit complicated and difficult to analyze , so pay more attention to money management. Be prepared for any scenario.
Bitcoin is trading above the Resistance zone($109,588-$105,820) and near the Resistance lines and Cumulative Short Liquidation Leverage($113,020-$111,833) . What is worrying is that the break of the Resistance zone($109,588-$105,820) was NOT accompanied by high volume , suggesting a bull trap is possible .
I see a correction to at least Cumulative Long Liquidation Leverage($109,972-$108,609) given the low breakout volume for Bitcoin and the large sell orders in the upper prices for Bitcoin .
--------------------------------------------
Today, the Flash PMI data from the U.S . came in stronger than expected:
Flash Manufacturing PMI: 52.3 (vs. forecast 49.9, previous 50.2)
Flash Services PMI: 52.3 (vs. forecast 51.0, previous 50.8)
Analysis :
Both numbers exceeded expectations, signaling stronger economic activity in the U.S. This is bullish for the USD( TVC:DXY ) and could put short-term downward pressure on Bitcoin, as it lowers the chances of near-term Fed rate cuts.
--------------------------------------------
Do you think Bitcoin is completing a Bull Trap or should we expect Bitcoin to increase further?
Note: If Bitcoin breaks above $114,500 with high momentum, we can expect Bitcoin to rise to near $119,000.
Please respect each other's ideas and express them politely if you agree or disagree.
Bitcoin Analyze (BTCUSDT), 1-hour time frame.
Be sure to follow the updated ideas.
Do not forget to put a Stop loss for your positions (For every position you want to open).
Please follow your strategy and updates; this is just my Idea, and I will gladly see your ideas in this post.
Please do not forget the ✅' like '✅ button 🙏😊 & Share it with your friends; thanks, and Trade safe.

Bitcoin’s Pump to NEW ATH($109,845) Ends in High-Volume ReversalBitcoin ( BINANCE:BTCUSDT ) moved towards the targets as I expected in my previous idea , although it faced pump and dump moves in reaching the targets .
Bitcoin managed to create a new New All-Time High(ATH=$109,845) but immediately began to decline on high volume .
Bitcoin is trading in the Resistance zone($109,588-$105,860) and near the Resistance lines , Monthly Resistance(2) .
In terms of Elliott Wave theory , Bitcoin was able to complete main wave 5 .
I expect Bitcoin to fall to at least $102,200 AFTER breaking the Support zone($105,100-$104,140) , and the possibility of further declines is very high .
Also, on the 1-hour timeframe of the USDT.D% ( CRYPTOCAP:USDT.D ) chart, a bullish and regressive Falling Wedge pattern is visible , with its upper line broken.
Do you think Bitcoin can finally create a NEW All-Time High(ATH) Again!?
Note: If Bitcoin touches $110,100, we should expect a pump.
Please respect each other's ideas and express them politely if you agree or disagree.
Bitcoin Analyze (BTCUSDT), 1-hour time frame.
Be sure to follow the updated ideas.
Do not forget to put a Stop loss for your positions (For every position you want to open).
Please follow your strategy and updates; this is just my Idea, and I will gladly see your ideas in this post.
Please do not forget the ✅' like '✅ button 🙏😊 & Share it with your friends; thanks, and Trade safe.

Bitcoin vs Resistance Zones | Fake Breakdown Below the Channel!Bitcoin ( BINANCE:BTCUSDT ) has been moving up and down with high momentum over the past 24 hours and finally fell below the lower line of the ascending channel . Is this break of the lower line of the ascending channel valid?
Bitcoin is trading near the Resistance zone($105,100-$104,140) , Cumulative Short Liquidation Leverage($104,478-$103,941) . Since the volume of breaking of the lower line of the ascending channel is NOT high, the probability of a fake break is very high (in my opinion).
In terms of Elliott Wave theory , the structure of the main wave 4 seems to be an Expanding Flat(ABC/3-3-5) . The main wave 5 could lead to the formation of a new All-Time High(ATH ).
One of the reasons why I think we saw a Fake Break below the lower line of the ascending channel is that I think the S&P500 Index ( SP:SPX ) will trend upward , and given the high correlation between Bitcoin and S&P500 Index these days, we can expect Bitcoin to increase .
I expect Bitcoin to start rising again AFTER breaking the Resistance zone($105,100-$104,140) and touch the targets I have indicated on the chart.
Note: If Bitcoin touches $101,800, we can expect more dumps.
Please respect each other's ideas and express them politely if you agree or disagree.
Bitcoin Analyze (BTCUSDT), 1-hour time frame.
Be sure to follow the updated ideas.
Do not forget to put a Stop loss for your positions (For every position you want to open).
Please follow your strategy and updates; this is just my Idea, and I will gladly see your ideas in this post.
Please do not forget the ✅' like '✅ button 🙏😊 & Share it with your friends; thanks, and Trade safe.

Bitcoin Hourly Analysis (2H)Given Bitcoin's rapid movement near previous highs, along with quick pump-and-dump action and liquidity grabs, it's expected that the liquidity pool below the price will be swept, collecting orders from the green zone, and then price may reverse back to the upside.
A 4-Hour candle closing below the invalidation level will invalidate this analysis.
For risk management, please don't forget stop loss and capital management
Comment if you have any questions
Thank You

BITCOIN Daily Bullish / Bearish days ahaed with Big push after
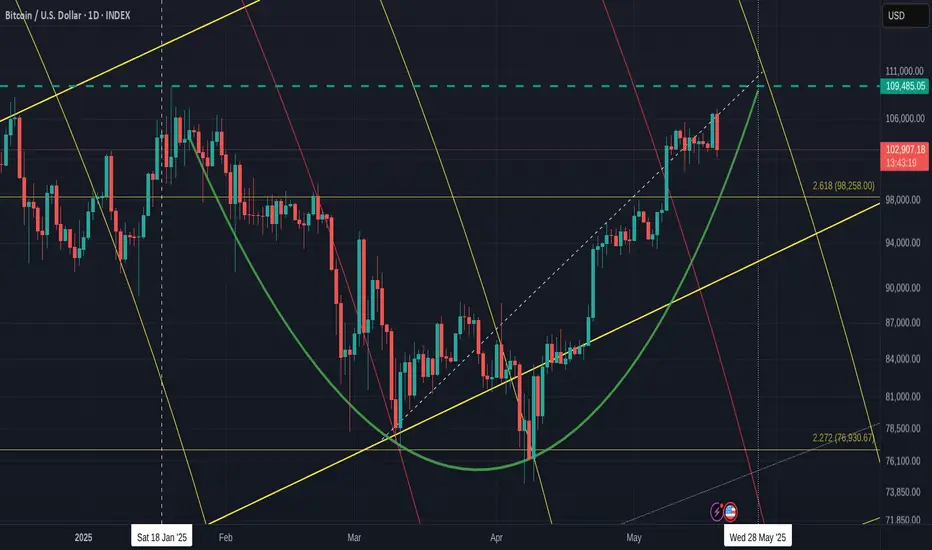
Even though I have mentioned that we maybe in for some RED days this week, this chart shows how, ultimately, we are in a Bullish momentum still.
The CUP pattern that we have printed ( adjusted since I last posted this) , Goes from ATH line back to the ATH line.
We also see how there is this APEX that PA has fallen into that has its peak at the end of this month.
PA always reacts before the APEX
But before this, we may range across or drop down onto the CUP. This has Strong support and could possibly propel PA above thaT ATH line.
We do need to also understand, there is a 618 Fib circle at this intersection and that may not be easy to break through.
But PA has often searched out intersections of resistance to break through and so I am looking to this as the way forward.
The 2.618 Fib Ext on this chart may also offer support at around 98K if we loose support higher.
The RSI is already dropping from OverBought and so will probably continue to do so till we reach Neutral / Over Sold again.
And the Daily MACD, is also turning Bearish, But as mentioned before, this is possibly repeating what happened in Nv 2024
See the Arrow on the left...The Histogram is the one to take note of. Two Green peaks and then a red Dip
We have just begun the Red bit after the two Green peaks.
The scale is larger here and so we may have to wait longer till we return out of the green.
In 10 dayts, we will be near end of month
So, for me, this week will be possibly Red but towards the end of the month, things will begin to move higher.
All depends on PA following expected patterns and that does not always happen
We can only look, plan and react.
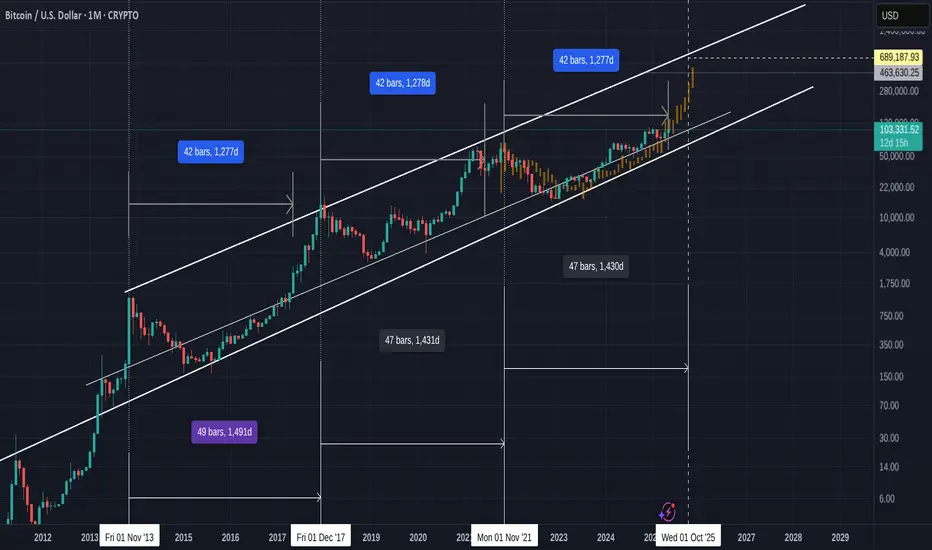
Bitcoin could be SO close to take off - certainly shows Strength
Before we go anywhere with this, we MUST remember that a "TREND LINE " requires a minimum of 3 points of Contact to make it Valid. The more points of contact the better.
All of these Trend lines in this chart are therefore Valid.
But what needs to be questioned is maybe the PA trend between the lines......
And because of the Scale of this, we are using only 2 past Factual data sets and one expected.
So NOT a confirmed Trend
But I shall continue anyway as there are a number of things that make this idea a possibility.
So, on the chart we have the Upper and Lower day counts.
The Lower is number of days between ATH
2013 -> 2017 = 1491 days
2017 -> 2021 = 1431 days
2021 -> 2025 = ...............Expected anytime from October to Dec. This is IF we follow the "pattern"
50 day difference between the 2 sets of Past data
The Upper day count uses just ONE data point from the 2013 -> 2017 cycle. It is from the ATH to when PA made the BIG move to begin the climb to ATH. That was around 1277 days after the 2013 ATH and you can see the candle that rose off that line of support was substantial.
As many of you know, I am firmly in the belief that this run is mimicking the 2013 -> 2017 run in many ways
So, The same day count takes us past the First 2021 ATH, which I have always said was a "False" ATH in that PA was driven High, to early, by leveraged and hopeful gains.
However, if you look at the distance from the end of that day count to when the ATH was reached, it is similar to the 2017 ATH
So if we Project that same day count onto current PA, THIS MONTH is the month for take off.
And again, See the difference between the end of the day count and the projected ATH daye.
Similar to previous occasions.
This is also reflected on the Fractal, that arrives on the upper trend line in November.
One thing that makes me hesitate a little here is the projected ATH Price of Near 700K USD.
I am not sure that is going to happen....And so we wait to see what happens.
But I will watch this and see where we go
I have pointed out in another chart, how Bitcoin PA is under a Very long time Arc of resistance and this could be in play and if so, This chart Will become invalidated.
We Wait to see
BTC still consolidates within a rangeIf you were like me, you got a little dose of hopium after BTC closed above last week's resistance around $105k.
Nonetheless, resistance was expected from $105k - $108k with price starting the week with a bearish engulfing candle, currently trading around $103.1k.
We will have to see if last week's support around $101.5k holds.
If the price continues with bullish momentum and does something like the period from 22 Apr - 6 May, a successful bull flag breakout could take BTC to $115k.
If support is lost, we could see retests of previous levels as low as $94.5k. However, my guess would be a test of $97.5k before going higher, creating a HHHL market structure.

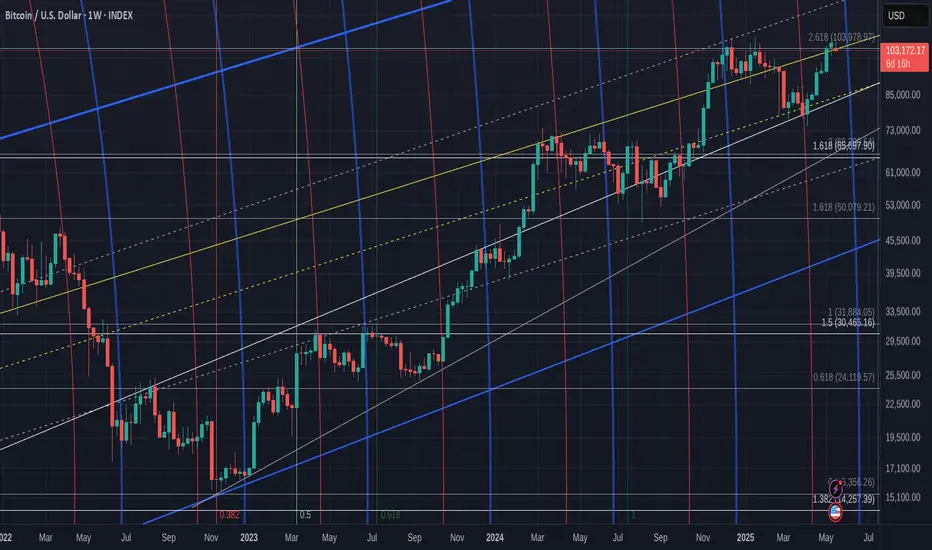
Bitcoin Weekly Closed GREEN -opens RED. Whats next ? After 6 consecutive Green Weeks, Bitcoin maybe about to Turn around and Cool for a bit.
BUT DO NOT PANIC
We have opened the week with a sharp drop back below the 2.618 Fib Extension. This in itself is a major move if unsurprising
Last week, we talked about this possibility by looking at the Daily MACD.
MACD Rising above the Signal line is a Bullish indication and Visa Versa
See the Arrow on the left, how MACD had 2 slight pullbacks and then went higher. This was in Nov 2024, just as the Ranging was finishing and PA was getting ready to push up to its Current ATH line
What I was looking at mostly though, was the Histogram. The Histogram shows us the distance between the MACD line ( yellow ) and its Signal line ( Red ) . The Bigger the bar, the bigger the difference between them.
See how it rose twice and then, went red for 2 days, recovered for a day and then , OFF WE WENT
And I am suggesting this is what may happen again.
So far, that pattern is repeating and the Histogram just went Red.
We may need to understand the difference in scale of this histogram though.
This could point towards a Week of unsettled PA, maybe Longer.
Notice how the MACD ( yellow) has now dropped below the Signal line ( red) as it did in Nov 2024.
During this period of MACD dropping and going red in 2024, we had 6 days of Red PA candles before the Bigger push higher. This may take longer this time but we have to wait and see.
We need to watch this close as the lines of support are in different place now.
If We zoom in on the Weekly PA chart, we see things a little more clearly
PA has fallen back below a line that was required as support. If you Look back to Nov 2024 area, we can also see a very Big difference in how PA is on the lines of support.
In 2024, we bounced off support.
We are currently being Rejected.
This Daily chart offers some more detail
The Circled area is the Nov 2024 area I been talking about.
Todays pull back is sharper but as we saw with the Histograms, we are in a bigger scale anyway
We could also see a similarity if we look back before the Circled area, see the W shape? A Double Bottom that appeared just before the push up.
Well, we just did that too.......If you back from where we are now, to the Low..There were 2 Dips down and then we pushed higher.
And, again, It is the scale that is Bigger.....
So, for me, this week maybe a bit bloody, but over all, Still Highly BULLISH
We need to regain that 2.618 Fib ext on this chart as support but that may not happen just yet.
There are "Local" lines of support near by and the LOG Daily chart I will post later gives some hope that Big Drops may not happen
The line of resistance just over head is strong and untill we break 112K and Hold it, we are likely to remain being bounced around.
But I do believe we Will do this and that we do seem to be repeating a pattern that led to a Goodpush higher.
We just have to wait and see
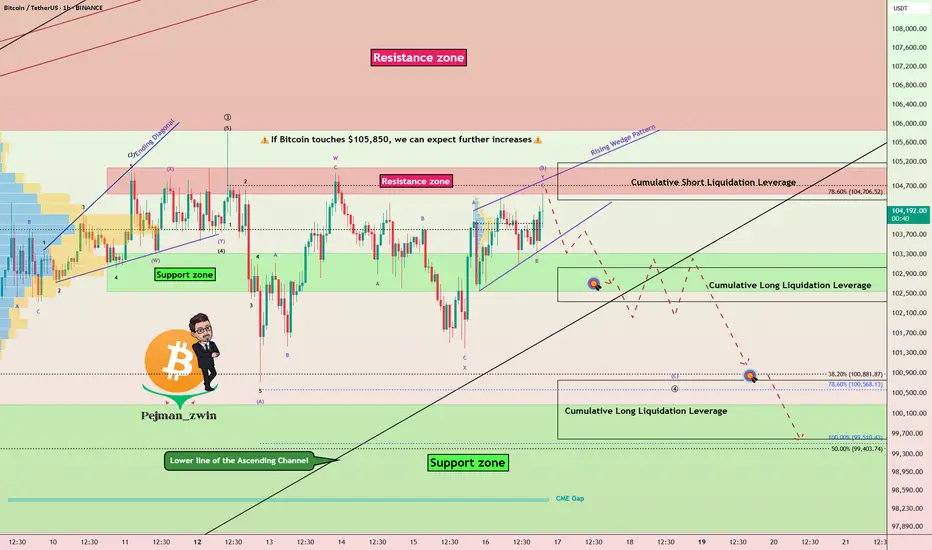
Bitcoin at Resistance With Weak Momentum-Bearish SetupBitcoin ( BINANCE:BTCUSDT ) finally reached the Resistance zone($105,100-$104,520) as I expected yesterday. Of course, the way Bitcoin reached the resistance zone was NOT with high momentum , so I decided to share this analysis with you.
In terms of Classic Technical Analysis , Bitcoin appears to have formed a Rising Wedge Reversal Pattern between Support zone($103,320-$102,600) and Resistance zone($105,100-$104,520) over the past few hours .
In terms of Elliott Wave theory , given Bitcoin’s low momentum and the Heavy Cumulative Short Liquidation Leverage($105,180-$104,412) ahead of Bitcoin, it appears that Bitcoin has completed microwave B of the main wave 4 with a Double Three Correction(WXY) .
I expect Bitcoin to decline to at least $102,800 at the first target AFTER breaking the lower line of the Rising Wedge Pattern, and if the Support zone($103,320-$102,600) and lower line of the ascending channel(Major) are broken, we should expect a drop to Cumulative Short Liquidation Leverage($100,763-$99,600) .
Note: If Bitcoin touches $105,850, we can expect further increases.
Please respect each other's ideas and express them politely if you agree or disagree.
Bitcoin Analyze (BTCUSDT), 1-hour time frame.
Be sure to follow the updated ideas.
Do not forget to put a Stop loss for your positions (For every position you want to open).
Please follow your strategy and updates; this is just my Idea, and I will gladly see your ideas in this post.
Please do not forget the ✅' like '✅ button 🙏😊 & Share it with your friends; thanks, and Trade safe.
Bitcoin Breakout Loading: Resistance Zone Under Pressure!!!Bitcoin ( BINANCE:BTCUSDT ) made the correction I expected , as I predicted in my previous idea .
Bitcoin is trading in the Resistance zone($103,320-$102,600) and near the Resistance lines . Given the momentum of the previous hour's candle and the fact that the previous three candles together formed a Morning Star Candlestick Reversal pattern , it is expected that the Resistance lines will be broken soon.
In terms of Elliott Wave theory , it looks like Bitcoin has completed the main wave 4 as I expected with a Zigzag Correction(ABC/5-3-5) . A break of the Resistance lines by Bitcoin could confirm the end of the main wave 4 .
Also, given Bitcoin's higher correlation with the S&P500 Index ( SP:SPX ) and the fact that I expect the S&P500 Index to increase , the increase in the S&P500 Index could help Bitcoin increase further .
I expect Bitcoin to break the Resistance zone($103,320-$102,600) and Resistance lines soon and attack towards the Resistance zone($105,100-$104,520) .
Cumulative Long Liquidation Leverage: $101,360-$100,600
Note: If Bitcoin falls below $101,280, we should expect further declines.
Please respect each other's ideas and express them politely if you agree or disagree.
Bitcoin Analyze (BTCUSDT), 1-hour time frame.
Be sure to follow the updated ideas.
Do not forget to put a Stop loss for your positions (For every position you want to open).
Please follow your strategy and updates; this is just my Idea, and I will gladly see your ideas in this post.
Please do not forget the ✅' like '✅ button 🙏😊 & Share it with your friends; thanks, and Trade safe.

BITCOIN Analysis (1H)We have a CHoCH (Change of Character) in the internal structure, and a bullish order block has been cleared. Price is currently within a supply zone, and there is a resistance line above the current price level.
It appears that price is aiming to pull back to lower support zones. These lower zones are fresh and unmitigated, so we expect that upon reaching them, price may bounce back upward toward the previous high.
A 4-hour candle closing above the invalidation level would invalidate this bias.
Do not enter the position without capital management and stop setting
Comment if you have any questions
thank you

Bitcoin at PRZ! Is This the Calm Before a Drop?As I expected in yesterday's idea , Bitcoin ( BINANCE:BTCUSDT ) started to rise from near the Support line and hit the Target .
Bitcoin is trading near the Potential Reversal Zone(PRZ) , the upper line of the ascending channel(minor) , and the Resistance line .
In terms of Elliott Wave theory , it seems that Bitcoin has successfully completed the microwave B of the main wave 4 in the ascending channel(minor). A break of the lower line of the ascending channel(minor) could be a sign of the completion of this wave. The corrective structure of the main wave 4 so far could be a Zigzag(ABC/5-3-5) .
I expect Bitcoin to drop to at least $100,923 AFTER breaking the lower line of the ascending channel(minor) and breaking the Support line, the next target could be the lower line of the ascending channel(major) .
Cumulative Short Liquidation Leverage: $106,943-$105,913
Cumulative Short Liquidation Leverage: $105,525-$104,500
Cumulative Long Liquidation Leverage: $100,763-$99,774
Note: If Bitcoin goes above $105,300, we can expect more pumps.
Note: If Bitcoin touches $99,400, we should expect further declines.
Please respect each other's ideas and express them politely if you agree or disagree.
Bitcoin Analyze (BTCUSDT), 1-hour time frame.
Be sure to follow the updated ideas.
Do not forget to put a Stop loss for your positions (For every position you want to open).
Please follow your strategy and updates; this is just my Idea, and I will gladly see your ideas in this post.
Please do not forget the ✅' like'✅ button 🙏😊 & Share it with your friends; thanks, and Trade safe.

BTCUSD Smart Money Play: Order Block Trap Before the Dump?🚨 Bitcoin (BTCUSD) is flashing a textbook Smart Money setup — are you positioned before the move unfolds?
This chart reveals a juicy opportunity for traders who understand how to follow Smart Money footprints. Let’s break it down:
📊 Chart Context (30m Timeframe):
BTCUSD recently tapped into a significant Order Block (highlighted in purple) — this is where Smart Money typically loads up.
Notice how price showed a fake push into the premium zone, but failed to break higher — signaling potential distribution.
📉 Bearish Reaction + Fib Confluence:
Price kissed the 61.8% Fibonacci retracement, then sharply rejected — classic sign of mitigation before continuation.
The red zone (above 103,700) served as a perfect liquidity trap, where late buyers got baited.
📍 Order Block Zone (OB):
Price is stalling just beneath the OB at 103,577, showing signs of rejection.
Smart Money often uses this pattern to “tap and trap” — tapping into resting orders before driving price down.
🧠 What’s Really Happening?
Retail longs are trapped inside the red box, expecting a breakout.
Meanwhile, Smart Money is distributing into that demand before driving price toward the discount zone (marked in green).
🎯 Target Objectives:
Immediate target: 103,200 (50% Fib level)
Extended target: 102,616 — which aligns with the liquidity void below.
⚡ Risk-Reward Setup:
Entry near 103,577 with SL above 103,749
Targeting 102,616 gives an excellent R:R profile
You don’t chase Smart Money — you follow their traps, and react with precision.
📌 Trading Plan:
Wait for clear rejection or bearish engulfing on lower timeframes at OB
Manage risk wisely — even clean setups can be invalidated.
Don’t guess. React. Let the market show you intent.
💡 Final Take:
This BTCUSD setup is textbook Smart Money Concept in motion:
Order Block ➡️ Trap ➡️ Liquidity Grab ➡️ Expansion
Whether you short this retracement or wait for confirmation, this is a move you’ll want on your radar. Weekly close could reveal major direction.
✅ Comment “OB READY” if you’re watching this setup!
✅ Save this post for future reference. Smart Money always leaves clues.

Bitcoin’s Path to ATH: Final Wave or Just a Pause? Bitcoin ( BINANCE:BTCUSDT ) pumped about +2% after the " The United States has dropped its tariffs on Chinese goods to 30%, down from a brutal 145%, while China is slashing its own duties on US imports to just 10%, temporarily, for the next 90 days. " news, but then started to decline again. Do you think Bitcoin can see the new All-Time High(ATH)?
Bitcoin is moving near the Support zone($102,200-$101,680) and Support line .
In terms of Elliott wave theory , Bitcoin appears to have completed microwave 3 of the main wave 5 and is currently completing microwave 4 of the main wave 5 .
Given the momentum of the decline a few hours ago , I expect Bitcoin to either touch the previous low or create a new low in the 1-hour timeframe .
I expect Bitcoin to attack the Support zone($102,200-$101,680) once again and possibly touch the Support line and then attack towards the Resistance zone($109,588-$105,865) with the two scenarios I outlined on the chart .
Cumulative Short Liquidation Leverage: $106,943-$105,913
Cumulative Short Liquidation Leverage: $105,313-$104,787
Cumulative Long Liquidation Leverage: $102,198-$101,697
Note: If Bitcoin can move above $104,500 without correction, we can expect more pumping.
Note: If Bitcoin falls below $101,500, we can expect more declines.
Please respect each other's ideas and express them politely if you agree or disagree.
Bitcoin Analyze (BTCUSDT), 1-hour time frame.
Be sure to follow the updated ideas.
Do not forget to put a Stop loss for your positions (For every position you want to open).
Please follow your strategy and updates; this is just my Idea, and I will gladly see your ideas in this post.
Please do not forget the ✅' like '✅ button 🙏😊 & Share it with your friends; thanks, and Trade safe.

Bitcoin is still following 2017 run. Surprising things to see
As many of you know, I have been referring This cycle of Bitcoin to that of the 2013 ->2017 bull run. And while PA has Fallen off and below the Fractal itself, we do still have one Very Major thing to see and it is a Good one.
So, the chart above has an arrow. This is pointing to Sep, Oct, Nov 2024.
See how PA pushed up to the "Neckline" of the Range and got rejected for 2 weeks.
A Red then Green Candles, on or below that "Neckline" and then Off it went.
We are currently just below the "Neckline" of this Range and we are currently printing a Red candle. It is early days but maybe we will repeat the same pattern.
There are reasons that I have explained in an earlier post today, that point towards a possible Red candle this week.
The other thing I want to show you on this subject is the MACD
This is a Daily MACD ( the main chart being Weekly) But while the actual PA of the MACD is different, I want you to see the Histogram. The Histogram shows us the % Difference between the MACD line ( yellow) and its Signal line ( Red)
Have a look at the the similarity the histogram pattern in 2024 ( arrow ) compared to this period Now.
The Large green Climb from a Low, the fall, the new smaller climb, the drop to Red and then a push higher.
OK, so the scale is different but, to me, it shows a similar pattern to the previous end of Ranging period.
We need to see if this pays out. If so, we will see a Red Histogram for a while..
This ties in with the ideas presented above on the PA patterns.
But overall this cycle, we do seem to be repeating patterns in a broad sense, with a larger scale currently. The larger scale of thispossible Red Histogram also plays into the idea mentioned at the end of this post.
So , what is the connection to the 2013 - 2017 Cycle.
Look at the upper trendline that has rejected PA since 2024. This is an OLD line of resistance from before 2017...
Lets look at a zoomed out chart
Look at that Arrow on the Left and that trend line.
It is the SAME LINE - Not only that, it rejected PA twice in late 2016 and 2017, before PA broke through and went on to reach a new ATH
So, Having seen this, I am happy to believe that we ARE Still following that 2013 -> 2017 Cycle pattern.
True, PA has fallen below the Fractel but we do seem to be repeating the Trend line Rejection, Dip, Rejection and........
You can also see how this same trend line, once crossed, is extremely strong support - infact we did not drop back below until July 2022, after another ATH
BUT, as ever, I look to BOTH sides and there is a chance we may see a stiffer rejection, IF we get rejected here again.
Should events dictate a further Drop in PA, we may see PA return to the next trend line below, around 82K. ( remember that Red Histogram pattern I mentioned earlier )
While this would Scare many, it would still play into the pattern we have been seeing.
2024 saw 3 major Rejections off its Neckline.
We have had 2 so far in 2025 and we are there right now, waiting to see what happens, with a RED candle. A Drop back to 82K would also reset the Daily MACD very nicely.
I remain Cautious and Bullish
what ever happens in the short term, I have little doubt about further pushes higher, maybe a LOT higher

Bitcoin Daily update , MACD & RSI - whats possibility short Term
Bitcoin has reached above the next Fib circle. You can see how PA reacts to these by looking back
For me, I can see PA sliding down the 618 Circle we currently sit on until we reach that dashed line that shows the lower line of support of the rising channel.
We reach that around 17 May if we range sideways, slide along fib circle.
It could also be said that the 1.5 "local" Fib extension is what is offering Support here and the same date is used for when PA reached that dashed line of support.
Which ever option you choose, PA has support here and we should remain around this area unless the inflation figures released TODAY are not good
Why will PA range and not continue to Rise ?
RSI is up in overbought
This can range high and we need to watch and see if the RSI bounces of its own MA ( yellow line)
The Daily MACD is showing a desire to turn Bearish. for the 2nd time, it is curling over and not just pushing higher as previously.
This is NOT an over all Bearish signal to me but one that shows that PA is pushing hard against resistance. See how the histogram has reduced in size
The 4 hour MACD is still falling Bearish, recovering from the previous pushes.
In conclusion
The combination of a High RSI and Weakening MACD leads me to think that PA will Range across at best for a while, Till the 4 hour MACD reverses and climbs, Maybe with small Dips and Troughs.
If BTC Looses 100K, that is a big mental blow and I think the Bulls will try and avoid this.
However There is a possibility that we could drop back to the Low around 82K by the end of this month. I think this is a low possibility and I will post a report on this today but it is Good to look at all possibilities.
Long Term still Very BULLISH

BTC New Update (12H)The upward wave appears to be a complex correction. Price may retrace downward either from this area or from the red box, and then we could see another strong bullish move from Bitcoin starting from the green zone.
It doesn’t matter where the rejection occurs | what matters is the green Rebuy zone marked on the chart.
In the green zone, we are looking for buy/long positions.
A daily candle closing below the invalidation level will invalidate this analysis.
For risk management, please don't forget stop loss and capital management
When we reach the first target, save some profit and then change the stop to entry
Comment if you have any questions
Thank You

Bitcoin Breaks Wedge! Correction Coming Before Next Leg? After Trump said in the press conference, " Better go out and buy stocks now ." The SPX500 index started pumping , and as I said in the ideas of the last few days, Bitcoin ( BINANCE:BTCUSDT )'s correlation with this index has increased. Bitcoin also started pumping.
Yesterday's Bitcoin pump succeeded in failing the Ascending Broadening Wedge Pattern , generally, if the reversal pattern fails, it will play a continuation role .
Bitcoin is moving between the Support zone($100,270-$97,700) and the Resistance zone($109,588-$105,865) . The question is whether Bitcoin will touch the Support zone($100,270-$97,700) again and move towards the Resistance zone($109,588-$105,865) or will it continue its upward trend.
In terms of Elliott Wave theory , it seems that Bitcoin has completed microwave 3 of the main wave 5 . We can expect an even Time Correction on Saturday and Sunday when trading volume is low . There is also a possibility that microwave 4 of the main wave 5 in Cumulative Long Liquidation Leverage($101,838-$101,432) will be completed.
One of the reasons I think we should wait for a correction is the USDT.D% ( CRYPTOCAP:USDT.D ) chart, which we used as a guide in previous ideas .
USDT.D% has reached Monthly Support(1) and a Heavy Support zone(4.73%-4.50%) , which I believe is unlikely to be broken within in first attack , and I expect an increase to the Fibonacci lines on the chart.
I expect Bitcoin to start rising again after a correction .
Cumulative Short Liquidation Leverage: $105,114-$104,100
Note: If Bitcoin touches $97,500, we should expect further declines.
Please respect each other's ideas and express them politely if you agree or disagree.
Bitcoin Analyze (BTCUSDT), 2-hour time frame.
Be sure to follow the updated ideas.
Do not forget to put a Stop loss for your positions (For every position you want to open).
Please follow your strategy and updates; this is just my Idea, and I will gladly see your ideas in this post.
Please do not forget the ✅' like'✅ button 🙏😊 & Share it with your friends; thanks, and Trade safe.
