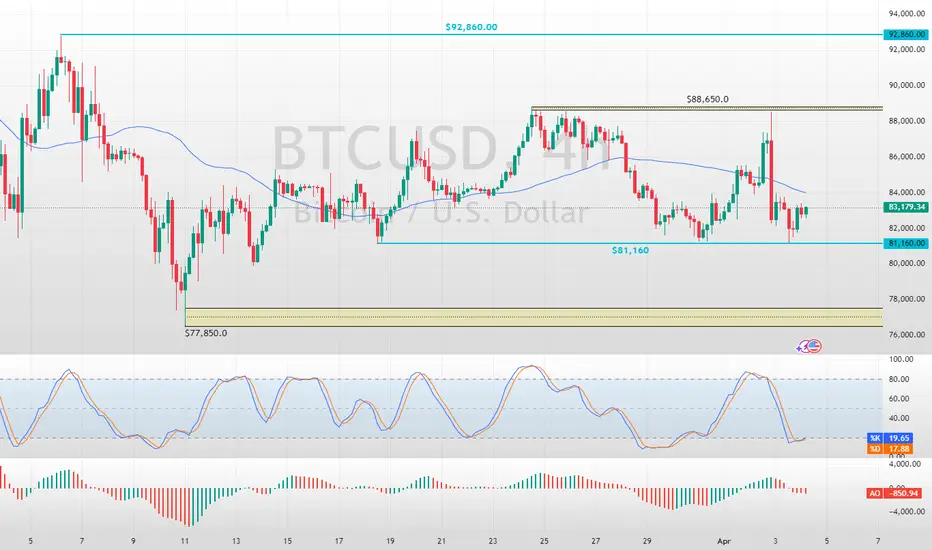
Bitcoin Technical AnalysisFenzoFx—BTC/USD trend outlook is bearish below $88,650.
A break below the immediate support of $81,160 can trigger a new bearish wave, targeting the next support area at $77,850.
Bitcoinanalysis
Bitcoin Breaks Resistance – Bullish Flag in Play(Short-term)!!!Bitcoin ( BINANCE:BTCUSDT ) started to rise and pump after '' the Mastercard Plans to Enable 3.5 Billion Cardholders to Transact with Bitcoin and Crypto, " and the US indexes movements and managed to break the Resistance zone($84,380_$83,580) .
Bitcoin is moving near the Monthly Pivot Point and Support lines .
Bitcoin seems to be completing the Bullish Flag Pattern .
I expect Bitcoin to reach the Targets I have outlined on the chart in the coming hours and most likely fill the CME Gap($86,620_$86,565) .
There is a possibility that Bitcoin will fall again after this increase. What do you think!?
Note: The Crypto market is full of excitement. Please pay more attention to capital management than before.
Note: This analysis could be a short-term Roadmap for Bitcoin .
Note: If Bitcoin falls below $83,500, we should expect further declines, possibly heavy declines.
Please respect each other's ideas and express them politely if you agree or disagree.
Bitcoin Analyze (BTCUSDT), 15-minute time frame.
Be sure to follow the updated ideas.
Do not forget to put a Stop loss for your positions (For every position you want to open).
Please follow your strategy and updates; this is just my Idea, and I will gladly see your ideas in this post.
Please do not forget the ✅' like '✅ button 🙏😊 & Share it with your friends; thanks, and Trade safe.

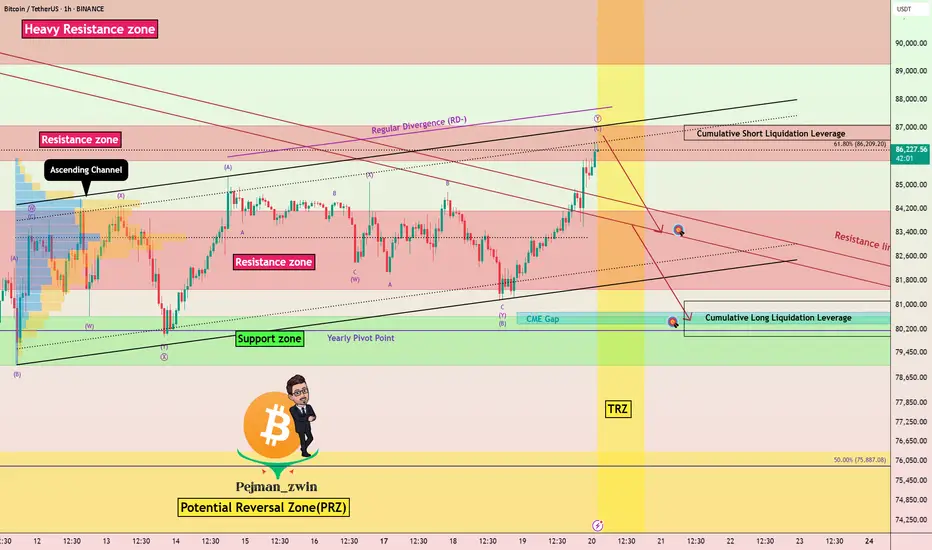
CME Gap Target: Is Bitcoin Headed for $80K!?Bitcoin ( BINANCE:BTCUSDT ) is moving in the important Support zone($84,120_$81,500) , and on the 1-hour time frame , Bitcoin is moving near the Support zone($82,360_$82,000) and the lower line of the ascending channel (small) .
Overall, Bitcoin has started another downtrend after breaking the lower line of the ascending channel (big) .
Since trading volume is generally low on Saturdays and Sundays , it is unlikely that the important Support zone($84,120_$81,500) will be broken before the financial markets open .
In terms of Elliott Wave theory , Bitcoin appears to have completed the main wave 3 at $81,644 and is currently completing microwave C of the main wave 4 . The main wave 4 will most likely have a Zigzag Correction(ABC/5-3-5) .
In general, the financial markets and US indices such as TVC:DJI , SP:SPX CME_MINI:NQ1! were not in a good state last week , and this trend will most likely continue next week . The tariffs that Donald Trump is imposing on countries around the world, as well as the turbulent situation in the Middle East , will all lead to the possibility of a fall in Bitcoin and other financial markets in the coming days.
I expect Bitcoin to make at least a temporary increase to $83,200 and then next target the Resistance zone($84,380_$83,580) and the upper line of the ascending channel before starting to fall and attack the important Support zone($84,120_$81,500) and also fill the CME Gap($80,760_$80,380) .
Note: If Bitcoin breaks above the Resistance zone($84,380_$83,580), we can expect more pumping.
Please respect each other's ideas and express them politely if you agree or disagree.
Bitcoin Analyze (BTCUSDT), 1-hour time frame.
Be sure to follow the updated ideas.
Do not forget to put a Stop loss for your positions (For every position you want to open).
Please follow your strategy and updates; this is just my Idea, and I will gladly see your ideas in this post.
Please do not forget the ✅' like '✅ button 🙏😊 & Share it with your friends; thanks, and Trade safe.

Can we be optimistic that this will come true?( road to 300k )I might be wrong and this might never happen, but it might come true From a technical perspective!!!
Remmember
Give me some energy !!
✨We spend hours finding potential opportunities and writing useful ideas, we would be happy if you support us.
Best regards CobraVanguard.💚
_ _ _ _ __ _ _ _ _ _ _ _ _ _ _ _ _ _ _ _ _ _ _ _ _ _ _ _ _ _ _ _
✅Thank you, and for more ideas, hit ❤️Like❤️ and 🌟Follow🌟!
⚠️Things can change...
The markets are always changing and even with all these signals, the market changes tend to be strong and fast!!

Bitcoin hit that 236 Fib circle I warned you about- and now ?As we come to the end of the week, we see the potential for further drop as PA slides along that 236 Fib circle. ( Red)
It NEVER ceases to amaze me how PA reacts to Fib circles and yet, as if by magic, there is some Macro News at exactly the same time
On this occasion, It seems the US inflation figures on Friday caused this Drop in price.
This Chart is the daily verion of the Weekly chart i often post about weekly candle closes.
I trust this chart
The chance for a drop to arounf 75K is very real and if that fails, down to the 2 Fib extension arounf 68K, though I think that is unlikely
We do need to watch on which side of thois Fib circle PA sits tomorrow. - Idealy, it breaks through tonight and next week candle sits on the "Support" side on the circle.
If it remains as resistance, A Steep drop is highly likely.
In my opinion.
Daily MACD is turned down, heading towards it ssignal line. If that crosses, the Daily becomes very BEARISH
We have to wait and see what happens and be ready to react.
I do have SPOT buy orders around 78 K
If we Drop Lower, I will dig up some funds and buy more lol
WE WAIT FOR WEEKKY CLOSE

15-Min Bitcoin Setup – Quick Scalping Opportunity?First of all, I must say that this is a short-term analysis in a 15-minute time frame . Please be careful .
Let's take risks while respecting capital management. Be sure to respect capital management.
Bitcoin ( BINANCE:BTCUSDT ) is currently trading in the support zone($84,120_$81,500) , Potential Reversal Zone(PRZ) near the lower line of the ascending channel .
In terms of Elliott Wave theory , it seems that Bitcoin could complete its 5 bearish waves near the lower line of the ascending channel .
Also, we can see the Regular Divergence(RD+) between Consecutive Valleys .
I expect Bitcoin to be able to rise to at least $85,400.
Cumulative Short Liquidation Leverage: $86,397_$85,760
Cumulative Long Liquidation Leverage: $84,262_$83,336
Note: One of the reasons for Bitcoin's decline is the decline in US indices such as CME_MINI:NQ1! , SP:SPX , and TVC:DJI .
Note: If Bitcoin falls below $83,000, we can expect more dumps.
Please respect each other's ideas and express them politely if you agree or disagree.
Bitcoin Analyze (BTCUSDT), 15-minute time frame.
Be sure to follow the updated ideas.
Do not forget to put a Stop loss for your positions (For every position you want to open).
Please follow your strategy and updates; this is just my Idea, and I will gladly see your ideas in this post.
Please do not forget the ✅' like '✅ button 🙏😊 & Share it with your friends; thanks, and Trade safe.

Bitcoin’s Next Move – Another Attack to Heavy Resistance Zone!!!Bitcoin ( BINANCE:BTCUSDT ) was successful in three moves , as I expected in my previous post . I still think Bitcoin will NOT stop trying to break the Heavy Resistance zone($93,300_$89,200) .
Bitcoin is moving near the Support zone($87,100_$85,800) and Cumulative Long Liquidation Leverage($86,376_$85,411) .
Regarding the Elliott Wave theory , Bitcoin appears to be completing microwave C of the main wave 4 . The structure of the main wave 4 is a Zigzag Correction(ABC/5-3-5) .
If we look at the USDT.D% ( CRYPTOCAP:USDT.D ) chart on the 4-hour time frame , USDT.D% is pulling back to the Uptrend line and is currently in the Resistance zone(5.30%-5.15%) . There is a possibility of completing the Bearish Flag Pattern .👇
I expect Bitcoin to rise again in the coming hours and attack the Heavy Resistance zone($93,300_$89,200) , Potential Reversal Zone(PRZ) , Resistance lines , Monthly Pivot Point , and 50_SMA(Daily) .
Note: If Bitcoin falls below $85,400, we can expect more dumps.
Market Developments:
GameStop announced BTC adoption as a treasury asset, signaling growing corporate interest.
Trump Media partnered with Crypto to launch crypto ETFs, adding institutional momentum.
Please respect each other's ideas and express them politely if you agree or disagree.
Bitcoin Analyze (BTCUSDT), 1-hour time frame.
Be sure to follow the updated ideas.
Do not forget to put a Stop loss for your positions (For every position you want to open).
Please follow your strategy and updates; this is just my Idea, and I will gladly see your ideas in this post.
Please do not forget the ✅' like '✅ button 🙏😊 & Share it with your friends; thanks, and Trade safe.

Bitcoin Ready for PUMP or what ?Finally, the price broke the wedge, and the price experienced a significant drop. I think now is the time for Bitcoin to rise again to GETTEX:89K .
previous analysis
Give me some energy !!
✨We spend hours finding potential opportunities and writing useful ideas, we would be happy if you support us.
Best regards CobraVanguard.💚
_ _ _ _ __ _ _ _ _ _ _ _ _ _ _ _ _ _ _ _ _ _ _ _ _ _ _ _ _ _ _ _
✅Thank you, and for more ideas, hit ❤️Like❤️ and 🌟Follow🌟!
⚠️Things can change...
The markets are always changing and even with all these signals, the market changes tend to be strong and fast!!

BITCOIN Trending Higher - Can Bulls Maintain Momentum?COINBASE:BTCUSD is trading within a well-defined ascending channel, with price action consistently respecting both the upper and lower boundaries. The recent bullish momentum indicates that buyers are in control, suggesting a potential continuation toward higher levels.
The price has broken above a key resistance zone and successfully retested it as support, confirming the bullish structure. This retest strengthens the case for further upside, with the next target aligning with the upper boundary of the channel near $91,000.
As long as the price remains above this newly established support, the bullish outlook stays intact. However, if the price fails to hold above this zone, a deeper pullback toward the midline or the lower boundary of the channel could come into play.
Remember, always confirm your setups and trade with solid risk management.
Best of luck!

Bitcoin’s Next Challenge – Can BTC Break the Heavy Resistance?Bitcoin ( BINANCE:BTCUSDT ) started to rise from the Support zone($84,120_$81,500) as I expected in the previous post . The question is, can Bitcoin break the Heavy Resistance zone($93,300_$89,200) and Resistance lines ?
Please stay with me.
Bitcoin appears to have broken through the Resistance zone($87,100_$85,800) and is preparing for its first attack on the Heavy Resistance zone($93,300_$89,200) .
In terms of waves, Bitcoin appears to be completing microwave 4 of microwave C of the main wave Y . The waves structure inside the Ascending Channel appears to be of the Double Three Correction(WXY) .
I expect Bitcoin to prepare for its first attack on the Heavy Resistance zone($93,300_$89,200), the upper line of the ascending channel , the monthly pivot point , 50_SMA(Daily) , and the Resistance lines after completing the pullback to the Resistance zone($87,100_$85,800 ) and fill first CME Gap($86,640_$86,520) . I think the Potential Reversal Zone(PRZ) could be the zone to start a new decline for Bitcoin.
I chose the label of this analysis ''SHORT'' because I think Bitcoin is in a bit of a risky zone for a LONG position, what do you think?
Note: If Bitcoin goes over $91,000, we can expect more pumps.
Note: If Bitcoin falls below $85,200 before hitting the Heavy Resistance zone($93,300_$89,200), we can expect further declines.
Please respect each other's ideas and express them politely if you agree or disagree.
Bitcoin Analyze (BTCUSDT), 2-hour time frame.
Be sure to follow the updated ideas.
Do not forget to put a Stop loss for your positions (For every position you want to open).
Please follow your strategy and updates; this is just my Idea, and I will gladly see your ideas in this post.
Please do not forget the ✅' like '✅ button 🙏😊 & Share it with your friends; thanks, and Trade safe.

Bitcoin Following 2013-2017 Fractal UPDATE 2We can see from the chart above that PA has now fallen below the Fractal for the first time since July 2023
This is itself was expected as we can see from previous posts on this Idea
PA was overbought and so HAS to cool off
However, we have targets as to when PA may try and recover.
initially, the circle in End of May was my expected "turn around" point
Things have progressed faster and so now, we have possibilities opening up for a move higher, sooner, maybe around end of April 2925
However until the weekly MACD is on Neutral, these would be short lived - hopefully.
For a sustainable move higher, PA needs to have the ability to maintain the push
the Weekly MACD shown above needs till end of April before any significant move can be maintained. PA has bounced of Neutral previously. But MACD can , obviously, Drop below this point, wait till May, or later, and move then.
For me, the line of the arrow higher is becoming the more realistic ideal path
But the longer we wait, the Steeper the rise has to be to maintain the idea of Cycle ATH in Q4, as per cycle trends.
And to conitnue to follow this Fractal.
The Time WILL come were we break away from this Fractal but as I have been saying for years, we are still on it......many things point towards that continuing.
But as I have mentioned in a post earlier today, These Trends may be changing.
Bitcoin is Maturing
All we can do is watch, react and learn
HAVE A PLAN FOR ALL OUTCOMES but also understand, the idea of Bitcoin collapsing is becoming more and more unrealistic...
The outlook is BULLISH noi matter what
I expect to remain on the fractal path till Next cycle ATH
Time will tell

Bitcoin’s Next Move – Another Attack on Resistance zone?Bitcoin ( BINANCE:BTCUSDT ) fell to $83,400 as I expected in the previous analysis , the question is whether Bitcoin will continue to decline or not.
Please stay with me.
Bitcoin is moving in the Support zone($84,120_$81,500) and near the Support lines . The way Bitcoin has moved and decreased since yesterday until now has been such that it seems that Bitcoin can attack the Resistance zone($87,100_$85,800) at least once more.
In terms of Elliott Wave theory , given Bitcoin’s movements over the past few hours, it appears that Bitcoin is completing a microwave B of the main wave Y .
I expect Bitcoin to be able to attack the Resistance zone($87,100_$85,800) once again and if it breaks, I have marked the next targets on the chart .
Do you think Bitcoin can touch $90,000 again?
Note: If Bitcoin goes below $81,800, we can expect more dumps.
Please respect each other's ideas and express them politely if you agree or disagree.
Bitcoin Analyze (BTCUSDT), 2-hour time frame.
Be sure to follow the updated ideas.
Do not forget to put a Stop loss for your positions (For every position you want to open).
Please follow your strategy and updates; this is just my Idea, and I will gladly see your ideas in this post.
Please do not forget the ✅' like '✅ button 🙏😊 & Share it with your friends; thanks, and Trade safe.

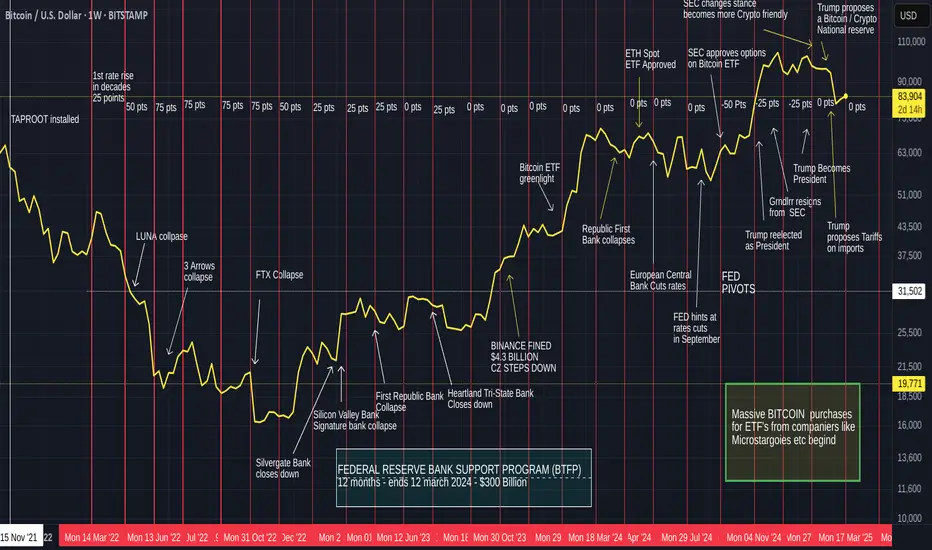
Bitcoin, interest rate effects, Macro events since 2021 - UPDATEThere is one very simple takeaway for me from this chart and that is simply that raises and Lowering of interest rates had Very little Effect on Bitcoin
It is more the effect it had on other organisations and the sentiment that followed Bitcoin and the traders.
For instance, From Jan 2023, when we saw Bitcoin begin its recovery, interest rates continued to rise.....and had NO effect on the Bitcoin recovery
And I think this continues to this day.
After the First push higher by Bitcoin in 2023, PA went into a Long range...in this time, interest rates began remaining at a static level. Bitcoin did not rise because of this.
When BTC was ready, it made a push higher again, interest rates were static and remained so while BTC entered another long range in 2024
It could be said that BTC PA rose once Rates were reduced but PA leveled out again even while the next rates decision was to reduce.
Bitcoin has its own agenda, it is NOT dependant on the USA to control its choices
On Each range, the MACD on the weekly timef rames was OVERBOUGHT.
And it is currently resetting having been overbought again.
This s NOTHING to do with interest rates.
MACRO events do have an impact though and we need to pay attention this this
But over all, Bitcoin is GOOD, BULLISH and getting ready for its next push
Have a Nice day now
Bitcoin at Key Resistance – Will Bears Take Control?Bitcoin ( BINANCE:BTCUSDT ) started to rise as I expected in the previous posts .
Bitcoin is moving near the Resistance zone($87,100_$85,800) , the upper line of the Ascending Channel , and the Time Reversal Zone(TRZ) .
In terms of Elliott Wave theory , Bitcoin appears to be completing microwave C of the main wave Y .
Also, we can see the Regular Divergence(RD-) between Consecutive Peaks .
I expect Bitcoin to start declining from the Resistance zone($87,100_$85,800) again, the first target could be $83,400 and the second target can be the CME Gap($80,760_$80,380) filling.
Note: If Bitcoin breaks the Resistance zone($87,100_$85,800) we can expect more pumps.
This analysis is in line with the following analysis that I shared with you on the weekly timeframe. 👇
Please respect each other's ideas and express them politely if you agree or disagree.
Bitcoin Analyze (BTCUSDT), 1-hour time frame.
Be sure to follow the updated ideas.
Do not forget to put a Stop loss for your positions (For every position you want to open).
Please follow your strategy and updates; this is just my Idea, and I will gladly see your ideas in this post.
Please do not forget the ✅' like '✅ button 🙏😊 & Share it with your friends; thanks, and Trade safe.
Bitcoin at the D-Point of a Bullish Gartley – What’s Next?Bitcoin ( BINANCE:BTCUSDT ) is currently trading near the Support zone($80,600_$79,000) and Potential Reversal Zone(PRZ) and Support line .
Bitcoin appears to be completing the Bullish Gartley Harmonic Pattern .
Educational Note : The Bullish Gartley is a harmonic pattern that signals a potential reversal in an uptrend after a corrective move. It consists of five points (X-A-B-C-D) and follows specific Fibonacci retracements, with the D-point acting as a key buying zone.
Regarding Elliott wave theory , Bitcoin is completing the microwave B of the main wave Y .
Also, we can see the Regular Divergence(RD+) between Consecutive Valleys .
I expect Bitcoin to rise at least to Cumulative Short Liquidation Leverage . If the Resistance zone($84,130_$81,500) is broken, we can expect further increases in Bitcoin .
Note: If Bitcoin breaks below the Support zone($80,600_$79,000), we can expect further declines.
Please respect each other's ideas and express them politely if you agree or disagree.
Bitcoin Analyze (BTCUSDT), 1-hour time frame.
Be sure to follow the updated ideas.
Do not forget to put a Stop loss for your positions (For every position you want to open).
Please follow your strategy and updates; this is just my Idea, and I will gladly see your ideas in this post.
Please do not forget the ✅' like '✅ button 🙏😊 & Share it with your friends; thanks, and Trade safe.

Inverse Head & Shoulders in Play – Bitcoin’s Bullish Setup!!!Bitcoin ( BINANCE:BTCUSDT ) touched $84,500 as I expected in my previous post (even higher).
Right now it seems like Bitcoin has managed to break the Resistance zone($84,130_$81,500) and the 200_SMA(Daily) . The formation of the classic pattern , the Inverse Head and Shoulders Pattern , could be a sign that Bitcoin is preparing to break the Resistance zone($84,130_$81,500) .
Another Classic Pattern that we can see on the one-hour Bitcoin chart and hope for an increase in Bitcoin is the Fan Principle at the Bottom Pattern .
Educational tip : The Fan Principle at the Bottom is a bullish reversal pattern where the price forms a series of downward trendline breaks, signaling weakening bearish momentum. As each trendline is broken, buying pressure increases, leading to a potential uptrend.
According to Elliott Wave theory , with the resistance zone broken, we can expect Bitcoin to enter the next impulsive wave , which will likely continue to at least $86,300 .
Also, Today's U.S. economic data release could significantly impact financial markets, including Bitcoin :
UoM Consumer Sentiment : 57.9 (Forecast: 63.1 | Previous: 64.7) – A sharp decline, indicating consumer pessimism about the economy.
UoM Inflation Expectations : 4.9% (Previous: 4.3%) – A worrying increase, which could push the Fed toward a more hawkish stance.
Declining consumer sentiment may pressure the Fed to adopt a more accommodative stance, which is positive for risk assets like Bitcoin.
Rising inflation expectations could increase demand for inflation-hedge assets like Bitcoin.
However, if the Fed sees inflation rising as a concern, they may maintain a tighter policy, which could weigh on markets.
Today's data presents mixed signals, but falling consumer confidence and rising inflation expectations could ultimately fuel Bitcoin's next leg up.
Based on the above explanation , I expect Bitcoin to rise to at least the upper resistance zone($87,000_$85,820) after completing its pullback and complete the mission of filling the CME Gap($86,400_$85,595) . Of course, a CME Gap($80,760_$80,380) has also formed.
In your opinion, has Bitcoin finished its correction or created an opportunity for us to escape again?
Note: If Bitcoin falls below $81,300, we should expect further declines.
Note: If Bitcoin goes above $87,800, we should expect further increases.
Please respect each other's ideas and express them politely if you agree or disagree.
Bitcoin Analyze (BTCUSDT), 1-hour time frame.
Be sure to follow the updated ideas.
Do not forget to put a Stop loss for your positions (For every position you want to open).
Please follow your strategy and updates; this is just my Idea, and I will gladly see your ideas in this post.
Please do not forget the ✅' like '✅ button 🙏😊 & Share it with your friends; thanks, and Trade safe.

Bitcoin- I'm looking to re-eter shortIn my BTC analysis last week, I outlined the reasons behind my decision to enter short exit and detailed my expectations for a corrective move.
As projected, BTC broke below the $80,000 level. Although my initial downside target at $75,000 has not been fully met, I opted to manually close my short position to secure profits. Currently, I am monitoring price action for a potential re-entry on the short side.
From a structural standpoint, after establishing a local low around the $76,500 area, BTC has initiated a corrective bounce.
However, this recovery appears weak and corrective in nature — likely unfolding as a bear flag formation, albeit not perfectly defined.
My primary short re-entry zone is identified between $85,500 and $87,000, where I expect supply to emerge. As long as price remains capped below that zone, my bearish bias remains intact. I continue to anticipate a move to $75,000, with a potential extension toward the $72,000 technical support zone.
This bearish scenario would be invalidated in the event of sustained buying and consolidation above the $90,000 resistance level.

Bitcoin Sell SetupHi everyone.
I think this area has a lot of potential to put a sell order. We can set an order or wait for a CHoCH in lower TF and then find another entry setup.
I'll update TPs later.
Dear traders, please support my ideas with your likes and comments to motivate me to publish more signals and analysis for you.
Best Regards
Navid Nazarian

BTC → Bitcoin Retrace to $69,500? Or Bounce to $150,000?The short version, the probability that Bitcoin tests the breakout price around $69,500 is very high. That's simply the nature of breakouts; bulls take profits (sell orders) until the previous high is reached, at which point the bulls start buying again, and the bears take their profits (buy orders), driving the market up for another leg.
The question is, what is our next move as traders? Or even Bitcoin investors?
How do we trade this? 🤔
Let's zoom out to the Monthly chart. Bitcoin is resting on the 9EMA, a support area we've closed above it since September of 2023. Our current context is we've broken out of the 2021 cycle high of $69,500 and reached a new high just shy of $110,000. It's clear we're in pullback mode right now, so far-reaching down to $78,000.
Fundamentally, there aren't many catalysts for bullish activity. Bulls are simply taking profit at the first 6-figure Bitcoin price, which is both a psychological and technical price for selling. Monetary policy is still in a state of qualitative tightening, inflation has been slowly rising since September 2024, from 2.4% to 3%. Not a dramatic move, which certainly isn't helping Bitcoin move to the upside. Bitcoin seems to respond more to monetary policy than inflation rates and while the rates have steadily climbed, it's not enough to shock the market, while monetary policy has largely stayed the same.
Technical analysis shows TOTAL, TOTAL2, and TOTAL3 crypto market cap charts all were rejected at key resistance areas in early December. Bitcoin broke the 2021 right shoulder around $46,000 to $73,000, then had a measured move up to $109,000, about a 55% move each, give or take. We're simply in a state where we've reached a key resistance level after a breakout while the market as a whole is in a state of uncertainty. I believe that uncertainty will lead to a capitulation down to the high $ 60,000s, even if it's a quick wick. This would likely lead to a $1,500 ETH, $1.50 XRP, it may look ugly. But take a look at past cycles; a 30-40% pullback for Bitcoin is just another Thursday in the crypto market. The alts can pull back as much as 50%-60%.
I think we wait for the buy signal. Look for a pullback to the breakout area at $69,500, and wait for the market to tell us that we found the buy zone with a strong candle close on or near its high on the Daily chart, likely somewhere around $75,000. Then I believe $150,000 is the area for this cycle high based on the Lifetime Resistance and measured move target. The measured move shows a 57% move up after the breakout; if we take that 57% move up and stack it on the mid-price of the current trading range at $91,000, that takes us to right around $150,000. Anything beyond that is a bonus. I think from there, it makes a second attempt to breach the high, followed by our 12-18 month bear market as shown in the chart.
💡 Trade Idea 💡
Long Entry: $75,000
🟥 Stop Loss: $55,000
✅ Take Profit #1: $105,000
✅ Take Profit #2: $135,000
⚖️ Risk/Reward Ratio: 1:3
🔑 Key Takeaways 🔑
1. Breakout above 2021 Cycle High $69,500
2. Psychological and technical high of $100,000 reached
3. Pullback phase has been in motion since December, breakout zone is the buy target
4. Wait for a two-legged pullback toward the Monthly 30EMA (breakout zone), look for strong buy signal, large bull candle closing on or near its high.
5. RSI is near 64.00 and below the Moving Average. Wait for contact and a drop toward 60.00 in concurrence with the price action to enter.
💰 Trading Tip 💰
It's reasonable to take half profits at the first resistance target in a long trade, or the first support target in a short trade. Using a 1:1 Risk/Reward Ratio for your first target, you can move your stop loss up to your entry price, locking in profits. This allows you to watch the rest of the trade execute without worry of losing money. This helps improve trading psychology and the equity in your account.
⚠️ Risk Warning! ⚠️
Past performance is not necessarily indicative of future results. You are solely responsible for your trades. Trade at your own risk!
Like 👍 and Follow to learn more about:
1. Reading Price Action
2. Chart Analysis
3. Trade Management
4. Trading Psychology

Bitcoin under 40k? Possible, but is this also probable?In life, anything is possible , and when it comes to crypto, everything is possible .
But, as I mentioned in my educational post yesterday, there’s a big difference between what is possible and what is probable.
In this article, I want to analyze the possibility of Bitcoin dropping below $40,000 and more importantly, what would need to happen for this scenario to shift from just possible to truly probable.
________________________________________
BTC — From All-Time High to Distribution?
If we look at the Bitcoin chart, we notice that after the first all-time high very close to $100,000 at the end of November, the market began a consolidation phase.
Although we saw two more all-time highs — one around $108,000 in mid-December and another near $110,000 in January — the entire structure from late November to late February appears to be a distribution pattern rather than a healthy continuation.
Once Bitcoin broke below $90,000, we can consider this distribution phase complete, with a target for short positions around $75,000 — a level I’ve highlighted in my previous posts.
________________________________________
Long-Term Logarithmic Chart — Diminishing Returns and the Bigger Picture
Looking at the long-term logarithmic chart, we can see a clear pattern of diminishing returns:
• The first major leg up, starting in late 2011, was approximately 600x and lasted about two years, followed by a correction.
• The next leg was 100x, spanning four years, followed by another correction.
• Then, a 20x rally, which lasted just over a year.
• Finally, the most recent leg up has been around 7x.
What’s crucial here is that returns are decreasing and, even more importantly, the last leg up looks more like an ascending channel than a parabolic move like in previous cycles.
________________________________________
The Significance of the Ascending Channel
This ascending channel is not unusual — the market has matured, and big players are now involved, reducing volatility.
However, ascending channels on the long-term often signal potential reversals, rather than continuation.
________________________________________
What Would Make $40,000 Probable?
Now, let’s address the real question: What would need to happen for Bitcoin to drop to $40,000?
Zooming in on the logarithmic chart, it becomes evident that the $72,000 - $75,000 zone is a major support confluence.
If this area is broken — meaning a weekly candle closes below this level — the scenario of BTC dropping toward $40,000 becomes probable.
The target zone I’m watching in this case is $32,000 - $36,000, a strong historical support that is clearly visible on higher timeframes.
________________________________________
Conclusion — Watch the Key Levels, Not What you Hope
To conclude:
• Bitcoin dropping to those extreme levels is possible, but not yet probable.
• Probabilities will shift only if key support levels are broken — specifically $72k-$75k.
• The market has matured, cycles are changing, and returns are diminishing, so expecting a repeat of past parabolic runs may not be realistic.
• As traders and investors, we must focus on the charts and key levels, not on hopium and hype.

Bullish Quasimodo in Play – Bitcoin’s Next Target: $84,500?Bitcoin ( BINANCE:BTCUSDT ) attacked the Resistance zone($84,130_$81,500) again as I expected yesterday . Has Bitcoin given up or is it gathering momentum to attack the resistance zone again? What do you think?
Bitcoin is moving near Yearly Pivot Point and Cumulative Long Liquidation Leverage($80,537_$78,390) .
From Elliott Wave theory , Bitcoin appears to be completing an Expanding Flat(ABC/5-3-5) corrective wave .
According to the Price Action , Bitcoin appears to be completing the Bullish Quasimodo Pattern .
Educational Note : The Bullish Quasimodo Pattern is a reversal pattern that signals a potential uptrend after a downtrend. It forms when the price creates a lower low followed by a higher high and a higher low, confirming a shift in market structure.
I expect Bitcoin will NOT leave the CME Gap($86,400_$84,650) unfilled and will rise to at least $84,500 .
What do you think, will Bitcoin leave this CME Gap($86,400_$84,650)?
Note: If Bitcoin falls below $78,800, we should expect further declines.
Please respect each other's ideas and express them politely if you agree or disagree.
Bitcoin Analyze (BTCUSDT), 1-hour time frame.
Be sure to follow the updated ideas.
Do not forget to put a Stop loss for your positions (For every position you want to open).
Please follow your strategy and updates; this is just my Idea, and I will gladly see your ideas in this post.
Please do not forget the ✅' like '✅ button 🙏😊 & Share it with your friends; thanks, and Trade safe.

BTC/USDT (Bitcoin) LONG SET UPEntry Price 1: $78,000
Entry Price 2: $73,000
Stop Loss: $63,000
Take Profit 1: $85,000 (Close 25%)
Take Profit 2: $98,000 (Close 50%)
Take Profit 3: $108,000 (Close 75%)
Take Profit 4: $118,000 (Close 100%)
Status: ACTIVE

Bitcoin Tests Resistance: Will the CME Gap Get Filled?Bitcoin ( BINANCE:BTCUSDT ) continued its downward trend as I expected in the previous post , but over the past 12 hours , Bitcoin has started to increase from Potential Reversal Zone(PRZ) . The question is whether this upward trend will continue in the past few hours or not !?
-------------------------------------------------------------------------
JOLTS Job Openings & Its Potential Impact on Bitcoin
The JOLTS Job Openings report will be released today, March 11 . It provides key insights into the U.S. labor market . This data can influence the Federal Reserve’s monetary policy stance , impacting risk assets like Bitcoin.
Potential Impact on Bitcoin :
Higher-than-expected job openings : Signals labor market strength, increasing the likelihood of Fed tightening → Bearish for Bitcoin
Lower-than-expected job openings : Suggests labor market weakness, increasing the odds of rate cuts → Bullish for Bitcoin
Historical Influence :
In previous months, JOLTS data has triggered volatility across financial markets, including crypto. For instance, a sharp decline in job openings last year led to a weaker dollar and Bitcoin rally. Conversely, stronger-than-expected job numbers have reinforced hawkish Fed expectations, pressuring Bitcoin.
I believe there's a higher probability that the JOLTS report will come in weaker than expected, which could lead to a short-term rally in Bitcoin and gold. However, if the report is stronger than anticipated, we might see temporary selling pressure in the market. What is your idea!?
Today's positive news was " Trump Plans Order to End Crypto Banking Restrictions ". In general, Trump's statements no longer affect the crypto market as much as before. Do you agree with me?
-------------------------------------------------------------------------
Now let's take a look at the Bitcoin chart on the 1-hour timeframe and use technical analysis tools .
Bitcoin is moving in the Resistance zone($84,130_$81,500) and near the 200_SMA(Daily) .
According to Elliott Wave theory , Bitcoin has completed five down waves , and we should wait for the next up waves . One of the signs of the end of wave 5 is the presence of a Regular Divergence (RD+) between two consecutive valleys .
According to the above explanation , I expect Bitcoin to re-attack the Resistance zone($84,130_$81,500) after a downward correction and attempt to fill the CME Gap($86,400_$84,200) .
Note: If Bitcoin can move above $87,200, we can expect the start of an uptrend.
Note: We should expect a bigger drop if Bitcoin falls below $72,000.
Please respect each other's ideas and express them politely if you agree or disagree.
Bitcoin Analyze (BTCUSDT), 1-hour time frame.
Be sure to follow the updated ideas.
Do not forget to put a Stop loss for your positions (For every position you want to open).
Please follow your strategy and updates; this is just my Idea, and I will gladly see your ideas in this post.
Please do not forget the ✅' like '✅ button 🙏😊 & Share it with your friends; thanks, and Trade safe.
