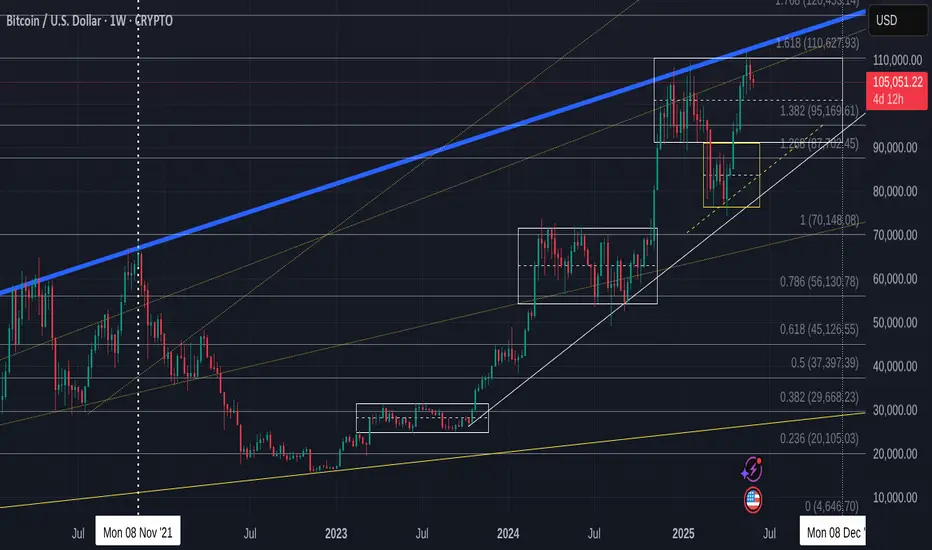
Bitcoin ATHBINANCE:BTCUSDT This is amazing for crypto community because this level-up all of lover crypto currencies.
Next target: 120.000K
Best for pollback levels: 111.000K & 105.500K
👓We are this time keep calms emotional in buy or sell.
Bitcoinath

Bitcoin Daily shows us that a HUGE Hurdle has been crossed
The question I will answer in this post is "What is the significance of that Blue line that BTC PA is now sitting on"
On the Daily chart, we can see it has been tested as support and Held.
Previously, it was resistance..
So what ? This has happened many times before.
Lets zoom out and look at the weekly.
So, we see that the Blue line was also the rejection zone in 2021.
Infact, if you look, it has rejected BTC PA 5 times since March 2021 and we have finaly managed to get over it and seem to be comfortable using ot as support now.
This leaves the door open to move higher once PA is ready
But there is WAY MORE to this
Lets look at the monthly chart
So now we see that that same Blue Arc has also been rejecting BTC PA since 2011.
That is nearly the entire life span of Bitcoin and it is certainly the entire life span of its current Bullish momentum since we entered the current channel we are in..
So, in many way, this could be seen as a new beginning, a New cycle.
We do need to remain cautious for now though. As we can see, we did get over this line in 2013 but fell back below......and of course, the possibility for this to happen again exists BUT we now have massive Corporate investment. This could stop that fall.
PA needed to get over this line or fall.
Should this fail to hold for now, we will return to lower lines of support, around 70K- 80K but I would anticipate a massive buying spree should that happen.
The next few months in Bitcoin are absolutely CRUCIAL.
We need to remain above this Arc.
And as I have shown months ago, this Arc is not just a line drawn freehand.
It is actually calculated and is part of a Fibonacci Arc.
The Monthly chart also shows us we are near the ATH Zone on a time span shown under PA on this chart.
We may not see the steep rise we have previously...but the Major Victory is remaining ABOVE this Blue Arc
Fingers Crossed

Bitcoin-is that it for now ? Lazy summer, take off in September?
Not posted this chart for a while but we may find it has become Very relevant to what to expect for the next few months
First thing to note is that PA is once again in TOP of range box and ALSO got rejected off the Long Term Blue line that has rejected BTC PA ATH since 2017. This also coincidened with the 1.618 Fib Extension.
Rejection here was highly likely and given how PA had pushed up, it is not surprising to see PA at least taking a breath.
For me, even though we do have the ability to push higher, I am not to sure we will just yet.
The weekly MACD could offer some credence to this idea
The Arrow points to an area that could turn out to be similar to what we are doing now.
The MACD has begun curling over after a prolonged push higher. While There was strength left, PA took a breath and regrouped.
The Chart below shows this period and how BTC PA reacted...and is circled
This was in Dec 2023 to Jan 2024.
PA had just had a sustained push higher and needed a break.and following a 7 week range, PA moved up another 67%
7 weeks from now brings us to near August.
There are charts that point towards a move in August / September
Here is another chart that offers some confluence to this idea.
The Dotted line is a line of support that PA has used as support numerous times this cycle and currently, is almost bang on the 50 SMA. Assuming that PA goes back down to that and bounces again, a 67% rise takes us back up to the Top of Range
Should we drop that far, to the 50 SMA again, we are in the 92K - 95K zone, scaring a LOT of people, wrecking Leverged players and putting Fear everywhere.
PERFECT FOR BUYING
This area also happens to be the 1.382 Fib extension on the main chart, the next Major line of support below us currently.
Should we fall through that, we reach the Bottom of Range and the intersection with the 50 SMA in.......August
So, we have to wait and see. We can push higher now but to do so would require breaking through that long term Blue line of resistance. I am not sure we can do that just yet.
Also, Should we post a RED June candle, Even a small one, the ideas in the Monthly candle post I recently posted also back up the idea of a lazy summer...... and a move higher around Mid to late August
Stay safe
Bitcoin Monthly Candle Colour Close since 2011 - looking forward
May Closed GREEN, and We are currently on a Very small Green candle for the month open.
Last month, in this series of monthly charts posts, I mentioned this..
"On only 2 occasions have we had a GREEN JAN, RED FEB, RED MARCH, GREEN APRIL
And Both of them were on the way to ATH. ( Arrows )
On both those occasions we had a GREEN MAY, though the gains were minimal and one was followed by a Green June and the other by a Red June."
And we just closed May with a minimal GREEN candle.
This is important to understand, This month, we have a 50/50 chance of repeating the Green June candle in this pattern.
Outside of this pattern, The previous MAY closes, 7 Green to 6 Red.
Of the 7 Green, 5 were followed by a Green June
With this, we have a higher % chance of a Green June
Of All previous June Closes, we had 7 Green to 6 Red.
Of those 7 previous Green June Closes, 3 were followed by GREEN July
Of the 6 previous RED Junes, ALL were followed by GREEN July
With this in mind, we maybe in a better position if we did close June with a small RED candle, as we did in the 2020 sequence ( right hand Arrow)
Should we close June RED, I will then expect a fairly level summer period with PA beginning to start moving again around September / October
Bitcoin PA is in an excellent position to move higher now though. It is also in an excellent position to move away from previous cycle patterns and begin creating new one.
We do have to remain vigilant as markets are moving everywhere and Macro conditions could change rapidly
But the one thing that seems to remain static is that it is a VERY GOOD IDEA to Buy Bitcoin and HOLD IT

BITCOIN new week open Green - Will we get 8 weeks Green in a row
These are all WEEKLY chart
7 weeks in a row closed Green.
At Time of writing, Bitcoin is around 109800 usd
So Very Bullish and every possibility that this week will also close Green though we are getting near a point of resistance.
If we zoom into the same chart, we can see more detail
We are above the 2.618 Fib extension and we could return to the 103K zone to test this as support. We may need to do this as it has only ever been resistance previously.
We are also very close to a 618 Fib circle.( Blue )
We do not know if this is an area of strong resistance yet but PA is now in the area that we may react to it.
As a result of this Fib circle, we need to be prepared for the possibility of reentering that rising channel,
We may not do that ,The reasons being that PA still has enough strength.
The MACD - or Moving Average Convergence Divergence, is a technical analysis tool used in trading to identify momentum and trend direction.
The 2 vertical lines on the left are the 2021 ATH points, to give a comparison.
In this cycle we have had 2 previous peaks and then the cooling off period from OverBought.
The Cooling off were the periods were BTC PA ranged..
We are currently rising Bullish, with room to move higher but we should be aware that we are in the area that rejected the 2nd ATH in 2021. The daily is in a very similar position but getting choppy.
The RSI - Relative Strength Index, a technical indicator used to understand the momentum of a price trend . The RSI helps signal when to buy and sell in a trending market by identifying overbought or oversold conditions in a security.
Again, the Vertical lines on the left show you the 2021 ATH points as reference.
See how RSI peaks before BTC PA Peaks.
We have not been fully OverBought since March 2024. RSI is rising Bullish with Room to move higher, though, again, note how it is in an area were rejection has occurred previously.
The Mayer Multiple is a ratio used in trading that compares the current market price of an asset, such as Bitcoin, to its 200-day moving average (SMA) price.
This indicator is particularly useful for swing traders to find zones of extreme overbuys and
It is generally considered a bullish indicator when the price is above the long-term moving average ( Yellow ) and bearish when the price is below it, although significant deviations from the moving average can indicate overvaluation or undervaluation.
Again, take note of the vertical lines and were this Mayer Multiple was.
Again, the tendency is that when this Drops, BTC PA has Ranged to cool off and when it crosses above its Average, it leads to a High on the push higher.
And once again, remembering what has been said above, we need to wait to see if this crosses its average or get rejected by it.
But as you can see, the Average is more often used as support amd mpt resistance.
So, in conclusion, I remain Bullish but with a note of Caution till we get a push higher conformed.
We could see a pull back and , if that happens, this maybe the last sensible buying Zone for Bitcoin this time round. The Risk is increasing as more and more coins enter into good profit margins. People may get tempted to sell.
On a longer term , this month has confirmed a very bullish intent and we have one week to go before month end. I will expand on this on 2nd June
This week. we wait and see how Bitcoin will react.
Be Kind to others. The world Needs LOVE

BITCOIN, something for the weekend sir ? - Don't expect to much
A qiuck return to the chart I been using most often
Bitcoin 4 hour
MACD turned BEarish
This is likely to drop to neutral at least before turning bullish again
The Daily MACD is still rising Bullish but turning down towards the Red signal line.
Push hhigher For Bitcoin price unliekly this weekend but possible...
As you can see, BTC PA has found support on a olcal rising line and is near the old ATH line.
That old ATH line needs to be reclaimed
Ultimately, PA could drop back to lower trend line around 105K but the Bulls have snapped PA back up from the recent dip, as seen on the long lower wick on the current candle.
Realisticaly, we have not even begun a push higher just yet, not until we get through that Fib circle above AND cool off the indicators I mentioned in the post earlier today
But this does show intent.......
Do Not Panic if the Price drops further, to many extents, it needs to and depending on the Bitcoin Dominance chart, this could lead to further gains in the ALT market.
ENJOY

Just a quick word of WARNING for BITCOIN- Local resistanceEasy to see and understand line od resistance here.
This is trhe line of rejection from 2017 and could well pose a problem in the short term
Technically, PA has the ability to break through this line but we need to see if it does.
BITCOIN is at a crossroads and this is just one of about 3 things that stand in ts way.
As mentioned earlier today, we have crossed one major hurdle today, this is the next one.
Hold on tight Guys and Gals, things could get very interesting but, for now, my preferred move for BTC is to range across for a little longer and come back to this next month
Unless the next 8 days are a strong push above this line and then try and stay above it

BITCOIN Seems to have Broken the LONG Term resistance- BIG DAY
The chart really does say it all
You can see the Arc, above PA that has rejected PA Every ATH since 2013
It created the point of rejection on 6 ATH in Total and presented a huge problem if it was not broken. And I can assure you, that arc touches Every ATH.
Just recently, this same line rejected PA Twice, with strength.
The Zoomed chart below shows you where we are now
This image shows you the two 2021 ATH points. and the last two touches { which I find remarkably close to the 2021 double ATH but in miniature }
And, as you can see, we have a candle ABOVE this Arc of resistance. and the Big question is now, WILL WE STAY ABOVE
And what is also notable is how this has happened perfectly at the end of the FIB TIME SCALE used.
This line will have to be tested as support one day and when that day comes, we really REALLY need to remain above.
And once we do that..we really will be in price discovery, in a way that we have never been before.
I am looking at some charts that may offer projected lines of resistance but I am waiting to see what happens here first before publishing them
ENJOY THE RIDE

BITCOIN — ALL TIME HIGH (2025)As of May 17, 2025, Bitcoin ( CRYPTOCAP:BTC ) is trading around $103,000, below its ATH of $109,000. Bitcoin might reach slightly above $140,000 in the late-June 2025, marking the top, IMHO.
TP1 - $120,000 (%50)
TP2 - $130,000 (%25)
TP3 - $140,000 (%25)

Bitcoin and the 2013 - 2017 Fractal Update - Have we left it >?
For now, I am going to say YES but maybe not completely.
If we look at the shape of the Fractal and what BTC PA is currently doing, it could be said that we have just completed 2 ranges in one go..the little one that Took us below the fractal and the other one that is next up the Fractal line.
But it is the next 8 weeks that will define this fully and for now, so as to not get caught short, literally, I am looking to that Dashed Arrow that comes off the circle.
Noe, I drew that circle back in late Feb ( posted in March ) and PA has just entered it, as can be seen on this Daily version of the same chart ( but with candles and not a line)
The fact that we have even entered this area tells me that the dashed Arrow is the path PA will take as a route of least resistance and with a possible ATH in Dec of around 322K USD.
That ATH is on the line of resistance drawn from the 2017 ATH and has rejected every Cycle ATH since. ( The line shown on the chart irons out detail but be assured, that line passes throgh the 2021 Nov ATH )
The possibility does exist, thogh gettign slimer, that PA could climb back over the top of the Fractal, though the push to do that would take a LOT of investment... possibly to much now.
So, I will sit happy, looking forward to a 370K -> 322K ATH later in the year..
And it MUST be said, as I always say, Look on both sides. There is a possibility that PA could Drop back to the 80K - > 72K line though I feel this is highly unlikely but we are now entering a zone of strong resistance
Things may get Volatile Soon.
But I would just like to say "THANK YOU" to the 2013 -2017 Fractal. You have taken us on a ride since Nov 2021 and shown us how to do things properly.
And so now.........New Adventures and Horizons await........Onwards and upwards

Bitcoin -potential to 91K, back to 78K wick to 73K and THEN -->>In this cycle, since the push up from the Low in Jan 2023, we have had 2 other Major pushes.
Each of these came off the Rising line of support that we are currently heading towards again, with the date of "Touch" currently in Mid June.
If we rise and stay back in the higher Range Box, that date is even later in the year ( around Mid Q4 )
As I have talked about many times, I am watching the MACD as the "trigger".
The chart below is the Weekly MACD
We reach Neutral , if we continue current rate of descent, around end of April
This is obviously before we would hit the line of support being talked about above.
That leaves 2 possibilities.
1) - MACD may drop below Neutral
2) - We may see a bounce from PA but NOT to a New ATH
If you look back at previous range we had in 2024, there was a bounce there.
See how the Histogram went White as we had that bounce
We Just had a white bar on the histogram .
Will we see another White bar next week and a further rise in PA
Top of current Range box in 91K - We could head to that again, Drop back to the Low around 78K and then we would be ready. This would be over the next 3 - 6 weeks
78K is the Price that touches that line of support the soonest, in early June
Why could we go back down?
For the reasons above regarding the MACD BUT ALSO ;-
There are things called FAIR VALUE GAPS (FVG)
. These gaps highlight market inefficiencies and potential trading opportunities, allowing traders to anticipate price movements and confirm trends.
That area just below Current PA on this weekly chart is the FVG that goes down to 73K
It is NOT guaranteed that PA will revisit that area but while we sit so close, the potential exists
But something to note, that could be benifical is that Should PA Drop to Fill that Gap, PA could hit that line of support earlier than Mid June..infact, it would be a month earlier and be in Mid May.
So, I can see the potential for a push higher in the near future, to extend MACD, then a drop back to the range Lows, a Sharp wick down to around 73K and THEN a sustained push higher...
This is just an idea.....No guarantees...But it does have Potential
We will see - Time will tell...........

Bitcoin Following 2013-2017 Fractal UPDATE 2We can see from the chart above that PA has now fallen below the Fractal for the first time since July 2023
This is itself was expected as we can see from previous posts on this Idea
PA was overbought and so HAS to cool off
However, we have targets as to when PA may try and recover.
initially, the circle in End of May was my expected "turn around" point
Things have progressed faster and so now, we have possibilities opening up for a move higher, sooner, maybe around end of April 2925
However until the weekly MACD is on Neutral, these would be short lived - hopefully.
For a sustainable move higher, PA needs to have the ability to maintain the push
the Weekly MACD shown above needs till end of April before any significant move can be maintained. PA has bounced of Neutral previously. But MACD can , obviously, Drop below this point, wait till May, or later, and move then.
For me, the line of the arrow higher is becoming the more realistic ideal path
But the longer we wait, the Steeper the rise has to be to maintain the idea of Cycle ATH in Q4, as per cycle trends.
And to conitnue to follow this Fractal.
The Time WILL come were we break away from this Fractal but as I have been saying for years, we are still on it......many things point towards that continuing.
But as I have mentioned in a post earlier today, These Trends may be changing.
Bitcoin is Maturing
All we can do is watch, react and learn
HAVE A PLAN FOR ALL OUTCOMES but also understand, the idea of Bitcoin collapsing is becoming more and more unrealistic...
The outlook is BULLISH noi matter what
I expect to remain on the fractal path till Next cycle ATH
Time will tell

BTC/USD Weekly Chart Analysis: Potential Price Scenarios in 2025Overview:
Bitcoin has displayed remarkable strength in the past few months, approaching critical levels in its long-term ascending channel. The current price action reflects bullish momentum, but there are key levels to watch for potential corrections or continuations. Here’s my detailed analysis based on this weekly chart.
Key Observations:
Ascending Channel:
BTC is trading near the upper boundary of a well-established ascending channel, which has historically acted as resistance.
If this boundary is broken with strong volume, the next potential target lies around $116,000.
Structure Levels:
A Weak High at $102,000 indicates the possibility of a short-term pullback before testing the resistance zone.
Break of Structure (BOS) and Change of Character (CHoCH) signals confirm bullish dominance, but corrections are part of healthy price action.
Moving Averages:
The 50-week and 100-week moving averages continue to slope upward, with price trading well above these levels, signaling a strong bullish trend.
Any retracement could find support at the 50-week MA or the mid-range of the channel.
Support and Resistance Zones:
Resistance: $102,000–$116,000.
Support: $76,000 (Golden Pocket) and $64,000.
Indicators:
RSI is currently overbought at 75, indicating the potential for a cooling-off phase.
MACD shows bullish momentum but hints at overextension as the histogram peaks.
Projected Scenario:
Scenario 1: BTC tests the Weak High at $102,000, faces rejection, and consolidates near the mid-range before attempting to break higher.
Scenario 2: BTC breaks out of the ascending channel, initiating a parabolic move toward $116,000.
Potential Risks:
A failure to hold support at $76,000 could lead to a deeper correction, testing key structural levels like $64,000 and $42,000.
Macro factors such as interest rate decisions or global economic uncertainties could heavily impact sentiment.
Conclusion:
Bitcoin is in a strong bull market phase, but caution is warranted near the upper boundary of the channel. Traders should monitor key levels and volume for confirmation of breakout or rejection. A pullback to the mid-range could provide an excellent buying opportunity for long-term holders.
Would love to hear your thoughts—do you expect a breakout or a correction? Let me know in the comments below!
Disclaimer: This analysis is for educational purposes only and not financial advice. Always do your own research before making trading decisions.

TradeCityPro | ZROUSDT Analysis Is It DeFi’s Turn to Shine👋 Welcome to TradeCityPro Channel!
Let’s dive into the analysis of ZRO, one of the popular DeFi coins. Recently, it has broken out of its consolidation range, signaling potential movement in the coming week.
🌍 Bitcoin Overview
Before diving into ZRO, let’s take a quick look at Bitcoin. Last night, BTC finally broke its 103,504 resistance, reaching a new ATH of 106,488.25!
Bitcoin dominance also ticked green, albeit mildly, allowing a few altcoins to move alongside. However, this Bitcoin leg-up is likely to maintain dominance growth.
📅 Weekly Timeframe Analysis
ZRO is relatively new, with only 26 weekly candles in its history. It’s a coin that distributed a portion of its tokens via airdrops to active users within its blockchain ecosystem.
Unlike other airdropped tokens, ZRO experienced less sell pressure and consolidated for about 20 weeks, providing excellent liquidity-building opportunities for us. Recently, it broke out of this box, indicating potential for further upward movement.
The weekly candle that closed last night reflects strong buyer presence despite some selling pressure. It’s a good buying opportunity with stop-buy entries and stop losses at 5.108 (risky) or 3.016 (safe).
🌞 Daily Timeframe Analysis
On the daily chart, ZRO recently broke the 5.033 resistance and formed a new resistance at 7.192, from which it faced a strong rejection. Unlike many other altcoins still stuck in corrective zones, ZRO has already returned to its recent highs.
After breaking 7.192, you can consider buying on this timeframe with a large stop loss at 4.068 or wait for consolidation at the daily range’s bottom before entering for a mid-term hold.
For added security, move your ZRO holdings to decentralized platforms and participate in the DeFi ecosystem to maximize benefits.
It’s important to watch for confirmation of the 7.192 breakout. Although volume increased during bullish moves and decreased during corrections, a strong breakout needs to be accompanied by high volume. The breakout of 65.45 RSI could also act as a strong trigger for momentum entry.
⏰ 4-Hour Timeframe Analysis
For futures positions, a strong resistance level has formed on the 4-hour chart. Breaking this resistance would provide clear triggers for the week ahead.
📈 Long Position Trigger
breakout above 7.012. The recent rejection strengthened the importance of this level. After breaking this resistance with increased volume, opening a long position becomes a viable option.
📉 Short Position Trigger
At this point, I’m not considering short positions. However, if the ascending trendline breaks, I’ll reconsider. For now, I’ll continue searching for lower-level long triggers in case buyers temporarily lose strength.
💡 BTC Pair Insight
Against BTC, ZRO has shown strength recently, moving toward its range high. A breakout above 0.00007239 would set the stage for significant upward movement relative to BTC. This could lead to even greater performance in its USDT chart.
🎯 Summary
ZRO’s breakout from its consolidation range, coupled with strong buyer activity, suggests an exciting opportunity for both spot and futures traders. Keep an eye on critical resistance levels and volume confirmations to secure the best entries.
📝 Final Thoughts
Stay calm, trade wisely, and let's capture the market's best opportunities!
This analysis reflects our opinions and is not financial advice.
Share your thoughts in the comments, and don’t forget to share this analysis with your friends! ❤️

$BTC is VOLATILE SO DONT PANIC SELLSimple chart here showing the red trend line I placed on the chart 4 days ago or so i posted other idea of it.. left it there just updated and for different time period this time. Also lower projection. Thanks I am new to chart making so it may not be perfect,, but red line again was placed there as a "guess" market move and it kinda has :P anyway enjoy :)

BTC - TARGET REACHED | REPLAY from OCT 2023 - NOWIt is with GREAT pleasure that I say, cheers to you and all the bulls that didn't believe the ATH was in after 74k in March! Although it may seem like I've been a perma-bull, there's been short-term bearish updates throughout the year - let's walk through it and see for yourself!
I will say this, there was a moment when I thought it might happen sooner, but generally I did repeatedly say I plan for the new ATH during December. Close enough!
It is incredibly rewarding to see the entire process playout as I speculated - based off of facts and many hours of analysis and charting since 2017. It all contributed, and makes a world of a difference.
I need some time to plan the next move from here, it will take some time to observe the top out - so keep following!
________________________
BINANCE:BTCUSDT

BITCOIN CYCLE TOP $118K - $125KBased on trend continuation that began in 2017, we can expect a Bitcoin top between $118,000 - $125,000. Based on previous halvings and ATH cycle tops, Bitcoin typically reaches its highest price 12 - 18 months after the halving. That would put this cycle ATH date between April 2025 and October 2025.
Feedback appreciated!
If you have a different price target, please share in the comments!

Why we're bullish on $BTC despite weakness over the past weeksThe INDEX:BTCUSD ATH can act as a strong key level, being strong resistance when price is under it and strong support when price is above it. Regardless of what the current market factors are at play now, we know one thing for sure, Bitcoin's break of ATH has without fail been a strong indicator of a bull market every single time since it's inception.
Now this does not mean that once we cross the ATH this means we are going straight the moon, we have to remember that a bull market is supposed to last for months, not weeks. What we are seeing now on Bitcoin is not an up-trend or a down-trend, it is a consolidation at it's previous cycle's ATH. Many investors and traders were probably thinking that once Bitcoin passes it's ATH, the asset magically becomes super bullish and that investors will never see a single red candle again for the next year. This however, is untrue as seen on the charts recently and also during previous breaks of ATHs.
From a statistical POV, the break of the ATH on Bitcoin is bullish, and that the price can continue to consolidate further before making it's way up, this is completely normal and the best move sometimes, is to do nothing and just be patient. We continue to be bullish as per our Crypto Bull Thesis and we will continue to send updates on the crypto market.

Bitcoin Bullish Outlook $170k is the next target for INDEX:BTCUSD . I used fibonacci extension to help me determine the next target. No excessive explanation because this beautiful chart explains everything.
Btw Bitcoin hit ATH before halving. Historic times for Bitcoin.

The Mother Of All Trades 🙏🏽 Billions Will Be Made!Imagine a world, where The Crypto Weather Channel had its own bank. That bank stored a large amount of its capital reserves in Bitcoin at the start of the Bull Market. This is what that would look like.
#Long
Take Profit: $66,442 (5th Halving Price)
Entry: $26,976 (CAT 1 Price)
Stop Loss: $15,473 (Market Cycle Low)

BTC new bottom and new topNew bottom 📉
I look to all high time for BTC and i found, Every new AHT, that comes a correction ( - 84% to - 93 % ) 📉
A B C D ( AHT )
A = D , B = C 👀
A = - 93 % correction
B = - 84 % correction
C = - 84 % correction
D = Until now ( - 69% correction ) i think we will go to - 93 % correction 👀
BTC ==> 12K $ 📉
BTC ==> 6k $ 📉
--------
New top or AHT 📈
after the correction we see new AHT
BTC ==> 74K $ 📈
BTC ==> 114K $ 📈

BITCOIN Deep Dive to find Bottom!Welcome Traders, Investors & Gamblers 😃
Let's Dive In and Find the Bottom!
Daily Charts:
Support & Resistance Levels
On a quick glance at this chart we would think that there isn't too much support in the area that Bitcoin is currently hangingon to, but down below I will go through all the indicators that lead me to call these current lows for Bitcoin in the beginning of the year already.
Weekly Charts:
200 Week SMA & Falling Wedge:
As mentioned yesterday, THE bullish scenario! Wick below the support and finish the week above the wedge support to go back and test the resistance.
2017 $20k ATH:
Right in the middle of major moving averages and Fibonacci levels we have the historic ATH from 2018.
Monthly Charts:
200 Week SMA, 50 Month SMA:
Pay attentio to the red circle, in the one instance where we touched the 200 week SMA but not the 50 month SMA we ended up falling short of a new ATH until we came back downand touched both moving averages.
Fibonacci Retracement:
The "Absolute Bottom" could lay around the.786 for BTC since we lost the .618 it would be logical to continue down to the next Fib. level and find a bounce there. As we know we have never closed a weekly candle below the 200week SMA and 50 Month SMA, but we have wicked way below on various ocasions with the last being in March 2020.
I would like to add that this is only for educational purpose and in no way a guarantee that it will play out this way, nor is this or are any of my posts financial advise.
As always, A BIG THANK YOU for stopping by, I hope you liked my post! If you did, please take a second to drop a like or comment, every engagement puts a smile on my face, but also helps me to get my ideas out to many more of you guys! 😃🙏
Happy Trading ✌♥📈

BITCOIN 1000 DAYS!Good Evening Traders, Investors & Gamblers 😃
The Idea is pretty simple, it took Bitcoin roughly 1000 days on average to get to a new All Time High after the previous one. That would take us to Summer (July/August) 2024 and roughly in line with the next Bitcoin halving!
I would like to add that this is only for educational purpose and in no way a guarantee that it will play out this way, nor is this or are any of my posts financial advise.
As always, A BIG THANK YOU for stopping by, I hope you liked my post! If you did, please take a second to drop a like or comment, every engagement puts a smile on my face, but also helps me to get my ideas out to many more of you guys! 😃🙏
Happy Trading ✌♥📈
