BCH camarilla pivots monthly futurethese are the next BCH camarilla and monthly pivot levels. I expect a reversion up to the Pivot or H3 before more downside
Bitcoincash

Bitcoin Cash To Grow Strong (70% Mapped Short-Term)We have Bitcoin Cash starting to wake up...
We are looking at the BCHBTC pair.
We have this descending channel which is very likely to break soon but still holding.
Today we have a new All-Time Low followed by a recovery while prices lurk above EMA10.
I believe we already looked at the bullish divergence with the MACD and RSI...
Once we reach bottom... What follows is UP!
Bitcoin Cash Ready To Grow!
Namaste.

Bitcoin Cash Oversold, Bullish Divergence + ATLBitcoin Cash hits a new All-Time Low while at the same time hits oversold on the RSI.
We have a strong bullish divergence with the MACD.
Based on other market factors not visible on this chart, we believe that Bitcoin Cash can bounce at this support level.
The last low around $107 should be the stop-loss in a manual way as we use it.
Any trading above this price and we are strongly bullish.
We are active on this one with leverage as well.
This is recommended for experts only as leveraged trading is ultra-high risk.
We are also active on this pair through SPOT trading and the BTC pairing below.
Remember to hit like, follow & comment for more.
Namaste.

Bitcoin Cash Descending Channel, New ATLBitcoin Cash vs Bitcoin (BCHBTC) just hit a new All-Time Low while trading within a descending channel.
We believe that this new low will work as support and can lead to a trend reversal.
The last low at 0.005210 should work as the stop-loss.
A full candle close below this level and the above analysis is invalidated.
Trading above this level opens the door for growth (green arrow).
Stay patient.
The cryptocurrency market will recover.
Bitcoin is also preparing to grow.
Namaste.

BITCOINBTC/USDT for now is on the consolidation zone for my opinion im waiting to drop on Strong Support after we touch this support we looking for new entry

BCH scalp - bounce from zone of interest📈Reasons to take short
⭐️ Buyer on BTC
⭐️ We came to liquidity zone
⭐️ Volume increased
⭐️ 3rd touch
⭐️ 110 ATR
Will enter when price squeezes to the trendline on 5m timeframe, the base will form and the tape will get faster.
If you don't understand the previous sentence, just use swing stop-loss 3-5%
Fix profit by parts:
1% - 1/3
2% - 1/3, stoploss to breakeven
What's left, hold to the maximum
What do you think of this idea? What is your opinion? Share it in the comments📄🖌
If you like the idea, please give it a like. This is the best "Thank you!" for the author 😊
P.S. Always do your own analysis before a trade. Put a stop loss. Fix profit in parts. Withdraw profits in fiat and reward yourself and your loved ones


Bitcoin Cash BCH short Entry Range, Take Profit and Stop LossBCH/USDT
Entry Range: $130 - 145
Price Target 1: $119
Price Target 2: $105
Price Target 3: $95
Stop Loss: $167

Bitcoin Roadmap Chapter 6This is a bullish potential on 200 weekly moving average , it never broke before but violated for 2 times ! look at the picture on chart or the comments!
I've been waiting for this moment for long time , just ready for 22k to 25k . This recommendation is just for spot and not for future or leveraged tokens.
Bitcoin can violate this area and drop more to 20 or even 18 , but it dose not matter , as we saw in history , it took less than a week to get back the MA200.
So , I AM GOING TO BUY 4 LAYERS ON THEASE PRICES .
Good Luck !

If Bitcoin (BTC) needs to beak key resistanceHi friends hope you are well, and welcome to the new update on Bitcoin.
Big wedge and a key resistance:
On a weekly time frame, Bitcoin is getting bounced from the support of $28600 and the support of a big falling wedge pattern. If Bitcoin breaks out $33K resistance, then there will be a high probability that billions of more dollars will be invested in Bitcoin's market and this can lead BTC to break out the resistance of the falling wedge pattern as well.
Short term supports and resistances:
On a short-term, hourly time frame, Bitcoin is moving between $29300, $29600, $30600, and $31700 supports and resistance levels. Right now after getting rejected by $31.7k resistance, it has tested $29.8k support and right now trying to break out the $30600 resistance level.
Descending triangle:
On a 4-hr time frame, Bitcoin is forming another descending triangle and if the king of all cryptocurrencies breaks out the resistance of this triangle, then it can break out the key resistance of $33k as well.
Conclusion:
On a short term BTC has found some resistance and also formed a triangle as well, but breaking out this resistance can lead BTC to break bigger patterns and resistance on a weekly time frame as well.
Note: Above idea is for educational purpose only. It is advised to diversify and strictly follow the stop loss, and don't get stuck with trade

Bitcoin Cash Adoption Continues to Swell WorldwideBitcoin cash supporters are known for spreading adoption over the years and 2022 is no different. This year, the peer-to-peer cryptocurrency bitcoin cash has seen significant adoption throughout the islands of the Caribbean, alongside places like Dubai, and Mumbai.
Bitcoin cash is also accepted at Burger King St. Kitts and the island’s Panda Supermarket accepts BCH. In St. Kitts, the crypto asset is further accepted at Sun Island Clothes, Karma Asian Cuisine, Econo Retail Shop, and Oracle Martial Arts Academy.
Merchants accepting bitcoin cash are prominent in a number of other regions worldwide including Anguilla, Antigua, Japan, Venezuela, Slovenia, Australia, Philippines, Vietnam, Ghana, Zimbabwe, Argentina, and more. Additionally, a good portion of the companies that take BCH for payments are accepting the digital currency directly, rather than using a third-party or payment processor.

Bitcoin Cash vs Bitcoin | Reversal Candle + All-Time LowWe have a huge reversal candle as well as an All-Time Low on the BCHBTC chart.
We love to see ATLs because this surely opens the doors for massive growth.
Once we hit bottom, the only place left to go is up.
Bitcoin Cash is ready to grow.
We are bullish on both pairs, BCHUSD and BCHBTC...
Visit the 'Related ideas' below.
Namaste.

Bitcoin Cash (5X Lev. Trade - 165% Potential)Did you enjoy ADAUSD on 10X leverage with over 400% of profits within 24 hours?
Do I have your support?
If Yes, hit LIKE now for more...
Let's how look at BCHUSD (Bitcoin Cash).
----
LONG BCHUSD
Leverage: 5X
Buy-in: $191 - $204
Targets:
1) $215
2) $240
3) $270
Stop-loss: Close daily below $185
Liq. price: $164
Potential profits: 165%
Capital allocation: 5%
----
This is not financial advice.
Leverage trading is ULTRA-HIGH risk, it can result in all money lost (liquidation).
Only for EXPERTS.
Let me know in the comments if you want more of these...
If you like higher or lower risk!
Namaste.

Bitcoin Cash (BCH) Buy ZoneBitcoin Cash (BCH) Buy Zone
--------------------
BIAS
Mid-Term : Neutral
Risk : Medium
Neutral 4 hours timeframe Bitcoin Cash remains around our current market structure mostly due to our latest drop towards to entry zone.
--------------------
$BCH/USDT LONG SETUP
Leverage : x3 - x5
Entry Price : 165 - 170
TP 1 : 175
TP 2 : 182.5
TP 3 : 187
TP 4 : 192
TP 5 : 200
TP 6 : 207.5
TP 7 : 217
TP 8 : 228
Stop Loss : 156.5
*Maximum 3% of Portfolio.
*Unload 12.5% at each TP. Whenever TP 2 hits, Move stop loss to entry.
--------------------

Bitcoin below 28k! Bitcoin
Intraday - We look to Buy at 26016 (stop at 25095)
With signals for sentiment at oversold extremes, the dip could not be extended. We look to buy dips. 50 4week EMA is at 26000. Bespoke support is located at 26000.
Our profit targets will be 28388 and 28988
Resistance: 29000 / 30000 / 31000
Support: 28000 / 27000 / 26000
Disclaimer – Saxo Bank Group. Please be reminded – you alone are responsible for your trading – both gains and losses. There is a very high degree of risk involved in trading. The technical analysis, like any and all indicators, strategies, columns, articles and other features accessible on/though this site (including those from Signal Centre) are for informational purposes only and should not be construed as investment advice by you. Such technical analysis are believed to be obtained from sources believed to be reliable, but not warrant their respective completeness or accuracy, or warrant any results from the use of the information. Your use of the technical analysis, as would also your use of any and all mentioned indicators, strategies, columns, articles and all other features, is entirely at your own risk and it is your sole responsibility to evaluate the accuracy, completeness and usefulness (including suitability) of the information. You should assess the risk of any trade with your financial adviser and make your own independent decision(s) regarding any tradable products which may be the subject matter of the technical analysis or any of the said indicators, strategies, columns, articles and all other features.
Please also be reminded that if despite the above, any of the said technical analysis (or any of the said indicators, strategies, columns, articles and other features accessible on/through this site) is found to be advisory or a recommendation; and not merely informational in nature, the same is in any event provided with the intention of being for general circulation and availability only. As such it is not intended to and does not form part of any offer or recommendation directed at you specifically, or have any regard to the investment objectives, financial situation or needs of yourself or any other specific person. Before committing to a trade or investment therefore, please seek advice from a financial or other professional adviser regarding the suitability of the product for you and (where available) read the relevant product offer/description documents, including the risk disclosures. If you do not wish to seek such financial advice, please still exercise your mind and consider carefully whether the product is suitable for you because you alone remain responsible for your trading – both gains and losses.

BItcoin on its FINAL TESTBitcoin is at daily support region of 28k - 30.8k, If we hold current levels we could see a pullback to 37k - 39.8k zones, which is going to act as major resistance. A failure to break this zone can send prices tumbling down to 20.1k - 16.4k key zone relatively quickly. We advice to not make any investments long term and hold your bags tight for the crash about to unfold should we not break the supply level.

The Bitcoin Cash bull run begins now!The falling wedge retest is complete, now Bitcoin Cash can finally start its bull run.
Long entry: 7600 sats
Take profit: between 1 / 1.3 btc
This is my personal opinion and this is not a financial advice! Good trading!
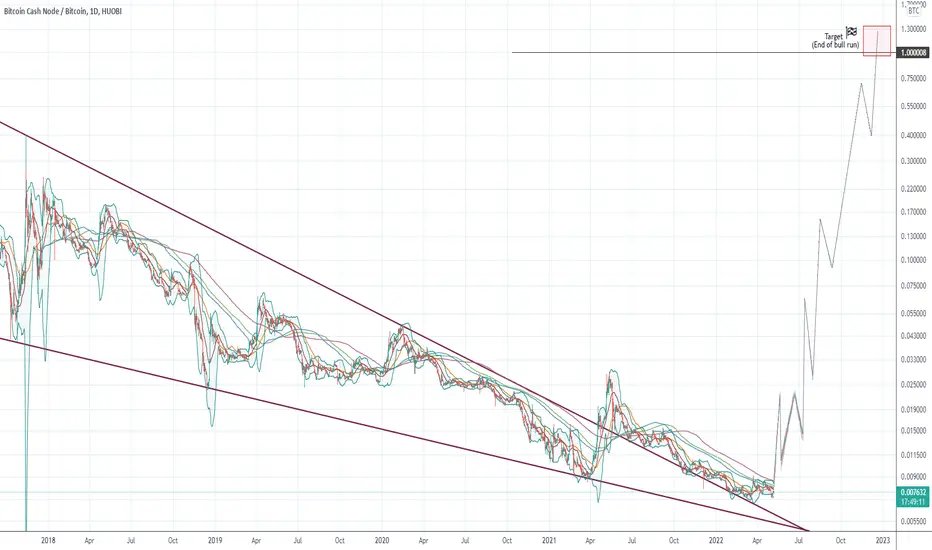
The Bitcoin Cash bull run begins now!Are you ready for the bull run of Bitcoin Cash?
Long entry: 270 usd
Take profit: between 200k / 400k usd
Between now and the end of the year it should grow about 1000 times
This is my personal opinion and this is not a financial advice! Good trading!

HIGHLY IMPORTANT DECISION TIME FOR BCH!Bitcoin Cash is a peer-to-peer electronic cash system that aims to become sound global money with fast payments, micro fees, privacy, and high transaction capacity.
Bitcoin Cash is high volume coin. Which is a good thing in a bull market.
But right now we are in bear market and at a very important price zone for bitcoin cash!
277 is a massive support area.
If we cant hold it price can test the 200 price zone which means a %25 decline in value.
Supoort areas
277
255
200
Resistance areas
293
342
387

HIGHLY IMPORTANT DECISION TIME FOR BCH!Bitcoin Cash is a peer-to-peer electronic cash system that aims to become sound global money with fast payments, micro fees, privacy, and high transaction capacity.
Bitcoin Cash is high volume coin. Which is a good thing in a bull market.
But right now we are in bear market and at a very important price zone for bitcoin cash!
277 is a massive support area.
If you look at number 5 on the chart, you shall see price action was around 277 for over 2 months.
After the breakout above price went parabolic rising 5x.
Also if you check number 1-2-3-4 on the charts, you will see everytime price break above 277 area and retest it, bch lose value and drop to the 200 price zone.
Support areas
277
255
200
Resistance areas
292
318
342
386
Short term outlook;
If we cant hold 277 now, we will probably see 200 price zone again!
Follow for more ideas and charts!

BITCOIN LONGS 📉📉📉BITCOIN - As usual price made a huge drop below sell side liquidity to take out retail stops, and closed bullish above on the D1 meaning there is a huge potential for the upside movement, fear/greed index is in extreme fear as well meaning there is a good buying opportunity.

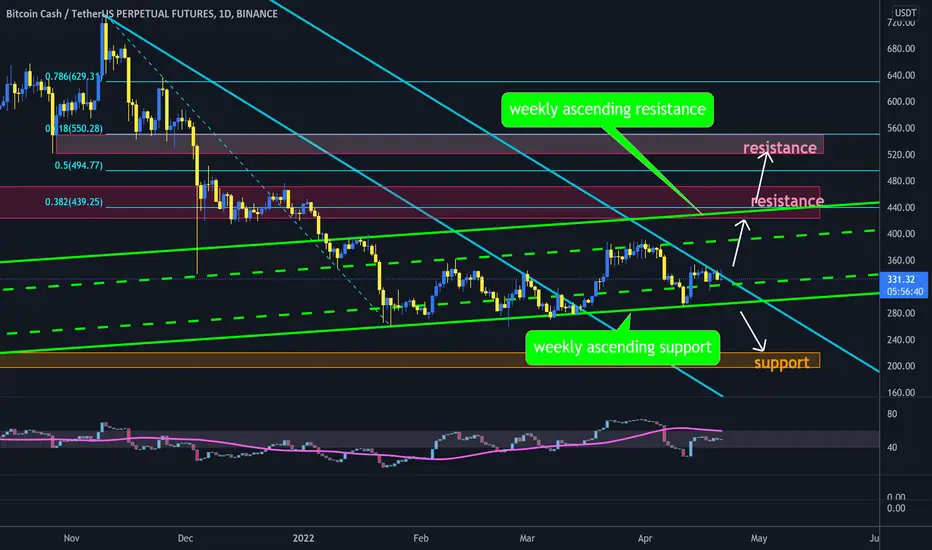
BCH trend lines#BCH/USDT
$BCH is trading between weekly ascending trend lines, also parallel descending trend line from all time high make resistance for price.
🐮 break out from descending resistance will increase price to ascending resistance that is the same with resistance zone around 0.382 fib level, and break out this zone will head up price to resistance zone between 0.5 and 0.618 fib levels.
🐻 rejection from descending resistance will drop price to ascending support that is so week because of so many touches and will drop more to long term support around $200.
#Bitcoin we have already reached half of our target 🚀#Bitcoin we have already reached half of our target 🚀
I AM SO BULLISH ON #BITCOIN 😍🚀
#BITCOIN LOOKS READY FOR ANOTHER MAJOR PUMP 🚀
#Bitcoin might extend its pump even higher!
