BCHBITCOIN CASH is in the good area. i think it complete the wave 2 and wants to start wave 3. there is low risk to good profit
Bitcoincash

#BCH BCHUSDT the sleeping dinosaur #BitcoinCashAnother sleeping giant is Bitcoin Cash here.
Let's go fundamental first:
1) BCH has smart contract developed by an independent team
2) It is disliked due to its founder and being BTC fork, yet it continues to thrive behind the scenes among its loyalists.
As for the technical aspect:
1) BCH has very high growing LONGS on BitFinex since the summer.
2) BCH continues to hover above its support drawn from Sep 2020 on the weekly chart.
3) BCH maintains the 40 RSI level on the daily, which is considered an untimely Long position entry in a bull run.
4) BCH is below the 0.236 Fib R level indicating an undervalued asset for accumulation
5) As per Ichimoku Cloud, BCH needs to close a daily candle above $640 for a leveraged long position. If and only if, the first target would be $840. However FIB R levels indicate far much higher targets on a longer term.
PS This analysis is provided as per the request of one of my followers. I hope you found the answers, you were seeking.

BCH in triangle#BCHUSDT
$BCH is inside a triangle and near the lower line that here is a long term support zone too.
if price hold this support, then can head up to upper line of triangle that there is a resistance zone.
break out from upper line will lead price toward resistance zone around $1000.
breaking down from lower line of triangle will drop price to long term ascending support and then more drop to around $390.

Bitcoin may dump to 52000$ be carefullBitcoin may dump to 52000$ for the short term.
be carefull do your own anlysis of the chart as well.

We are Officially in a Bear Market | 2021-2023 (imo)Since as recent as early 2020 (a little over a year ago), we've seen MASSIVE gains in amounts of 1,000%+
In my opinion, I think it is time for Bitcoin to cool off for 1.5-2 years.
Based off the OBV, RSI, and many other indicators we are seeing clear signs of a potential multi-year bear market.
The OBV (for the first time since the last massive crash in April) had just recently (yesterday: 11/16/21) crossed below its local big support.
The RSI on the daily and weekly time frames are showing clear bearish divergences.
Fundamentally, we are seeing signals from the richest people in the world in regards to a potential hyper inflation scenario + "The Mother of all Crashes" that could potentially occur.
Notably, Elon Musk is currently selling $TSLA stock like a mad man. In my opinion, I think it is pretty clear his social media posts were just an excuse to sell more "to pay his taxes", but really, because he may think we are going into a multi-year bear market, which will save him tens of billions (think about that...)
Ultimately, this is an amazing opportunity for everyone, whether you are broke or you are Elon Musk, to accumulate as much wealth possible before the next bull cycle. In my opnion, I think the next bull cycle will begin in early 2023 and end in late 2025-early 2026.
Good luck everyone and make sure to comment below your thoughts.
If you disagree please let me know why. I am very curious to see why some people may be bullish right now.
Best,
Matthew Park

$BCHUSD - Possible retraceHello everyone!
BCHUSDT demonstrated a great run and tested a major resistance zone.
Currently is extremely overbought and expecting a retrace from here to gain power and continue upwards.

Bitcoin Cash (BCHUSD): How to Catch Next Pump? 🤔
Top-down analysis on Bitcoin Cash.
Price action analysis & key levels.
Great buying opportunity explained.
❤️Please, support this idea with like and comment!❤️

Bitcoin Cash - Higher Timeframe Overview Bitcoin Cash has been showing clear price action indicating what's next.
We recently had a massive move down after a double top and now we are in an ascending correction. We retested the 78.6 fibonacci and rejected it.
We could trade within the ascending channel back to the highs. If we do break the ascending channel, we could make our ways back to the 400 level.

Bitcoin Cash (BCHUSD): Structure Breakout & Bullish Continuation
Bitcoin cash broke and closed above a key daily resistance cluster.
Now we see its retest.
I will expect a bullish wave from 622 - 656 demand area.
Next goal for buyers 782 - 802 resistance area.
❤️Please, support this idea with like and comment!❤️

BCH Elliott Wave Chart by CryptoKnee Looks like 640 held! At the moment, a potential Zig Zag down complete is possible, which would still fit with this count variant. A zig zag complete does not necessarily mean the correction is over, especially in a wave 4. So watching how this developes. Green done, yellow some more correction, red bad for short term bulls. Watching these support resistances which ever way it choses. Super bull, this is a 1,2 1,2. Bear this impulse, if completes, is a C of a ZZ.

BCH Breakout ✅ Done, it has potential to give us 10x profits!!Technical analysis: #BitcoinCash (Daily update)
. Symmetrical Triangle Upside Breakout ✅
. BChUSDT is breakout confirmation done as well as trading above the both MA's (21 & 50-
Day MA), and the beginning of parabolic uptrend is expected.
. The RSI is also TRYING to breakout its downtrend, if it could happen which give momentum bch from here.
Take Profits:
TP1= @ $1000
TP2= @ $1621
TP3= @ $2650
TP4= @ $3166 and then it could really more then $4000
SL= below 500 usdt on daily closed bases
🥰If you find this helpful and want more FREE forecasts in Tradingview😍.
Please show your support back🙏,
Hit the 👍 LIKE button,
Drop some feedback below in the comment✍️!
❤️🤝 Your Support is very much 🙏 appreciated!❤️🤝
💎 Want me to help you become a better Crypto trader?
Now, It's your turn!
Be sure to leave a comment; let me know how you see this opportunity and forecast.
Trade well, 💪
#bitcoincash #crypto #nextmove #bullmarket #dailyclosed

₿ DOGECOIN 1D ₿ : 10.Nov.2021Selling #DogeCoin at this price is pure stupidity :))) I can not say anything clearer than this , hold it up to at least 70 cents.
and if you don't have it , buy some ... at least 15% of your portfolio ...
Follow our other analysis & Feel free to ask any questions you have, we are here to help.
⚠️ This Analysis will be updated ...
👤 Arman Shaban : @Ar_M_An_4
📅 10.Nov.2021
⚠️(DYOR)

BCH Elliott Wave Chart by CryptoKnee Played out as suspected! Keeping an eye on the 650 area to hold and flip into support to keep things ideal. IF this is in a wave 3 it should keeping ripping. Not saying its done yet but will be looking for a wave for when it gives us a bit more info.

Long XEC - ECash (Bitcoin Cash ABC (BCHA))ECash - Bitcoin Cash ABC (BCHA) has rebranded to eCash (XEC) and has redenominated to a 1:1000000 ratio.
Long XEC
Entry 1: 0.000194; Entry 2: 0.000170
Exit: 0.000150
Target 1: 0.00021; Target 2: 0.00027; Target 3: 0.00039
Signal.
+ Classic bullish divergence from 12 Sep 21 to 27 Sep 21
+ Huge volume bar on 04 Nov 21 to push up price from 0.00017 to 0.00019

BCH-USDT trade setup It seems everything is ready for a 30% rally. Still waiting for the RSI breakout.
However, it would be good to enter now too.

BCH-USDT trade setup eyes on this trendline. I think it will breakout soon.
OBV is going to break the trendline too.

BCH Elliott wave chart by CryptoKnee. Quickie: Possible bullish scenario. Breaking 640 and hold as support would be a good start towards confidence in this count.

Bitcoin Cash Price Analysis: we expect BCH/USD to test $615 Bitcoin Cash has experienced yearly gains of up to 180% since January 1st, counting down to the second-to-last month of 2021. Thereby suggesting significant returns for cryptocurrency traders from the annual price opening of $342 to today’s daily high of $619.

BitcoinCash Ready for Breakout and Potential 500% from here.?#BCH/USDT TA Update :-
$BCH trading around $600
And Waiting to breakout $650
After Breakout $BCH will be fly.
Entry:- $550-$600
Targets:- $971/$1500/$2200/$3000
Stop Loss:- $490
Support:- $550/$490
Resistance:- $650/$971/$1507
Please click like button and Appreciate my hard work.
Must follow me for latest crypto real time updates.
Thank you.

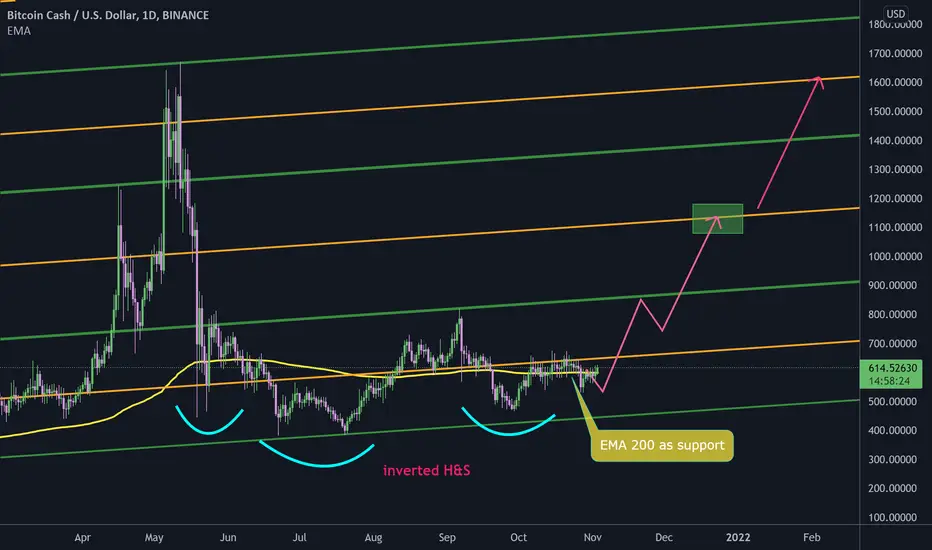
BCH inverted head and shoulders#BCHUSD
$BCH shaped inverted head and shoulders that price can reach $1000, a break above resistance of $1200 will rise price to $1600 and more.
BCH - The Phoenix Rises From AshesBehold the beast! For once it rises from ashes, there would be no stopping the underdog. The regal phoenix shall claim its rightful throne.

Bitcoin Cash - bull run targetsNothing new - if bitcoin surges, the whole market will rise. Rising tide lifts all boats.
These would be my views of targets. Barring any crazy Fud or some new major positive developments, which would move targets higher and/or lower. Even though my previous BCH idea hit all targets and built that as support range, no movement is guaranteed - trade at your own risk and set your stop losses

BCH/USDT TA UPDATE! Hello everyone, if you like the idea, do not forget to support with a like and follow.
Welcome to this BCH update. BCH looks very strong. It is in accumulation from many days. Currently, It's hovering inside a big triangle where the breakout is still pending. Once it breaks the triangle it will pump huge. So I'm buying some here and adding more in dips.
Entry range:- $530-$590
Target1:- $754
Target2:- $926
Target3:- $1100
Target4:- $1550
SL:- If any daily candle closes below $470.
Note:- This is a spot call. Buy it and hold.
If you like this idea then do appreciate it with like and follow.
Also, share your views in the comment section.
This isn't financial advice. DYOR before investing.
Thank You!
