BCH Sell the downtrend.BCHUSD - Intraday - We look to Sell at 538.4 (stop at 561.1)
Daily signals are bearish.
20 1day EMA is at 525.0.
Trend line resistance is located at 538.0.
Preferred trade is to sell into rallies.
Our outlook is bearish.
Our profit targets will be 481.1 and 471.1
Resistance: 525.0 / 540.0 / 550.0
Support: 510.0 / 500.0 / 490.0
Bitcoincash

Bitcoin Cash Channelling Higher Towards 650Disclaimer
The views expressed are mine and do not represent the views of my employers and business partners. Persons acting on these recommendations are doing so at their own risk. These recommendations are not a solicitation to buy or to sell but are for purely discussion purposes. At the time publishing, I have a position in Bitcoin Cash.
Trend Analysis
The main view of this trade idea is on the 2-Hour chart. The cryptocurrency is in an upward trend channel, with the lows around the 386 and 488 price levels. Also based on a market profile, Bitcoin Cash is currently trading within a confluence or support/resistance zone, which would indicate some level of consolidation and choppiness.
Technical Indicators
Bitcoin Cash recently crossed above its short (25-SMA), medium (75-SMA) and fractal moving averages as it held the lower support trend channel. The RSI also crossed around the same time that support was held. Moreover, the KST confirmed the bullish move with a positive crossover.
Recommendation
The recommendation will be to go long at market. At the time of publishing Bitcoin Cash is trading around 531.75. The medium-term target price is observed around the 650 price level, which is the bottom at the confluence zone while a stop loss should be set around the 490 price level. This produces a risk-reward ratio of 2.83.

BCHUSDT triple top#BCHUSDT
$BCH form a triple top pattern.
to complete this pattern price have to close a 4h candle below the support zone.
If it happen #BCH will drop to $440 and $420
But if this zone support the price strongly, $BCH can go up to $430 and $440 again .

BCHUSD Curved ChannelAn idea for BCH
Included how I believe the MA's will play out, they can be identified with the arrow on the end
The curve provides a massive support
Even at the previous ATH it is a massive increase from where we are now

The Crypto Cross BCHXBT in Upward Trend Channel on 2 Hour ChartDisclaimer
The views expressed are mine and do not represent the views of my employers and business partners. Persons acting on these recommendations are doing so at their own risk. These recommendations are not a solicitation to buy or to sell but are for purely discussion purposes.
Trend Analysis
The main view of this trade idea is on the 2-Hour chart. BCH/XBT had a low in late June 2021 at 0.01331. The crypto cross proceed to form an upward trend channel with what appears to be several support/resistance zones in the trend channel. The most prominent support/resistance zone is the 0.1472-0.1505 price region. Traders can anticipate some possible market entry at that support/resistance zone which is a bit below the middle of the upward trend channel. A resistance zone is perceived in the 0.154-0.156 price level, which is near the upper region of the upward trend channel. The support/resistance zones are supported by the market profile indicator.
Technical Indicators
The short (25-SMA), medium (75-SMA) and fractal moving averages are trading below BCH/XBT which exhibits positive price movements in the respective timeframe. At the point in publishing, the short (25-SMA) and medium (74-SMA) term moving averages are in the process of having a positive crossover, which is also a bullish sign.
The KST is also confirming positive price movements with a bullish crossover. Also, the KST is channeling higher over the chart review period. RSI is trading above 50, which shows positive price momentum and approaching overbought levels.
Recommendation
Recommendation will be to go long around the 0.1494 price level with a stop loss at around 0.1436. Initial profit target level will be at 0.156. This produces a risk reward ratio of 1.18.


BCHUSDT - LONG SETUPBCHUSDT has provided us with a nice correction since its recent bullish impulse, market is currently testing the 0.50 fibonacci and rejecting it. On the 4hr timeframe price is currently respecting this corrective counter trendline forming lower lows, we are waiting to see if the market will close above this resistance on the 4hr timeframe then we can take the long on the retest of this zone.

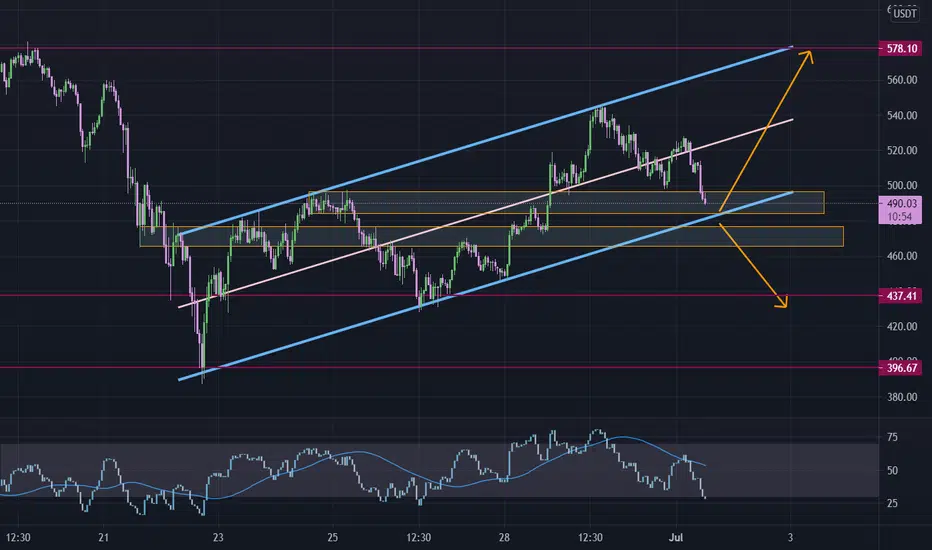
BCHUSDT in parallel channel#BCHUSDT
$BCH in 1 hour chart is trading in ascending parallel channel, now price is near lower line of this channel, that is the same as string support zone.
It can touch $480 and go up toward $570
But if price break down, #BCH can drop to $437 and lower.
BTCUSDT June 22,2021This is the big head and shoulders that I was talking about in my last idea.
Long term bullish trend is broken, The bullish channel is lost, Triangle is broken from the bottom . If price rise from here, seems to me it will be only a pull back to the broken trend line and then it will go down again.
$30k is the neckline of this big bears pattern, after it breaks then you can see the targets on chart which is $24k and $19k .


Come on Bitcoin. You can make this miracle.The poc is perfectly allined with the weekly resistance, on the daily chart. We need just some little effort. Come on Beauty!

BCH CHART ANALYSIS DAILY TIMEBITCOIN CASH IS RESPECT OF IMPORTANT SUPPORT AND PULL BACK...
BUT WE WILL HAVE TO MORE CAREFUL THAT IF SUPPORT BREAK THEN BCH PRICE MAY GO DOWN TOWARDS 250/200$

Looking for a downturn on Bitcoin Cash BCHUSDI just don't believe yet that we are impulsing again. This one is more likely to drop before it rises again.


Bitcoin Cash (BCH) - June 23Hello?
Welcome, traders.
By "following", you can always get new information quickly.
Please also click "Like".
Have a good day.
-------------------------------------
(BCHUSD 1W Chart)
If the price holds above the 517.20 point, it is expected to turn into an uptrend.
(1D chart)
We need to see if we can find support at 435.70 and move up to the 486.28-599.87 section.
If it declines from the 343.10 point, there is a possibility of entering the mid- to long-term investment area, so careful trading is required.
The price should remain in the range 599.87-827.06 to convert into an uptrend.
However, it is recommended to check the BTC price movement as there is a possibility that the price may fluctuate depending on the movement of the BTC price.
-------------------------------------
(BCHBTC 1W chart)
You need to make sure you can sustain the price in the big box range 0.011530-0.048430.
In order to turn into an uptrend, the price must rise above the 0.024777 point and hold the price.
(1D chart)
We should see support at the 0.013651 point and see if we can move towards the 0.014655-0.016063 section.
If it continues to fall, it could touch the 0.011530 point, so you need to think about how to react.
The price should remain in the 0.016063-0.018878 range to convert into an uptrend.
------------------------------------------
We recommend that you trade with your average unit price.
This is because, if the price is below your average unit price, whether it is in an uptrend or in a downtrend, there is a high possibility that you will not be able to get a big profit due to the psychological burden.
The center of all trading starts with the average unit price at which you start trading.
If you ignore this, you may be trading in the wrong direction.
Therefore, it is important to find a way to lower the average unit price and adjust the proportion of the investment, ultimately allowing the funds corresponding to the profits to regenerate themselves.
------------------------------------------------------------ -----------------------------------------------------
** All indicators are lagging indicators.
Therefore, it is important to be aware that the indicator moves accordingly with the movement of price and volume.
However, for the sake of convenience, we are talking in reverse for the interpretation of the indicator.
** The wRSI_SR indicator is an indicator created by adding settings and options to the existing Stochastic RSI indicator.
Therefore, the interpretation is the same as the traditional Stochastic RSI indicator. (K, D line -> R, S line)
** The OBV indicator was re-created by applying a formula to the DepthHouse Trading indicator, an indicator disclosed by oh92. (Thanks for this.)
** See support, resistance, and abbreviation points.
** Support or resistance is based on the closing price of the 1D chart.
** All descriptions are for reference only and do not guarantee a profit or loss in investment.
Explanation of abbreviations displayed in the chart
R: A point or section of resistance that requires a response to preserve profits.
S-L: Stop Loss point or section
S: A point or section where you can buy to make a profit as a support point or section.
(Short-term Stop Loss can be said to be a point where profit and loss can be preserved or additional entry can be made through split trading. It is a short-term investment perspective.)
GAP refers to the difference in prices that occurred when the stock market, CME, and BAKKT exchanges were closed because they are not traded 24 hours a day.
G1 : Closing price when closed
G2: Opening price
(Example) Gap (G1-G2)


Bitcoin Cash - Approaching Pivotal Point - Do Not Miss!BCH is approaching a key area where we will find out if we're still continuing to be bearish or if we'll have some sort of reversal. The key are to focus on is the 450-500 area where we have a recent bottom.
If price action shows bullish pressure, we can find entry reasons such a break of the wedge pattern.

BITCOIN CASH ANALYSISBCHUSD trading in downtrend line
price rebounded from key level around 630
price below HVN around 620
price below SMA 100
RSI in downtrend line below 50
so its expect bearish movement to support level around 500

Bitcoin Cash broadening formationIf this support will be saved, then the price action can go for another higher high.


Bitcoin Cash (BCH) formed bullish Shark for big moveHi, dear friends, hope you are well and welcome to the new update on Bitcoin Cash (BCH).
Previously we had a nice trade of BCH:
Now this time, on the 4-day chart, the price action o BCH has formed a bullish Shark pattern. The priceline has already visited the oversold zone as it was dropped up to $468 and moved up. However, if the 50 simple moving average will be broken down, then it can give us another chance to catch it from the buying zone of this pattern. There is also 100 simple moving average support in the potential reversal zone.
Buying and sell targets for Shark move:
Buy between: $530 to $340
Sell between: $789 to $1265.42
Stop loss:
The maximum extent of the potential reversal zone at 1.13 Fib level can be used as stop-loss which is $340.
.
Possible profit and loss ratio:
As per the above targets, this trade has a profit possibility of 270%, and a high loss possibility up to 36%.
Note: Above idea is for educational purpose only. It is advised to diversify and strictly follow the stop loss, and don't get stuck with trade.

BCHUSDT - SETUPBCH is breaking out of this symmetrical triangle formation towards the upside, although we are currently just below this horizontal resistance, for this setup to be valid we need to see a 4hr close above this zone then on the retest we can look to enter.
