Bitcoin Cash (BCH) - February 15Hello?
Dear traders, nice to meet you.
"Like" is a huge force for me.
By "following" you can always get new information quickly.
Thank you for always supporting me.
-------------------------------------------------- -----
You need to make sure you can get support on the 706.21424190-741.41976359 section.
If you go down from 706.21424190 point, you can touch 600.59767260 point, so you need to trade carefully.
If you fall between 574.28197715-600.59767260, you need a short stop loss.
We must see if we can break above the 741.41976359 point and ascend towards the 856.32 point.
-------------------------------------------------- -------------------------------------------
** All indicators are lagging indicators.
So, it's important to be aware that the indicator moves accordingly with the movement of price and volume.
Just for convenience, we are talking upside down for interpretation of the indicators.
** The wRSI_SR indicator is an indicator created by adding settings and options from the existing Stochastic RSI indicator.
Hence, the interpretation is the same as the conventional stochastic RSI indicator. (K, D line -> R, S line)
** The OBV indicator was re-created by applying a formula to the DepthHouse Trading indicator, an indicator published by oh92. (Thank you for this.)
** Check support, resistance, and abbreviation points.
** Support or resistance is based on the closing price of the 1D chart.
** All explanations are for reference only and do not guarantee profit or loss on investment.
Explanation of abbreviations displayed on the chart
R: A point or section of resistance that requires a response to preserve profits
S-L: Stop Loss point or section
S: A point or segment that can be bought for profit generation as a support point or segment
(Short-term Stop Loss can be said to be a point where profits and losses can be preserved or additionally entered through installment transactions. It is a short-term investment perspective.)
GAP refers to the difference in prices that occurred when the stock market, CME, and BAKKT exchanges were closed because they do not trade 24 hours a day.
G1: Closed price
G2: Market price at the time of opening
(Example) Gap (G1-G2)
Bitcoincash

BCH . Bitcoin Cash . 854 and 1217Fib Extensions 854 and 1217 in play.
Restest of previous high may have already been complete.
See levels and leave questions in comments.

BCH/USD - Trying to break out of the 15 min channel!Please see my other idea on BCH. Let's see if it can break the channel and resume upward movement! KRAKEN:BCHUSD


BCH/USD just broke Longterm Resistance!As you can see the 664-668 level has been a strong resistance for years now after being a strong support previously. This has just been breached. As we have seen the crypto market has been going and BCH has been lagging. Others have reached their 2017 ATH... BCH isn't even a quarter of the way to its 2017 ATH... I don't love the coin, but my guess is to strap on the moon boots for this one...

BCH - Target $900 Since the last time I updated you BCH is up 35%. We are in bullish momentum right now, 2 resistance (525 and 630 are broken), now we are looking for resistance $880. If we close the weekly candle above $650 today, it is for first time after 2.5 years and that’s good news. But first we have to backtest the broken resistance $630, if that holds, then we are ready for $880. Be patient and don’t panic 🚀🙌🏼


BCH: see you at 1050$!Nice C&H and channel broke out, waiting for the retest (if any).
Please hit LIKE if you find this useful!

Bitcoin Cash - Major Breakout - Too the moon $10kThis is in a long time, I had my eyes watching it for long time as well.
We broke out of ascending triangle which was going on for almost 2 years... you know it consolidated a lot but never given the foot hold.
The immediate next target is 600, once crossed, should be without much resistance we face real challenge around 1500-1800-2000 zone... this will be tough fight but we shall be clear above $2k in few weeks.
Imagine everyone moving major money off BTC to BCH... we will be at 50% parity with BTC

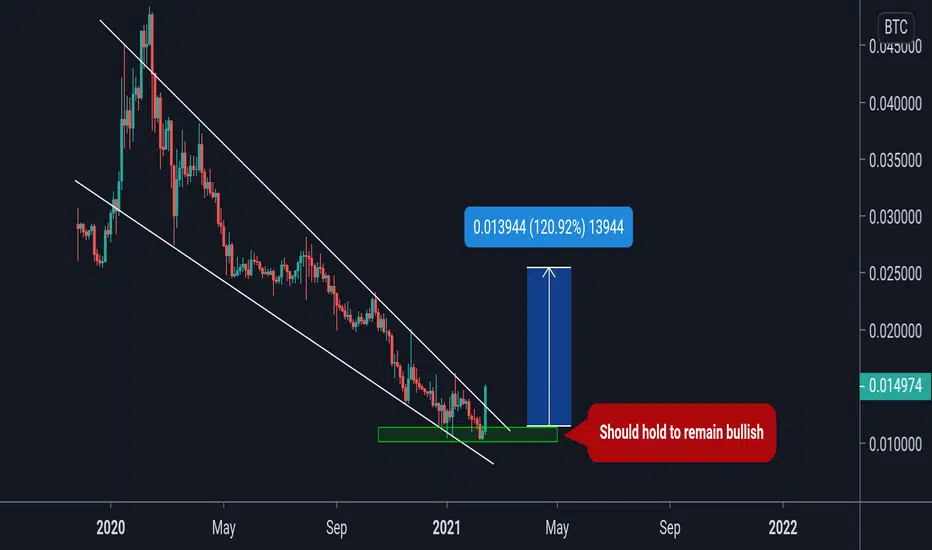
BCH/BTC breakout of gaint falling wedgeBCH / BTC
Big move detected in BCH/BTC pair
We can see Breakout of gaint falling wedge
If local support (green area) hold
The next target is more than 100% from support area
If you look at chart with USDT pair
BCH/USDT just broke heavy resistances first time since 2018
This idea doesn't mean buy or sell
Do your own research before any trade
Good luck
BITCOIN CASH REBIRTH ! $1000 SOON?Bitcoin cash / USDT is breaking its all time high on binance
Looking juicy for a nice touch of the $1000

BCH Ready to Launch!No need drawing here. All looks Cool!
Hope for Week bullish!
Invest at your risk!
All investment carries high risk.
Happy trading :)

BCHUSD $712 Next LONG TargetBitcoin Cash is now in a bullish swing with just having re-gained the $515 level of resistance as support. From here, BCH looks like its going to hit $630 and then try to touch $721 on this cycle.
BCH has also been a sleeper 💤 but will follow the price of BTC and ETH going long.

BCH is trying to break through a huge ascending triangle.I don't like BCH, but... The chart looks good.
I think BCH ready to take off. BCH about to break through monthly ASC.


BCH completed Butterfly move for almost 400% big moveHi dear friends, hope you are well, and welcome to the new update on Bitcoin Cash.
On the long-term monthly chart, the price action of the BCH with Bitcoin pair has completed the last leg of the bullish Butterfly pattern and entered the potential reversal zone. The 1.618 Fibonacci retracement level goes in the negative zone and it is not possible for the priceline to enter the negative territory, sofar the priceline has found good support at 0.01052 btc , therefore I have set the buying range from 1.27 Fib level to 0.01052 btc , however, if in the near future there will be some changes, like the priceline finds any new support then I will be keep sharing with you.
There is also a very good downtrend line support as well.
This trade has a huge profit possibility of 399%, and the high loss possibility upto 9%.
Note: Above idea is for educational purpose only. It is advised to diversify and strictly follow the stop loss, and don't get stuck with trade.

BCH - Are You Ready?I updated you last week that we have broken the trendline and it is time to buy, since then BCH is up 25%. Now it is time to break the resistance $525-535 to move further. Once we break the resistance we are ready to takeoff. + We have RSI above 60, MACD still green and we all know that BCH is undervalued compared to the other coins. Let’s go 🚀

BCH still got lots of potentialsWarning: our thoughts are ours; not financial advice.
BCH may seem slow, but it's sure on course. HODL on.
We could see BCH as high as $1,000 in the short-term.

BCH LONG!The boundary between the two blue lines is very important!
The price is in a short bullish range and has managed to break the blue range well!
Now in the pullback, the range between the two blue lines is a good place for a steady rise in price
Return to Broken level of highest WR% is a sign of a strong price increase in the near future!
You can trade with three views! Short-term with a goal in the range of 571
Low-risk medium-term with a target of about $ 670 and high-risk medium-term with a target of about $ 1,000

$BCH/USDT 4h (Binance Futures) Descending triangle breakoutBitcoin Cash is looking very bullish here, let's try to catch a decent dip for continuation trade.
Current Price= 504.30
Buy Entry= 471.05 - 449.35
Take Profit= 561.95 | 727.97 | 874.27
Stop Loss= 408.45
Risk/Reward= 1:2 | 1:5.23 | 1:8.09
Expected Profit= +44.48% | +116.72% | +180.36%
Possible Loss= -22.30%
Fib. Retracement= 0.786 | 1.272 | 1.618
Margin Leverage= 2x
Estimated Gain-time= 480h
