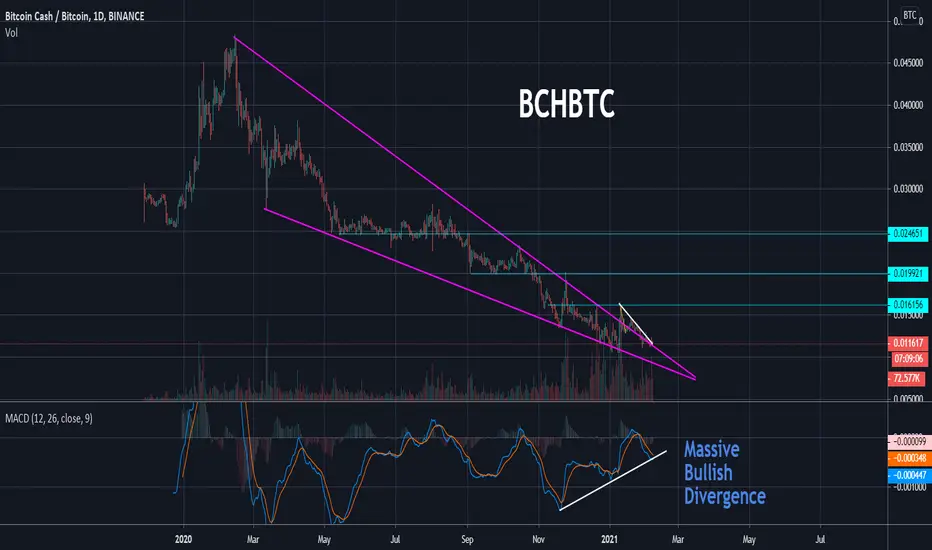
BCH/BTC 300% potential from here so read full update#BCH/BTC TA Update:-
#BCH/BTC looks good at this level.
I am buying here some and waiting for breakout upward site.
Keep an eye on Red box.
This red box is very important for bull of #BCH
Entry:- 0.0115-0.01156 BTC
Targets:- 0.0156/0.02/0.025/0.035 BTC
If you want to hold then this is good potential.
If candle close below support level then bearish.
Please click LIKE button and Appreciate my hard work.
Must follow me for latest crypto real time updates.
Thank you.
Bitcoincash

BCH - Bitcoin Cash Looks Ready to Explode!BCH is one of few alts that has yet to have its own bull run against BTC. However, I love this daily set up. BCH broke out of its year long falling wedge and has been coiling up for what I think will be a big break out. Take a look at the massive bullish divergence on the MACD. I'm long here!
BCH - Fair Value $4000 Good news, we have now re-test the trend line and the support level $400 held. Now we have to break the resistance $525 to move further. Something is very strange and that is BCH is very undervalue compared to other coins, because according to Total Market Cap exclude BTC the fair value for BCH most be around $4000.

BCH breakout. UPDATEThis is not financial advice. I am shocked that BCH hasn't moved with the whole market yet. This is one of my biggest sleeper picks of the year and my longest term position that I created this past year. BCH is essentially upgraded BTC. I wont go into too many details and Ill let people do their own DD. But Paypal has BCH listed and many of the crypto OGs such as Roger Ver are into BCH for its tech and its operability. This shows a lot because Roger Ver was a bitcoin maximalist from the early days of btc. He knows promotes BCH as it is the new BTC.

BITCOIN TO 50K SOON!I HAVE SO MUCH CONFLUENCE TO PRICE IS GOING UP!, 1. FLAG BULLISH DAYLI, Broke FLAG, RETEST AND GOING UP TO 50K, 2- PATTERN HEAD AND SHOUDER INVERTED. POSSIBLY RETEST TO ZONE 35-34K CONFLUENCE GOLDEN ZONE 50%, 61,8% FIBONACCI.WE STILL HAVE AN EXTREMELY BULLISH YEAR FOR ALL CRYPTOCURRENCIES. always with responsibility and good risk management enjoy!

Bitcoincash (BCHUSDT) Technical analysis updateBCHUSDT (4h CHART) Technical Analysis Update
Resistance zone breakout
BCH/USDT currently trading at $462
Buy-level: $455 to $465 level
Stop loss: Below 410
Target 1: $540
Target 2: $625
Max Leverage: 2X
ALWAYS KEEP STOP LOSS...
Follow Our Tradingview Account for More Technical Analysis Updates, | Like, Share and Comment Your Thoughts.


A huge cup&Handle and Symmetrical Triangle seen in 1hr TF of BCHA huge cup&Handle and Symmetrical Triangle seen in 1hr TF of BCH that could cause new ATH for BCH! and could even pump more to moon!
Only if BCH will follow my chart idea...
Trade at Your own Risk!

Bitcoin Cash (BCH) - February 6Hello?
Dear traders, nice to meet you.
"Like" is a huge force for me.
By "following" you can always get new information quickly.
Thank you for always supporting me.
-------------------------------------------------- -----
We have to see if we can get support at 435.40010001 and climb above 501.0.
In particular, you need to make sure you can get the support at 454.59999980 to give off the power of your ascent.
If you drop from the 411.87118638 point, you can touch the 324.10000000 point, so you need to trade carefully.
If you fall at the uptrend line (2) or at 367.31848226, you need a Stop Loss to preserve profit or loss.
(1W chart)
The 411.87118638-501.0 section is an important volume profile section.
-------------------------------------------------- -------------------------------------------
** All indicators are lagging indicators.
So, it's important to be aware that the indicator moves accordingly with the movement of price and volume.
Just for convenience, we are talking upside down for interpretation of the indicators.
** The wRSI_SR indicator is an indicator created by adding settings and options from the existing Stochastic RSI indicator.
Hence, the interpretation is the same as the conventional Stochastic RSI indicator. (K, D line -> R, S line)
** The OBV indicator was re-created by applying a formula to the DepthHouse Trading indicator, an indicator published by oh92. (Thank you for this.)
** Check support, resistance, and abbreviation points.
** Support or resistance is based on the closing price of the 1D chart.
** All explanations are for reference only and do not guarantee profit or loss on investment.
Explanation of abbreviations displayed on the chart
R: A point or section of resistance that requires a response to preserve profits
S-L: Stop Loss point or section
S: A point or segment that can be bought for profit generation as a support point or segment
(Short-term Stop Loss can be said to be a point where profits or losses can be preserved or additionally entered through installment transactions. It is a short-term investment perspective.)
GAP refers to the difference in prices that occurred when the stock market, CME, and BAKKT exchanges were closed because they do not trade 24 hours a day.
G1: Closed price
G2: Market price at the time of opening
(Example) Gap (G1-G2)

Bitcoin Cash - Exiting a downtrend - price reversal BCH/USDTThe price of the coin is consolidating in a falling wedge-shaped trading range. This figure is bullish and indicates a set of positions by a major player. The confirmation will be going out of the trading range. My focus is on the global key resistance line.
Cluster analysis - large volume
Indicators - price reversal up
Break of the wedge -> exit from the trading channel -> confirmation -> continued growth in percentage. Target on the chart
Do not overestimate risks, do not trade with x10-100, be smarter and always take profits, and also move your stop loss.

$BCH/BNB using pitchfork will this work ?i am just trying new things.. like this Pitchfork...
i just use google and look at pitchfork pattern and trying it here...
not sure if this will thing will work... just an idea for ya
and please leave a comment if this is possible, to those who are expert here... Thanks!
Trade at your own risk!

Ascending Triangle patterns seen in 1hr TF of BCHAscending Triangle patterns seen in 1hr TF of BCH
i put two scenario...
it might move the price up and touch the target price...
only if it will move with my chart...
DCA...
Trade at your own risk

Ascending Triangle pattern seen in $BCH in 1hr Time FrameAscending Triangle pattern seen in $BCH in 1hr Time Frame
This pattern could move $BCH up to $444 to $456 to $466...
my last chart on $BCH which was the Cup & Handle already breakout!
looks like this pattern already breakout too on $RSR if you will look at my chart on it...
it seem $BCH is imitating the move of $RSR
TYOR..
becareful!

BBCHUSDTNever really look at BCH, but price did come into the lows of the Weekly Control Candle and is finding support. A close above 450 and I am a buyer, to target the highs.

BCH - Breakout, Retest, MoonIts happening whether you like or not. Everything is pointing to the moon. If I am missing something - comment below and call out my bs

Bitcoin Cash Poses To Be A Good Investment Right NowWarning: our thoughts are ours alone; not financial advice.
Not everyone believes in bitcoin cash or what it stands for. But like bitcoin, we also think it's a great speculative asset.
In our opinion, there's still opportunity to bag BCH as much as possible right now. Target, $600 and beyond.
Trade with caution.

BCHUSDT, strong short to 363.94.Hi friends. Really never write about BCH. But today when i seen this picture. I was surprised. So big volume of BCH was sold at 425. And trend easy can going to first bears target (X-Lines level) - 363.94. No obstacle for that at this moment. Follow me.

Bitcoin Cash (BCH) - January 30Hello?
Dear traders, nice to meet you.
"Like" is a huge force for me.
By "following" you can always get new information quickly.
Thank you for always supporting me.
-------------------------------------------------- -----
You should watch for any movement that deviates from 367.31848226-435.40010001.
If you fall at 367.31848226, you need a Stop Loss to preserve profit or loss.
However, you need to trade carefully as you can touch and climb 324.1 points.
If it rises above the 435.40010001 point, it is expected to rise above the 501.0 point.
-------------------------------------------------- -------------------------------------------
** All indicators are lagging indicators.
So, it's important to be aware that the indicator moves accordingly with the movement of price and volume.
Just for convenience, we are talking upside down for interpretation of the indicators.
** The wRSI_SR indicator is an indicator created by adding settings and options from the existing Stochastic RSI indicator.
Hence, the interpretation is the same as the traditional Stochastic RSI indicator. (K, D line -> R, S line)
** The OBV indicator was re-created by applying a formula from the DepthHouse Trading indicator, an indicator that oh92 disclosed. (Thank you for this.)
** Check support, resistance, and abbreviation points.
** Support or resistance is based on the closing price of the 1D chart.
** All explanations are for reference only and do not guarantee profit or loss on investment.
Explanation of abbreviations displayed on the chart
R: A point or section of resistance that requires a response to preserve profits
S-L: Stop Loss point or section
S: A point or segment that can be bought for profit generation as a support point or segment
(Short-term Stop Loss can be said to be a point where profits or losses can be preserved or additionally entered through installment transactions. It is a short-term investment perspective.
GAP refers to the difference in prices that occurred when the stock market, CME, and BAKKT exchanges were closed because they do not trade 24 hours a day.
G1: Closed price
G2: Market price at the time of opening
(Example) Gap (G1-G2)


BCHUSDT (BITCOIN CASH) - POTENTIAL BREAKOUT ANALYSIS 🔎
- BCHUSDT is printing a falling wedge pattern.
- This is reversal pattern.
- A bullish pattern to be precise.
- Price is testing the falling wedge's resistance.
- There's an upward breakout potential.
BUY ENTRY ⬆️
- Breakout above the falling wedge's resistance and the horizontal resistance level (R1).
TARGETS 🎯
- Horizontal resistance level (R2).
SETUP INVALIDATION ❌
- Breakdown below the swing low support level (S1).

Bitcoin Cash at Support, Potential move towards $650 $BCH Bitcoin Cash at Support, Potential move towards $650. Perfect buy zone hit. Look to trade this for a 70% gain. COINBASE:BCHUSD

BCH now is on a VERY key spot.MACD shows a divergence and if BCH could break 393.5$ that would be LONG signal to spot that i showed. but if BCH stay below 393$ it could be SHORT signal.
Be careful with 390 - 393$ at BCH.
