BTC/USDT Analysis. Local Scenario Has Changed
Hello everyone! This is CryptoRobotics trader-analyst with your daily market update.
Yesterday, Bitcoin failed to confirm the bullish scenario above $105,000 and instead entered a natural correction. The volume zone at $104,000–$103,000 mentioned yesterday still hasn't shown any clear positioning.
Currently, the local scenario has shifted. On the 1-hour timeframe, we’ve seen a break in the trend structure. The cumulative delta indicates weakness on the buyers’ side, and just above the current price, there is a zone of absorbed market buys.
Main scenario: a decline toward the nearest support at ~$100,000 (absorbing volume), from where we can consider rejoining the global bullish trend.
Sell Zones:
$105,000–$105,700 (absorption of market buys),
$107,000–$109,000 (volume anomalies).
Buy Zones:
~$100,000 (absorbing volume),
$98,000–$97,200 (local support),
$93,000 level,
$91,500–$90,000 (strong buying imbalance),
$88,100–$87,000 (absorption of market sells),
$85,500–$84,000 (accumulated volume),
$82,700–$81,400 (volume zone),
$74,800 level,
$69,000–$60,600 (accumulated volume).
What do you think — which scenario will play out?
Share your thoughts in the comments — it’s always interesting to compare perspectives!
This publication is not financial advice.
Bitcoincorrection

BTC 2 Day Blood DiamondThe BTC 2 Day just printed a Blood Diamond on Cryptovac A. The last time we saw this happen was back here, and it ended in a 51% correction. Beware the possibility of a sharp correction here, make sure you don't leave yourself exposed or over-leveraged

An extreme but considerable scenario for #bitcoinHere' s #btc ' s falling channel pattern. This pattern also include' s Elliott' s ABC correction wave since 69K and seems not finished yet. I pointed two target prices. According to this channel main target is the lowest one, yes, horrorful. And I expect this will happen before Q2 2024. 17K price is also a strong support that we must reconsider.
This scenario will be invalid if #bitcoin price breaks up the channel and closes monthly before reaching main target.
A simple but probable correction scenario for #btc I' ve post but meantime there will be plenty of opportunies. And please don' t forget to DYOR. Train yourself and think with your knowledge not mine or another.
NOT FINANCIAL ADVICE.

💥Bitcoin last dive to $20,000#Bitcoin (Update)
Here is a daily timeframe analysis with price in a rising wedge. As shown here, price is at the tip of the wedge. A breakout which can be an upward or downward breakout is needed.
I expect Bitcoin to break downward for the last dive to $20,000 before the move upward to $37,000.
Aside this post, Bitcoin is overall bullish.
Not a financial advice🙅🏼♂️
Share your opinion in the comment section✍️
Please support this idea with a LIKE👍 if you find it useful🥳
Happy Trading💰🥳🤗

All BTC supports for the incoming correction on 4H Timeframe.All BTC supports for the incoming correction on 4H Timeframe.
Simple is beautiful:
- Green: still bullish outlook
- Yellow: limit
- Red: bearish outlook
All based in data from the last 15 days.
Enjoy.

All BTC supports for the incoming correction - Daily TimeframeAll BTC supports for the incoming correction on Daily Timeframe.
Simple is beautiful:
- Green: still bullish outlook
- Yellow: limit
- Red: bearish outlook
All based in data from the last 15 days.
Enjoy.

Bitcoin After $30k TestBitcoin likely testing $30k support area of volume remains low and bears stay in charge.
Bouncing off and reversing (pink arrow) has lower likelihood than continuation to $24k... followed by support @ $18k.
Macroenvironment still presents risk-off in face of rising bond yields, tightening supply via asset reduction shortly after beginning rate hikes.
$18k is not the bottom in a complete market meltdown.

BTCUSD - Best Entry I could See In This WaveHello there,
I am glad to see that you're reading this, considering that BTC's rising for awhile, It s hard to catch a good entry price on a market transaction, best buying opportunity could stay in limit orders.
Indicators seems a little bit tensioned but that could also mean a big buying interest and there are a lot of reasons, technical and fundamental also shows big interest.
Biggest correction you could see is near 30%-40% but it depends on the Higher Highs that can hit on the short term.
Take care of your investments, this is not a trading advice.
St Gex.

BITCOIN, going also for a healthy correction?Bitcoin, currently on a rising wedge. Elliott wave on the 5th wave. Will it drop from the rising wedge going for an ABC to the downside?

💥Bitcoin cunning move to $50,000Please support this idea with a LIKE👍 if you find it useful🥳
We all fail to see the bigger picture of where price will eventually break out to, if a breakout from the triangle occur.
Price is in a triangle, making effort to breakout but the upper trendine is serving as strong resistance which is pulling price down.
We also have a trendline serving as support which price is currently approaching. If price reverse at the lower (support) trendline, Bitcoin price will to $40,000 but a downward breakout takes us to $29,000 before heading to $50,000.
What do you think?
Share your opinion in the comment section✍️
Happy Trading💰🥳🤗


The Final Count-Down; Bitcoin Bears Prepare for More Blood.The wave count unfortunately has been incredibly choppy on small timeframes however, the trend remains in a convincing downward motion (for the time being). Previously, my assumption was that Wave 3C was still in play but that particular idea has been debunked, thanks to fibonacci/elliott wave invalidation.
The clearest and simplest wave count shows that we're very likely in Wave C of a Running Flat formation for Wave 4 . The impulsive C Wave within a flat is the true definition of a trap. The aggressive move which goes against the bigger trend can easily convince traders that the bottom is in. Wave B of the flat also resembles what most would call a double-bottom as well.
A pending Wave 5 should come in and continue the trend down, should the wave count be true . The current low which resembled a double bottom should be broken as a lower low comes to fruition. With Wave 3 being the extended wave within the cycle , it can be assumed that Wave 5 will equal the length/strength of Wave 1 .
Anticipating that Wave C of the Running Flat ends near $38.6, subtracting $17K from this amount puts us in the range of $21K. This price point is also near the lowermost part of multiple defined trend levels. The trend is your friend, at least until it comes to an end. Elliott Wave also cannot give a 100% accurate target either but there's plenty of reason to believe that the current bear cycle will come to an end somewhere between $19K and $21K. *A more accurate zone can be defined as the price pattern descends lower towards its true bottom. If anyone is in discussion about price dropping to $15K or lower, they're simply wrong.
This move was pretty predictable, even back in April :)
Based on the 2W chart, we're at least 2 weeks from the next big impulsive wave up (currently I'm a bit doubtful that we see $100K as most anticipate). We can talk about that later though!

Idea of the BITCOIN Bull Market Channel BTC trendline revised.
Taking the day when the new ATH was reached in December as a starting point.
If we are to go to test this support line at the moment, it would take us to roughly 50500 USD which also coincides with the 90 MA (moving average).
And it would be only 23% pull back.
So far, we had 4 main pull backs:
- 30% - Jan. 7 - Jan. 27
- 27% - Feb. 20 - Feb. 27
- 18% - Mar. 12 - Mar. 24
- ? % - Apr. 13 - ?
In the 2017 Bull Market, Bitcoin experienced 5 major pullbacks.
These pullbacks ranged between -29% to -40%.
So far in this bull market, we only had 1 30% retracement.

Designing Fibonacci I get these levels for daily BITCOINTechnical analysis regarding the price of BITCOIN in relation of dollar Tether for the next scenarios, based on daily movement.
Can we notice the presence of a corrective wave, right after impulse 4!? What is your vision?
I believe that the price is effecting its price correction and, well, it will be able to stop in this considerable support region as well as seek a lower level. Anyway, projecting this wave with Fibonacci (using to demarcate channels and price extension), I obtain such levels of region where the price will be able to fetch and, which perfectly match.
I believe that BITCOIN is making its correction and in the next scenarios, it may seek 62K. What's your vision!?
disclaimer
*** In accordance with CVM Instruction No. 598, of May 3, 2018, Art. 21, I declare that the recommendations of this analysis reflect solely and exclusively my personal opinions and perceptions and that they were prepared independently and autonomously. Not being considered a purchase and/or sale recommendation. ***
Any questions do not hesitate to contact me. I'm happy to be able to help you in the best way I can. 🙏

Is the run in Bitcoin over? After an impressive run up over the last few months, BTC has made an impulsive move down, which looks to be a clear End of Trend signal IMO
The Perma-Bulls will probably try to buy this up and try to test the highs, but it feels like we've got a fair bit more downside to go to me.
I'm thinking a pullback to the 0.38 Fib retracement and round number 40,000 level or lower wouldn't be out of the question.
Will be interesting to see what happens next.
Cheers and trade safe
Dale
DISCLAIMER: Just ideas, no crystal ball, NO ADVICE. The information presented here is general in nature and is for education purposes only. Nothing should be considered to be advice. You should consult with an appropriate professional for specific advice tailored to your situation.

BTC Set to Drop to $18k?I've included a link to a chart by another trader on this platform.
EDIT: I cannot paste the link due to reputation not old enough. I'm new here. But, please search
Crypto Patel: BTCUSD Again Update about Bearish Diversion( Regarding Drop $18k
At first I thought he might have a substance abuse problem, but the more I look at the broader picture, the more I believe he may be right.
Here are "fundamentals" to consider:
1. Google PERFECTLY Predicts Dumps - Use Google Trends to see that "buy bitcoin" interest has reached 100. When that value hits 100, we dump. It hit 100 last month, then we dumped 24 hours later. However, the value that was 100 last month, is now 75 which shows there is an even greater increase in Google Searches for the term.
2. The Fear /Greed Index has been at an average of 92 all week. When the BTC fear greed index is at 92 for this many daily candles, we dump.
3. The "News" has been agressively selling BTC; magazines, television, radio programming. When the "news" sell BTC, we dump. NEVER FORGET when CNBC aired programming where they gave us a click by click tutorial on how to buy XRP when it was $3.25.
4. BTC has NOT touched the 21 Weekly EMA this entire cycle so far, and it did so 6 times the last cycle.
After looking at the charts, I can now see a sub $20k BTC in the picture.
ESPECIALLY since Kraken e-mailed users the other day informing them that BTC will never be lower than $30k again.

BTC - 4h. The local critical point is $33,400.Yesterday will be remembered this week as the day of the consolidation breakthrough. The sellers broke the $32000-33000 range and tested the $28,800 mark .
In our previous idea, we expected a local continuation of movement in the triangle, but globally, we expected a price drop.
The price of BTC began to slow down strongly in the range of $30700-31300 . The 4-hour candle with the largest volumes looks very small, which indicates the large limit orders of buyers who restrained the price. False breakdown of this range gives buyers a chance for rehabilitation.
On the chart we have published two potential trades that we see at the moment. So far, there is too little information to determine whether the BTC price has completed its correction or not.
If buyers can't control the $33,400 mark, the decline will continue for the next week. Target $26,200.
The main problem with this scenario is $30700-31300. However, closing part of the position in this range will significantly reduce the risks. This manipulation will allow us to calmly expect the price of BTC to continue to fall.
If the price is fixed above the $33,400 mark, we see a good opportunity to trade with the $36,460 target. Whether there will be a prospect of breaking the trend line and the beginning of a new growth channel - we will see the circumstances.
P.S. we experiment with writing ideas. Today's format is new for us. If you like this format - write about it in the comments and like it. Have a good trading day.
P.S.2. Yesterday we saw the statistics of our top 11 ideas for 4 months. If you haven't viewed it yet - link below:

BTC on the Rescue - not really good but an opportunitySure enough, the bill comes due after an orgy of buying. Even I threw a bit of cash up there. Triangle in play now that that trend-line has been violated. Everyone remember 2017-2018. Be mindful from now on, cause it can go lower, and DCA works, but be very careful about what you buy and when you buy it. DCA proportionate to the dip if you're going to start spending money. This stopped being a fast race yesterday. I imagine that anyone that just entered the market has probably considered dumping their holdings, especially if they bought 24K, which in hindsight might very well be the new 19K if everyone panic dumps. Take heart, we've come so far since 2017.
More cautious investors should be watching BTC like a hawk over the next few weeks (I know I will), as it can correct to investable levels once more. That being said no one has a crystal ball and crazy stuff happens with BTC and it can happen at any time of day, for three hundred and sixty five days a year.

CLEANING UP MY ACTDear patrons,
I took an L on my call for the double top on my last play. Hopefully everyone had stops placed and didnt get wrecked too hard (like my GF!!). Get ready for tonight, we are getting the last part of our 15% correction that has been due since october. I hope you profited off this breakout, I outlined our target buy zone, be patient and wait for conformations on this trade. We are in a bull market still, but every time we move up a couple K we need some consolidation to reposition ourselves for an even bigger move.
WHAT TO LOOK OUT FOR TO CONFIRM YOUR BUY IN THE GREEN TARGET
1. Simple chart patterns, double bottoms in that range, ETC.
2. Look for overselling on the 4 hour RSI
3. Look for long wicks on candles that will help you confirm its a good entry.
4. Look at your bollinder bands, your 8s and 9s etc.
5. Look at the divergence, and if it has corrected.
Get ready for a solid bounce and our next target is going to be the 30K mark!!
Very excited for this to play out, we might actually be looking at some fat profits in the next 2 weeks or so.
Every man can rise after they fall, but a leaf will get stepped on.

Bitcoin Welcome to VolA very decent step down, this is not just bitcoin, futures are ugly. Save some cash, this is the first day of serious selling, there may be more on the way. We have brexit and Covid-19 mutation to deal with. For anyone that has bought BTC in the last few days, welcome to the club. This is part of the deal.

BTC will make a -30% correction ritual👀Historically, $BTC always made around -30% correction, even in a bull market
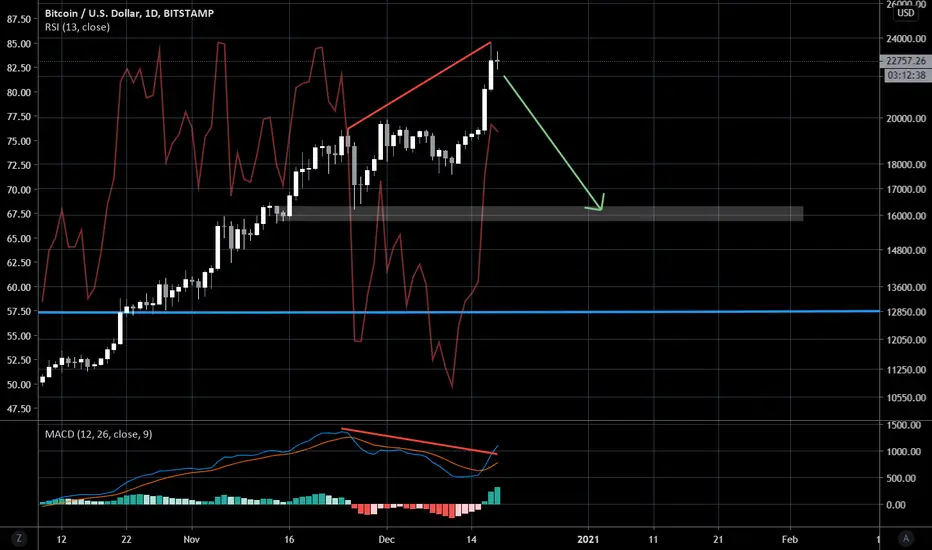
It's time to sell Bitcoin; Revealed!!!Hello, in this analysis I want to show you how to sell and how to bougth Bitcoin in key zones usign indicator keys to study it.
Ok, this strategy it's called bought cheap and sell expensive usign the price action + RSI. So, in this scenario we have that Bitcoin it's far away from $10,000 USD to $19,000 USD. Now, the crypto-markets need a correction before to continue up. So, we are in weekly timeframe and I use the RSI and also I quit some configuration and I did a personalized my configuration to understand it to invest in long term in Bitcoin. So, I add this green and red line. all lines are horizontal in the RSI.. The green line it's a zone to bought and the red line it's a zone to bought. And also, I share you this with arrows. Now, this broken line it's any key to bought, but yes it's so consider it as support. Now, the strategy it's simple to invest in Bitcoin in long term. So, I add this red line touching the past RSI point in the past bull rally 2017
Looking this screenshoot, we have that when the RSI touch the red line, this it's a sell iniminent that how occur in the past and then, the RSI it's nos leading down to find down the green line, that's mean a bought. It's simple, using the price action, using any indicator like RSI. Now, in case when Bitcoin starting a bearish trend like 2018, so we have this sitution.
As Bitcoin broke down the green line, so that obviously the trend could be bearish and then, using some configuration as I share you, we could to have any alert of then.
Now, actualy we are in the selling zone. So, my reccomendation for you it's that we can to see some days of correction and then, we would need to still pending in two levels to bought. My 2 possible levels that Bitcoin could to down are the $16, 500 USD and $13,800 USD. So, in these zones are possible boughts!!!
So, I will going to update this par when Bitcoin touch these possibles correction wheter are $16,500 USD or $13,800 USD.
***My purpose it's to share and have any plan

HODL! but not to your crypto...It is just an addition to my previous BTCUSD idea which was more based on RSI indicator. Here we have not 1, not 2 but 4 different resistances: the first and the most obvious one comes from the previous ATH, the second and the third one comes from the upper levels of the upward channels 1 & 2. The forth resistance presents itself in the RSI - currently we are stuck at 84 value. But wait, there's more: Greed and Fear index is 95 which is crazy even for Bitcoin (this index has never seen bigger numbers). And hey, we still have to see at least 25% correction and touch 20 weeks MA.
