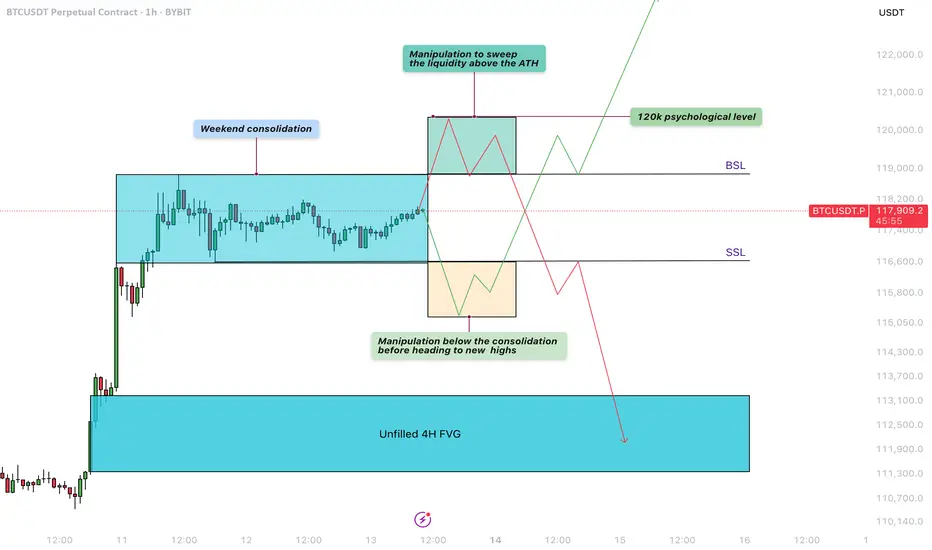
Bitcoin - Liquidity sweep before the next move!Weekend Consolidation
During weekends, Bitcoin often moves sideways as institutional players step back and retail traders prepare for the next move. During this consolidation phase between $117.000 and $119.000, liquidity builds up on both sides—sell-side liquidity below the range and buy-side liquidity above it. After these weekend consolidations, Bitcoin typically sweeps one side of liquidity before continuing in the opposite direction.
Manipulation Above the Buy-Side Liquidity
A significant amount of liquidity has formed just above the all-time high, right below the $120,000 level. Retail traders are positioning for a potential downward move, making this area a prime target for a liquidity sweep. This aligns perfectly with the psychological barrier of $120,000, a level where many traders are likely to take profits.
Manipulation Below the Sell-Side Liquidity
Over the weekend, traders are entering both long and short positions while placing stop-loss orders just below recent lows. This behavior creates a buildup of liquidity underneath the range. Bitcoin could dip below these lows to stop out retail traders before reversing to higher levels.
4-Hour Unfilled Fair Value Gap (FVG)
If Bitcoin sweeps the all-time high and enters a distribution phase, there’s a strong chance it will retrace to fill the unfilled Fair Value Gap on the 4-hour chart at $113.000 - $111.000. This imbalance was created during a sharp move up, leaving behind unfilled orders. Such levels often get revisited as price action seeks to rebalance.
How to Execute This Trade
Wait for Bitcoin to sweep either the low or the high of the weekend range. Avoid entering the market immediately after the sweep. Instead, wait for confirmation that price is returning back inside the range, signaling a clean sweep. On lower timeframes, such as the 5-minute chart, you can look for entry models like an inverse Fair Value Gap to refine your entry.
Final Thoughts
At this point, it’s unclear which direction Bitcoin will take next. The best approach is to wait for a clear liquidity sweep and signs of a reversal before entering any trades. That said, there’s a possibility we may first move up to test and claim the $120,000 psychological level before revisiting and filling the lower 4-hour imbalance zones.
Thanks for your support. If you enjoyed this analysis, make sure to follow me so you don't miss the next one. And if you found it helpful, feel free to drop a like and leave a comment, I’d love to hear your thoughts!
Bitcoincryptocurrency
80k BTC On The Move - WHAT It Means 80,000 BTC Wallet Movement (2011 Miner)
• Source: 8 wallets containing 10,000 BTC each — mined in 2011, dormant for 14 years
• Total Value: Over $8.6 billion USD
• Timing: Moved on July 4, 2025 — largest dormant BTC transfer in history
• New Addresses: Funds moved to modern SegWit wallets
• Probable Owner: Likely a single early miner with 200k+ BTC history
Possible Reasons for the Move
• Key Rotation: Upgrading to modern wallets for better security
• Recovered Access: Private keys may have been recently recovered
• Market Strategy: Positioning for profit-taking or major sell-off
• Yield Farming: Preparing COINBASE:BTCUSD for use in DeFi/lending platforms
• Collateral Use: Possibly for loans, stablecoin leverage, or RWAs
• Estate Planning: Legal restructuring or generational wealth setup
• OTC Transfer: Could be prepping for off-exchange institutional sale
• Psychological Warfare: Could be intended to spook or manipulate the market
• Regulatory Response: Aligning with new compliance or tax jurisdiction
Market Reaction
• COINBASE:BTCUSD Price Dip: Price briefly fell below $108,000 post-move
• ETF Context: Movement occurred despite record ETF inflows
Key Note: These wallets had not been touched since COINBASE:BTCUSD was worth ~$0.78. Their reactivation adds uncertainty and opportunity in a fragile macro environment.
• What to do????: Watch the orderbook to find these large bitcoin moves in case of exchange selling
Near term support & resistance
$106000 support
$109500 first resistance
👍 If this breakdown helped your trading, smash that Like and drop a comment below—let me know what you think will happen with the 80k COINBASE:BTCUSD . 👍
Best Reguards
MartyBoots, 17-year market trader

Bitcoin Breaks Trendline-Is $109k Next?Technical Analysis: Ascending Channel Pattern
The asset is exhibiting an ascending channel pattern, indicative of sustained bullish momentum. Key observations include:
- Channel Boundaries: The price has consistently respected the channel's upper and lower boundaries, forming higher highs and higher lows.
- Breakout and Retest: Following a strong momentum breakout, the price is potentially retesting a key support level, previously acting as resistance.
- Support Zone: If buyers confirm support at this level, it may signal a continuation of the uptrend, targeting the upper boundary of the channel at $109,000.
Key Monitoring Points:
- Bullish Confirmation Signals: Look for bullish engulfing candles, strong wicks rejecting the support zone, or increased buying volume to confirm long positions.
- Risk Management: Failure to hold support could signal a bearish shift, emphasizing the importance of monitoring price action and adjusting strategies accordingly.

BITCOIN IN COMING DAYS !!!Now bitcoin price is in the ascending Triangle with means the bitcoin price can react to this situation and breaks the triangle and will go up. and the most important resistance for Btc is currently 61k if the price breaks this resistance, Bitcoin can reach the top of the megaphone.
and also , the price can follow the butterfly pattern and go up. Maybe...
✨Traders, if you liked this idea or have your opinion on it, write in the comments, We will be glad.
_ _ _ _ __ _ _ _ _ _ _ _ _ _ _ _ _ _ _ _ _ _ _ _ _ _ _ _ _ _ _ _
✅Thank you, and for more ideas, hit ❤️Like❤️ and 🌟Follow🌟!
⚠️Things can change...
The markets are always changing and even with all these signals, the market changes tend to be strong and fast!!

BTC's situation+next targets and expected movements.It seems that the price has good support after the wedge break on 78% Fibonacci and after this price can grow up to resistance zone also BITCOIN has completed his corrective waves (ABC) , now it is time to start the five bullish waves !!
✨Traders, if you liked this idea or have your opinion on it, write in the comments, We will be glad.
_ _ _ _ __ _ _ _ _ _ _ _ _ _ _ _ _ _ _ _ _ _ _ _ _ _ _ _ _ _ _ _
✅Thank you, and for more ideas, hit ❤️Like❤️ and 🌟Follow🌟!
⚠️Things can change...
The markets are always changing and even with all these signals, the market changes tend to be strong and fast!!

#NEAR Weekly timeframe movement scenarioAt time W1, after exiting the tram and breaking the bearish structure with a powerful spike candle, this corrective form can be a pullback to the broken structure. Therefore, after breaking the 3.13 range, it will first move towards $5, and then in the daily time, the first red box supply area and in the W1 time, the second red box area will be the next supply area.

#ARB Pullback to structure and 61.8 FiboIn time h4, after correction in a descending channel, it is now out of the channel, which can be prepared to continue the upward path after the pullback to 618 Fibo, which is currently a resistance level, confirming the failure of the descending structure. Therefore, at the specified level, it is possible to continue the upward trend with confirmation.
Please support this idea with a LIKE and COMMENT if you find it useful and Click "Follow" on our profile if you'd like these trade ideas delivered straight to your email in the future.
Thanks for your continued support.
Sincerely.

#DYDX The possibility of retesting the resistance rangeH1 :
after the correction of the previous wave, which corrected 23% of the previous wave and exited the output channel.
it can now have a short-term upward rally after the pullback to the broken structure to the resistance range of entering the sell position of the previous post. If confirmed in the green box, you can enter the purchase transaction. In addition, the first target is the 61.8 Fibo range. In case of failure, it has the ability to grow to the next range.
Please support this idea with a LIKE and COMMENT if you find it useful and Click "Follow" on our profile if you'd like these trade ideas delivered straight to your email in the future.
Thanks for your continued support.
Sincerely.

#Doge #UpdateFortunately, we reversed the position in time in the previous post. In the 5-minute time frame, there are correction waves of wave 1 or A, which will have an upward correction after the completion of wave B or 2. that you can enter the continuation of the sell position in pullback. But in the higher time h2, as you can see in the chart, wave 4 of the upward correction has been completed and in wave 5 the correction is the continuation of the structure.
Please support this idea with a LIKE and COMMENT if you find it useful and Click "Follow" on our profile if you'd like these trade ideas delivered straight to your email in the future.
Thanks for your continued support.
Sincerely.


Long BTCUSDT Investing and trading is a game of probability where the market moves up, down or sideways. Hence, the probability of a trader winning is around 33.33%.
A lot of traders try to be right after I warned about the manipulation and some refused to listen and give into whales manipulation.
Some traders tried to aim for 15k to buy the dip, but it never happened, the only way you can get rich is to buy at 20k and HODL.
Warning, DO NOT short the market and get short squeezed. Buy the DIP.
I see a lot of retail traders lost money shorting bitcoin at 20k instead of buying it, this is your last buying opportunity before we move up to 35k to fill the CME gap.
The whales had been doing manipulation on bitcoin and ethereum.
It had already made a 5 waves up and will do a correction before pushing further up to 35k to fill the cme gap.
DO NOT MISS THIS last chance to buy the dip opportunity.
The whales are tempting you to short bitcoin so that they can push the prices up by doing this sideways movements.
Do not be deceived by the whales manipulation.
This manipulation by whales are food for them as retails traders getting liquidated easily.
The whales are accumulating. It is trapping breakout traders to short here, this will bottom here.
Long btc . Sick of this sideway obvious manipulation by whales.
On a higher time frame, it made a impulse and ABC correction, soon it will moon and everyone will get rich like WOW?!
This is not a signal and do not follow but a trade idea. Use your brain to trade and don't follow blindly!
Disclaimer - This analysis alone DOES NOT warrant a buy or sell trade immediately. Before you enter any trade in the financial market, it is very important that you have a proper trading plan and risk management approach

Long BTCUSDTThe whales are tempting you to short bitcoin so that they can push the prices up by doing this sideways movements.
The shorts of liquidation map is piling up, guys you all should go long because they will rekt the shorters.
It shows a strong bullish sign on daily candle on btc , it formed a support on daily and it will reverse from here and clean candle up to 31700. it is trapping elliott wave traders to short here, this will bottom here.
Long btc . Sick of this sideway obvious manipulation by whales.
A lot of people had lost money buying LUNC and investing in scam coins and wanted to recover their losses,
Whales had been defending this 29k-30k level multiple times. Everytime, it hits this level, it will bounce back.
Everytime, it drops below 29k , it will rebounce back, this shows a sign of strength where whales are accumulating.
This might be your last chance to buy bitcoin at the dip before going to 100k.
Bitcoin created a support with a green candle and it had formed a morning star daily candle closed with bullish candle with a clean candle to 31800 USD, this should push the price up to 31700 as clean candle. The whales will trap wave traders thinking it will go down but it will go up.
Do not short this but long instead, the manipulation is too easy to be spotted.
This is very bullish, long bitcoin and take profit at 100k. To the moon.
This should be the macro bottom. Simple whales with their obvious manipulation.
Hence, btc should moon from here and target 38k .
First target should be 33k .
This is not a signal and do not follow but a trade idea.
Disclaimer - This analysis alone DOES NOT warrant a buy or sell trade immediately. Before you enter any trade in the financial market, it is very important that you have a proper trading plan and risk management approach

Bitcoin Buying ZonesImportant Buying Zones for Bitcoin. BUYING ZONE 1 - $40300 - $41400 SUPPORT 1 - $39600 BUYING ZONE 2 - $29000 - $30350 SUPPORT 1 - $24350 BUYING ZONE 3 - $19200 - $20600

GARENTEED BITCOIN FORECAST! (Psychological management post)Do you find yourself checking charts first thing in the morning?
Do you sneak looks at charts when you should be doing something else?
Does your trading impact your mood / make you worry / impact your life like an abusive relationship?
Did you come here for 100% guaranteed price prediction?
I lied in my title. In this post, I will give a Bitcoin forecast BUT if any of the above apply to you, please read through the boring professional trader stuff first - it may save you money but most importantly YOUR HEALTH!
There is no certainty in markets. Given that we have gone through 3 'once in a lifetime' black-swan events in the last 20 years, the unwritten market rule is that the only certainty in markets is that you can not and will never be able to KNOW market direction. Tiktokers and YouTubers screaming for next x1000 altcoin won't tell you this, and yet it is a core foundation of trading. The sooner you grasp this, the sooner your unconscious bias and desire for control will vanish, allowing you to A) trade significantly better and not lose your life savings B) not have your life governed by the emotional impact of trading C) use trading to apply appropriate risk tolerance to other life choices and live a better, more fulfilling life.
I know it absolutely sucks, you just bought a couple of grands worth of crypto cause you thought it would be an easy buck. Now you're down a lot and some guy is ranting about trading being some kind of life therapy?! I'm basically the buddha mate, keep reading you degenerate.
Markets are a very strange alien environment for humans to operate in. While our entire psychological state seeks to address problems by drawing on past knowledge, lessons learnt and observations of others actions dealing with similar situations (after all this has worked for you your whole life), in the market this behaviour is the Achilles Heel of 99% of market participants. It's why you sit and wait day after day seeing an Alt increase in value 10/50/100% then when we finally feel the market has proven itself and you buy - BAM the Alt crashes. Alternatively, it's also why we FOMO in, listen to people shouting HODL, follow YouTubers shilling products and rationalise market movement through reading the news. All of these are drawn from emotional biases learnt over not just your lifetime, but that are hardwired into your very DNA. This is why trading carries significant risk as becoming a profitable trader is not just learning how to trade (that's only 10% of it), it is learning to harness and control the very fabric you are made of and go against EVERY natural instinct in a cold, rational, probabilistic manner.
There are a number of reasons why markets just don't work with our individual psychological state. Some examples are: the price of an asset is the price the herd agrees it MIGHT be worth in the future (name one thing you've ever done in life where you've had to guess what a bunch of unknown participants think will happen to something ONTOP of a million things potentially cropping up during the time between now and then), market makers shift price to areas that are intentionally designed to cause psychological distress to those who are unprepared for potential outcomes, etc etc.
We don't actually need to know any of this because ultimately - Price will go where price will go and, again (say it with me) there is NO CERTAINTY OTHER THAN UNCERTAINTY. And it is with that miserable understanding of the market that I introduce our ray of light, our one and only true unbias friend in the market. Probability.
Casinos are the primary example here. Gambling is also an environment where there is no certainty and so for casinos to become successful businesses, they can't lose more than the people gambling in the casino. Pretty simple. The way they do this is they understand that over an infinite magnitude of games, so long as they have a probability of winning that is over 51% they will make money. The Casino boss doesn't wake up in the middle of the night to check his balance sheet because he knows that the games he chooses to play are in favour of him winning and while he may go on losing streaks to the professional gambler, overall he will win.
The same is true for trading. Supports/resistances, candlestick patterns, technical analysis as a whole and trading strategies are to the trader what the 0 and 00 are to the casino on the roulette table - they shift that probability of winning above 50%. You might get a moonshot everyone once in a while, or you might get lucky accidentally investing at the start of a bull market, but the one thing I can guarantee to you is that if you do not understand the general probabilities behind your trades you will eventually lose all that money. If you are learning this for the first time I'm not going to sugar coat it - it will be a hard a transformative journey that most of you will drop out of - this is the second truth of trading. There is no profitability without probability.
This last one is particularly telling. Trading is EXTREMELY dangerous. Like a gambler, the trader can completely ruin their entire life or cause major psychological trauma by losing a significant % of their money. You are playing with fire constantly and so you MUST use probability to protect yourself, not just to earn money, but to be a healthy trader both financially and mentally.
So now we know we have a guardian angel standing over us, let's apply probability to try and plan for the potential future paths of Bitcoin. (Note: I am not saying predict - anyone that ever says that you should close that post ASAP. This is another super-easy way to filter out information that makes you doubt yourself and your trades, remember we can never predict - all we can do is understand the rough probabilities that things will happen and prepare accordingly.)
The number sections correlate to the numbered sections on the chart:
1: Here we know with hindsight that Bitcoin was trending bullish. In a market, there are only two states it can be in that define the overarching probabilities of price action - "Trending" and "Ranging" (there is a third - Choas - but we don't care about that).
A trend is where the price oscillates bullish or bearish. In a bullish trend, this means the price is more likely to break resistances than supports, and the reverse is true in a bearish trend. Understanding that the 'context' a market is in is a 'trend' means we can gauge that probability favours bullish or bearish trades more than the other and BAM YOU HAVE DONE IT YOU HAVE MASTERED THE 10% OF BEING A TRADER (the rest is applying that knowledge and lol good luck with that impossible task).
2: Here we can clearly see that Bitcoin entered into its second potential market state - a "range"
A range is nothing more than price oscillating between two ROUGH price areas. Within this the enthusiasm of buyers has been met by the supply of the sellers and so price bounces around chaotically, shifting probabilities of price going one way or the other much closer to 50/50 in a choppy, ugly chaotic mess. This is the 'context' where most of those who don't know trading and don't have control over their emotions begin to give away all their easy money won in the trend as they are consumed by shifting emotions that uncertainty provides.
Yet it is combining the two that gives us 'context' of the wider market. Bitcoin is not (I can say this) NOT in a bear market. Probability significantly favours large timeframe (weekly) bullish price action and price needs to drop significantly lower and spend a lot more time there for a bear market or bearish trend to emerge. This is where I introduce the 3rd universal truth of trading. "The trend is your friend". The weight of the bullish trend prior to Bitcoins range gives a statistical probability that price will extract itself to the bullside of the range. Obviously, you can't see that if you are looking at a 15 min/1 hour / 4 hour chart but its clear on the higher timeframes. This means that even within a dynamic where price has a 50/50 chance of bouncing around bullish or bearish, we can still gauge that the overarching probability still remains bullish.
3: With an understanding that the range is tainted bullish and so probability still favours larger time frame bullish movement, we can begin to look for entry points where price offers additional statistical advantages to us - i.e supports and candlestick patterns. Even though that is true, there is NEVER pressure to trade. If the only certainty is uncertainty then here comes our 4th universal trading truth - If you don't trade, you can't lose money. Your focus should ALWAYS be on capital preservation - this is one of the many technics that shifts your bias away from those natural emotional desires to FOMO in as you start seeing the true dynamics of market involvement and not the warpped biases of incorrect untrained psychological mindsets. This means that we do not need to get involved in a trade or add to our position if the probability is not in our favour, and so in a range where probability is 50/50 or slightly tainted bullish or bearish due to prior larger timeframe trends, we still don't NEED to get involved if we know we can increase that probability further in our favour at a later period in time.
So we wait for appropriate price areas that increase our probabilities and combine this with the 'context' that we have established in the above points. In this case, Bitcoin is sat at historic price support (the 41k area) and so this again adds to the probability we have established in the fact that Bitcoins range is tainted bullish to give us a higher chance that if we were to repeat this trade 100 times, more often than not you would make money. We can even add another layer here and wait for a signal that confirms what we think will happen at the support - price reacting off of it. We do this by looking for candlestick patterns. Candlesticks are nothing more than a visualisation of price action over the course of time, and price action is nothing more than a demonstration of the behaviour of market participants. A hammer candle - (I've drawn what one looks like at 3a.) demonstrates that price opened high, sellers pushed price lower but for whatever reason, over the course of the candle buyers came in and pushed the price back up to close the candle near the highs. If this happens in an area of support we can use this as a sort of 'confirmation' that our assumptions about the probability of a trade being in our favour are potentially correct. (NOTE: This is very simplified but the jest of it still applies). So here, as Bitcoin is in a supportive area, in a range that is tainted bullish, if we see a hammer candlestick we can say that "ok price MAY keep going down but I know more often than not price will go up".
And that's it. I know it might be a bit of a letdown or a bit deflating having read through all of this but it really is that simple.
We have assessed that the context of Bitcoin is a range = 50/50 chance of bullish and bearish price action.
We have also assessed that Bitcoin trended bullish prior to the range and so this slightly taints that probability towards Bitcoin extracting itself from the range to the upside.
We have assessed that Bitcoin is on a support area and if we see an appropriate candlestick pattern, that will add to this slight bullish taint in probability.
All of these combined means that Bitcoin will more likely than not reactivate bullish. That doesn't mean it will, and so you should be prepared for that eventuality - i.e by not being too leveraged, by having a stop-loss or even by having a plan - "Dude it's chill the 30k support is still in play, my invalidation/stop is below there and so we still know bitcoin is in a bullish tainted range so I'm not going to panic sell like the herd if 41k area breaks". But crucially going through these steps with each of your trades will start you on your journey to achieving success in trading and controlling the dumb monkey in your brain that wants instant gratification, easy money, to panic sell, to panic buy and that will eventually lose you money.
I have marked down 52k as an area of interest. This would be a higher high on the daily timeframe and so should Bitcoin bounce from these levels and IF 52k is reached, this adds more weight to our probability that Bitcoin will extract itself to the upside from the range. I do not look at lower timeframes most of the time as it's so much more chill looking at only the daily/weekly. Why bother trying to get a 2% swing over the course of the week when I can not check a chart for a week or and, over the course of a few years, catch a 700% swing like we have over the last 2 years.
Thanks for your time.
P.
NOTE: I would not be here without the incredible lessons I have learned from my past teachers. I can not offer the same level of market coverage or substantial knowledge as these guys. I learnt what I know from MarcPMarkets/Goldbug1 at 'Greenbridge Investing' & Phil through 'Pro_Indicators' so go check them out.
PLEASE DO NOT USE THIS POST AS A CALL FOR ACTION. IF YOU ARE INEXPERIENCED, READ THIS AND DECIDE TO OPEN A TRADE THAT IS EXACTLY THE BEHAVIOUR I AM ENCOURAGING YOU NOT TO DO. Go away, learn technical analysis and probability trading, learn a strategy and practise that. Invest in yourself as you aren't investing otherwise.

BITCOIN CYCLE- TO HIT $72,000 BY MAY'22Please support this idea with a LIKE👍 if you find it useful🥳
Not a financial advice🙅🏼♂️
From current support, I expect a rise to $45,500, then a fall to $34,000 before a great impulse move to $72,000. Here is why.
As seen on the chart, we can all spot the NOV/DEC 2020 take-off to the APRIL/MAY ATH at $64,700 and another ATH at $68,880 in November.
Price got rejected at this ATH and it’s falling back to the lower trend base.
Therefore, I expect a fall to $34,000 as the third support zone before an impulse move to $72,000 where another DIP can possibly take place.
What do you think?
Share your opinion in the comment section✍️
Follow me to receive more updates on BTCUSD ( BITCOIN ) 🤗
Happy Trading💰🥳🤗


nzdcadwe can see wolfe wave completed we are looking for long as we expect nzd strength and cad weakness , stay safe

ethbtc ethereum bitcoin daily
Ethereum may break the previous strong top after the current breakout of the symmetrical triangle very close to the previous resistance level..

audchfWe see that the rebound will be from here, we expect the strength of the Australian dollar and the weakness of the franc, stay safe

gbpusdWe see that the rebound will be from here, we expect the strength of the sterling and the weakness of the dollar, make tb and sl as it shown in chart stay safe

eurusdeurusd as we all see the red trendline is a very strong support , it pushes the price up 3 times lavishly we are looking for buy as the wolfe fifth wave formed+ the head and shoulders


