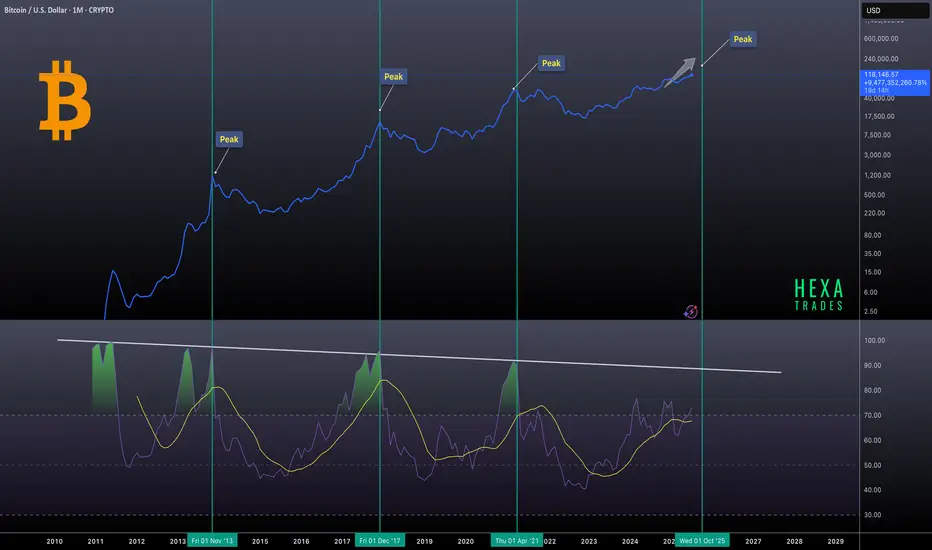
Bitcoin Macro Cycles: Sell Signal at RSI 90Bitcoin’s historical market cycles, using monthly RSI data to identify previous bull market peaks. Notable tops in 2013, 2017, and 2021 are highlighted, with the next potential peak projected around October 2025. A consistent pattern emerges where each market top aligns with the monthly RSI reaching or nearing the 90 level, indicating extremely overbought conditions.
Sell when the monthly RSI hits 90. This has consistently marked previous market tops and can serve as a reliable signal for long-term investors.
Bitcoincycle
Bitcoin Final Push: Cycle Top in Sight?Historically, the final two quarters of a Bitcoin cycle, especially in post-halving years, have shown strong bullish trends. This pattern played out in 2013, 2017, and 2021, where Q3 and Q4 delivered significant gains leading into cycle tops. With 2025 being the post-halving year and Q2 already showing strong performance, we may be setting up for a similar rally in Q3 and Q4 if history repeats.
CRYPTOCAP:BTC BITSTAMP:BTCUSD

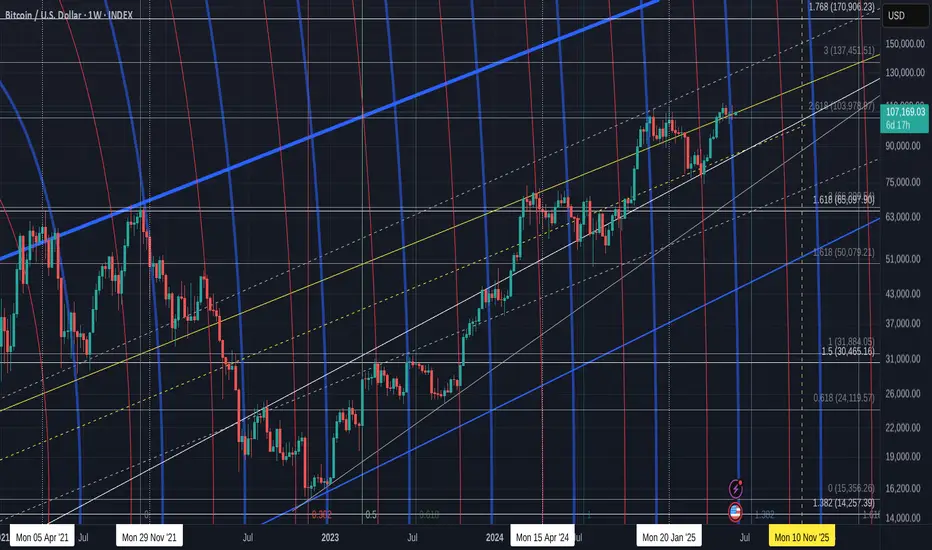
Bitcoin closed week RED but that is OK, it was closeFor the last 3 weeks, Bitcoin has been in a tight range and each candle has been small body and long wicks, showing indecision and uncertainty
This close up chart shows how these 3 weekly candles have occurred at the intersection of a Fib circle (blue) and This alone could explain these "wicky" candles... The Bulls have been fighting hard to keep PA up and to not let it slide down that fib circle, as is normal the majority of the time.
.
We shall find out this week because, now, there is not a lot to stop the Bulls trying harder.
The FED will let us know the decision on interest rates on 18th.
This will likely cause a reaction in markets and I think we are most likely to see Rates remain static.
PA is currently on Support and remains above the 2.618 Fib extension.
All is Good
The MVRV (Green) and Z Score (yellow) can be complicated to fully understand but what is important to understand here is how the Yellow Z Score is still above the Green MVRV. this remains Bullish. We should notice how Both are falling and we wait for them to cross back over that falling line of resistance.
Currently, This chart shows us that Bitcoin has a slightly undervalued price. The higher we go, the more Oversold, Undervalued/ the top is the opposite, overbought / over valued.
The MACD is showing us a s;light levelling off
For me, I think this is similar to what we saw in the end of 2024. The MACD may go back down to the Red signal line and bounce....Again, we have to wait and see. Remember, that just because MACD drops, BTC PA does not always follow. We can range across instead
Over all, I am still Bullish long term but we may see some continued uncertainty in this market. The FED decision later this week will have an impact for sure
Bitcoin remains strong though but should circumstances allow, we could revisit 90K on that trend line below current position. I am not to sure this will happen but a good idea t be ready if it does.
What is certain is how PA has never really been in such a "soft" controlled action.
The nearest we have is way back in 2016 to 2016.
At this time period, we also saw BTC PA rise in a slow steady rise, no sharp pushes higher till the final push to ATH.
Currently, we seem to have repeated a similar Acton though. now, for longer
So, we wait and we will find out..
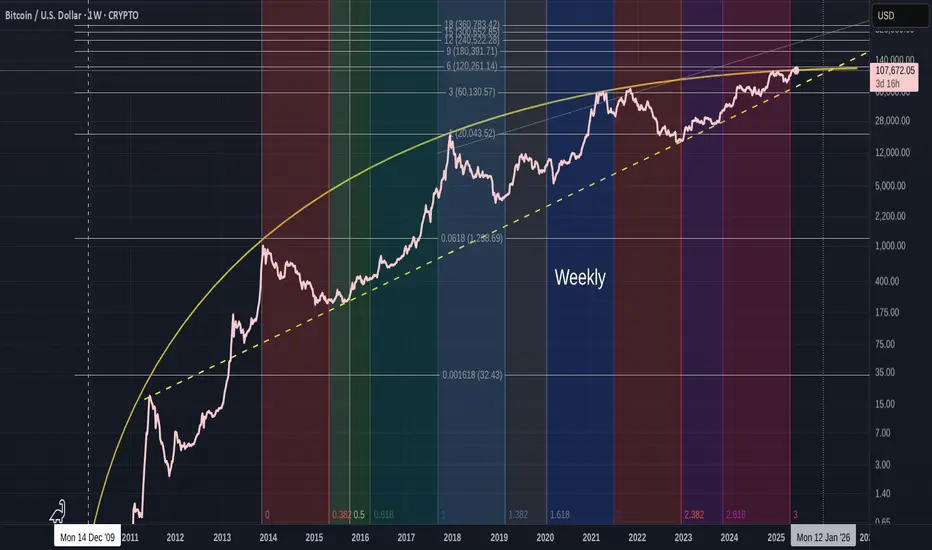
Bitcoin life cycle-stage One ending-Next cycle has to start NOW
There are 3 things to see in this chart
1) The Orange Arc of resistance. I have talked about this previously but to recap a little, it has its origins in Oct 2009 and has rejected EVERY ATH since then, as you can see on the chart. The Arc itself is part of a Fibonacci Spiral.
This Arc has begun to Squeeze PA against the lower trend line, that was formed in 2011.
And we are now in a position where PA MUST react or get pushed below the Long Term line of support.
This could be called Make or Break time for Bitcoin.
The Apex of this pennant is around Jan 2026
PA always reacts before the Apex.....99% of the time.
2) The Vertical Coloured bars are Trend Based Fibonacci Time, It begins on the 1st ATH in the channel that Bitcoin created. This channel is shown in the chart below
See how the Runs to the 2017 & 2021 ATH were all in a Bullish Green zone and how PA never retouched the lower trend line of support in this time
Since Mid 2021, we entered a Bearish Zone.
On the main chart, you will notice how this Fib Time has just ended.
3) The Trend based Fibonacci Extensions. Every single ATH rejected off a Fib extension.
The Root is at the 2009 Low and 1 is at the First ATH in the Bullish Fib time Zone.
The numbers here are all based off the 3,6,9 number sequence.
Lets look a little closer at the weekly chart
As we can see, PA got repeatably rejected off this orange Arc of Resistance and Current PA has been up there, trying to break through since 2024.
Many people have also commented on how PA has been so subdued this cycle and could this be reflected in the Fib Time showing us that we are in a Red Bearish Zone.
See how, from Mid 2021, when we entered a Strong Red zone, PA took a Deep dive off the Nov 2021 ATH.
Also note how this zone ended in late 2022 and in Jan 2023, PA began its current cycle Run. See the change in Colour ?
And Currently, while Bitcoin tries to break out of this squeeze, we were in a Red zone again....that just ended.
AND we can also see that we have not yet reached the 6 Fib Extension at 120,251 usd
The situation we face here is that if PA gets rejected off that Fib line, having just broken through the Arc, we could get pushed right back down under the Arc again. It is VERY STRONG RESISTANCE
This next move from Bitcoin HAS to be strong enough to take us up to the 9 fib line at 180,391 usd at a minimum. This way we can use the 6 Fib extension as support when PA cools off from a big push and so remain above the Arc and begin the Next long term cycle.
The Daily chart below shows us where we are right now
You can see how PA has repeatably tried to break above the Arc and been rejected Firmly Every time...so far, PA has avoided going right back down to the Lower trend line and has remained in near distance to this Arc..But we are running out of Time.
Recent attempts by PA have been Strong and I am sure that we will make it over but the real question is can we also get over that 6 Fib extension and stay above.
The weekly MACD certainly has enough strength to cope
Should we have a subdued Summer trading on Bitcoin, we will see this MACD cool off and be stronger before a sustained push near Autumn maybe.
To conclude, Bitcoin is under pressure to move out of its First Full Cycle.
It is getting Squeezed and now it is time for Bitcoin to prove it can cope with its new found "Adulthood"
The Next Big push, maybe later in the year, could very realistically reach 200K or more and this would place us Above that 9 Fibonacci extension I talked about earlier.
Of course, events could change and we could see PA collapse back below the Arc.
If this happens, all is NOT lost but it would certainly weaken the case for Long Term holders to continue doing so.
This then could create a Snownall effect and prices may tumble....And I will buy MORE....
Either way, we are in a HUGE moment for Bitcoin and I am privileged to be able see this all unfold...
Lets see what happens but, for me, I am Still VERY Bullish though Cautious....
We may have to revisit low 70K in the near future if Pa cannot get over this Arc and the 6 Fib extension
BITCOIN 5 lines and 3 indicators to watch now we in new ground
I will be presenting a number of charts here and each has a different story to tell right now.
The 5 lines are All valid trend lines.
The Vertical lines are January year markers
The white line at the bottom is th e long term support line from 2013
The Dotted line is a threshold line
The Blue Arc is a line that has rejected EVERY ATH since 2013
The orange line is a marker that, once crossed has Always led to a New cycle ATH
The upper dashed line is the line of rejection of all ATH since 2017
The Weekly Bitcoin PA chart
Here we can clearly see how that Blue Arc has rejected PA previously. We can see how PA has reached a point of intersection and once it crosses that blue Arc, there is a line of rejection just above.
This Blue line needs to be crossed and held as support.
The Daily version of this chart shows ua how we have just crossed that blue Arc.
It also shows us how FRAGILE this is right now. PA is currently testing that Blue line as support
This needs to Hold. If we manage to hold this line and bounce, Stiff resistance is found around 120K
The following charts are showing the following indicators
The 3 indicators used are
RSI - Relative Strength Index. used to measure the speed and change of price movements
TSI - True Strength Index, used to indicate trend direction and overbought/oversold conditions.
ADX - The Average Directional Index (ADX) is used to measure the strength of a trend, not its direction
The 4 hour chart - short term expectations for the weekend
Bitcoin PA the Yellow line at the Top, the indicators are in the order listed above,
First thing to see here is how BTC PA is retesting that Blue Arc - this really needs to hold
RSI (blue) - OVER BOUGHT, It has fallen below its own MA ( average) and could easily drop further today. Looking back along this, we can see how the 4 hour RSI likes to range along the Neutral line, so we may see it drop back to that level today, tomorrow
TSI is also OVER BOUGHT. We can see when TSI is up here, PA ranges while it cools off. But there is room for one little push here if required
ADX ( yellow ) is high showing trend could be getting near exhausted, The orange line is the DI+. This shows positive prince direction, the Red one is DI- and shows that negative price direction is climbing slightly.
In the short term, we need to see PA hold above the Blue line but the likelihood is to possibly back below. There is support below.
The WEEKLY shows us that PA has the ability to continue for a while longer but we are getting near a point where PA needs to recover
Here we can see how the RSI and TSI are both up high, on the edge of OVER BOUGHT but with the ability to rise further.
What is VERY important to take note of here is that ADX.
It is Low, this is indicating that the weekly Trend has lost strength now. It could continue lower.
Remember, ADX DOES NOT SHOW TREND DIRECTION, JUST STRENGTH
So, the thing to see here is that we are in an area where we could see a New Trend begin. This trend could be either Bullish or bearish
On a weekly chart, this change can take a long time to appear in PA
And for the Longer Term, The Monthly Chart gives us hope for a fuhrer push higher for the rest of the year but one little warning bell
WE See Both RSI and TSI up high again, where they have been since 2024. But neither of them are up in OVER BOUGHT as much as they have been in previous cucle Tops.... So we can assume room to move higher.
But what does ring a bell is that ADX again. It is once again, in a place of Change and on this chart, showing that the current trend can start becoming weaker. However, DI+ has plenty of room to move higher
So, in conclusion, we see that BITCOIN has the ability to continue higher but in the short term, we may see a pause and possinle Volatility
Trends are about to change, This could take Weeks and PA can continue higher while a trend weakens.
For me. we are in the last few months of this cycle and at a point of Decision.
PA MUST get over that Blue Arc that has rejected Every ATH since 2013.
If PA fails this, we go back to sub 90K but this is unlikely,
There are numerous projections that see BTC PA in price discovery reaching the 120K before serious resistance.
On this chart, if PA follows pattern and trends, we could see 378K by year end
Getting over that irange line is KEY
Stay safe everyone.

Bitcoin's 215-Day Pattern: Another Breakout Loading?The Bitcoin chart shows a repeating pattern of consolidation lasting 215 days before each major upward breakout. This cycle has occurred multiple times over the past two years, with each accumulation zone followed by a strong bullish rally.
Currently, Bitcoin is once again emerging from a similar 215-day consolidation phase, suggesting the potential for another significant move to the upside if the pattern holds. If history repeats, we could see a target around $150K.
BINANCE:BTCUSDT CRYPTOCAP:BTC

What if I show you Bitcoin is at end of 1st cycle only ?
The Chart above involves TWO things we may need to pay attention to.
There is so much involved in this and I could go on for hours because, for me, this opens the door to so many things for Bitcoin.
And I am now looking at this past 14 years as the "Beginnings".
And we need to wait and see Where we go next before we label that
So..
What do we have here.
The ARC of Resistance. - I have talked about this before. Simply put, PA on every ATH since 2011 has been rejected by the same line / Arc - This needs no more than the Arc on a chart to see...
It is as simple as that.
Beneath this, we have that Dashed line of Support that has Never been Broken. Created off a High in 2011, it got retested as support in 2015 and not again until 2023.
Between these two points, you will notice how that Arc of resistance was at its furthest points from the line of support below.
It is like the Beginning and End of a sequence.......
The next thing we have is a Very interesting thing called the Trend-Based FIB Time.
It is important to understand what this is, So ;-
Trend-Based Fib Time is a technical analysis tool that uses the Fibonacci sequence to predict probable price corrections within an existing trend. It is represented by vertical lines at specific time intervals that show potential areas where a swing high, low, or reversal could occur. These intervals are based on the Fibonacci sequence and are not concerned with price levels but rather with time. The tool helps traders identify how far a wave is likely to travel in the trend.
Note what is in Bold there.
And then look at the chart..It clearly shows us, where PA touched that line of support twice, the Cycle / Wave. The RED zones. And between these was the Trend. The over all Gain in price, over Time.
We have 3 Waves in total. The 3 ATH to ATH from 2017 to now
To further support this idea, see how PA did not come down to the Line of support between the 2017 - > 2021 ATH's
That was MID CYCLE - Strength
And so now, while we all wait for the next push up, I want to show you a zoomed, Daily version of this chart
The Current ATH we have was absolutely on the day of the END of this Fib Time cycle.
I promise you I did not "Adjust this to suit." That was the genuine result.
And I was Stunned.
And more than that, This image also very clearly shows us that Time and Room is running out for PA.
It faces the strongest lines of Support and resistance it has ever faced and these lines reach an apex in Dec.....
PA ALWAYS REACTS BEFORE THE APEX
So, What is Next ?
The chances of Bitcoin crashing to the Floor are highly unlikely unless all the corporations that have been buying BTC, decide to sell them all at the same time.
This IS a possibility ONLY if they are working with the TradFi banking organisations, that tried to Crash BTC in 2022 / 2023
OK OK, that involves ridiculous amounts of Losses for many ..so..NO
BUT PA IS GETTING SQUEEZED
And so we wait....and Wait till we see Bitcoin PA break out, Enter a Brand New Trend..a Long Term Cycle.....and we may call it Adulthood.....
Or, we will have a Story to tell our Grandchildren about a Dream of breaking Free of Banking that Came Oh so Close
I cannot wait to see what happens Next - and I am HODL

Bitcoin bull run ends in 6 months?The above chart presents a macro view of Bitcoin’s monthly price action, showcasing the historical pattern of bull and bear market cycles. Each green box highlights a bull run lasting approximately 35 months (or 1,066 days), a consistent duration seen in the previous two cycles from 2015–2018 and 2019–2022. The current cycle, which began in late 2022 or early 2023, is now entering its final phase, suggesting that if the pattern holds, the BTC bull run may have around 5–6 months remaining before a potential peak.
The price action continues to mirror previous cycles, indicating that history may once again be repeating itself. If this cyclical behavior continues, traders and investors should consider the possibility of a cycle top approaching and plan accordingly,.

New era: 'The Bitcoin Trust Flow Cycles'🏆 The Bitcoin Trust Flow Cycles™ by FXPROFESSOR
Friends, today I’m sharing what may be the most important Bitcoin framework of 2025.
Forget the broken halving expectations. Forget the chaos of macro headlines.
What if the real signal has been here all along?
What if Bitcoin’s true rhythm follows the capital rotation between itself and the U.S. Treasury market?
📊 Introducing: The Bitcoin Trust Flow Cycles™
This is not a model of where Bitcoin could go (like Stock-to-Flow)…
This is a model of when and why it moves — based on the trust rotation between U.S. Treasury Bonds (TLT) and Bitcoin.
What I’ve found is a repeating structure — not based on supply or halvings, but on macro trust dynamics .
🔁 The Two Core Phases:
• Correlated Periods 🟦 (Blue zones): BTC and TLT move together — both rising or falling
• Inverted Periods 🟩 (Green zones): BTC and TLT move in opposite directions
These aren't random — they're structural rotations that occur at key technical levels in the bond market.
🧠 The Cycle Timeline:
Jan 2019 – Feb 2020 → Correlated (pre-COVID calm)
Feb 2020 – Sep 2021 → Inverted (Fed QE, Bitcoin moon)
Sep 2021 – Nov 2022 → Correlated (everything dumps)
Nov 2022 – Oct 2023 → Inverted (TLT collapse, BTC recovers)
Nov 2023 – Aug 2024 → Correlated (sideways digestion)
Aug 2024 – Now (Apr 2025) → Inverted again — and compressing fast
We're now in Period 6 — an Inverted Period — but all signs point to an upcoming Reversion.
📉 What Happens at Each Flip?
These transitions tend to occur when:
• TLT hits major channel support or resistance
• Macro fear or liquidity shocks drive trust shifts
• Smart money starts reallocating across asset classes
Right now, TLT is at channel support — a zone that has previously triggered reversions into correlated periods.
📌 What Comes Next:
According to the Bitcoin Trust Flow Cycles™ :
→ We are statistically due for a reversion** back into correlation
→ If TLT bounces from 76–71 zone… BTC may follow — not fight
→ The target remains: BTC breaking above 115 resistance
This flip — from inverse to correlated — has historically marked breakout windows for Bitcoin.
🔮 This Is Bigger Than a Halving
Plan B’s Stock-to-Flow gave us valuable insight into long-term valuation.
But it doesn’t explain timing.
This model isn’t about supply mechanics.
It’s about macro trust mechanics .
When institutional confidence leaves Treasuries…
And enters Bitcoin…
That’s the rotation we track.
That’s what moves the chart now.
🎯 Watchlist: • TLT support: 76 → 71 zone = reversal signal
• BTC breakout trigger: 115 resistance
• Cycle shift: Reversion = Bitcoin joining TLT upside
If this plays out, it could mark the most important trust cycle breakout we’ve seen since the COVID inversion.
Bitcoin doesn’t need permission anymore.
It just needs a macro trigger. And this model helps us spot it.
One Love,
The FXPROFESSOR 💙
📌 Missed the full credit market breakdown? Check my recent posts on BKLN, HYG, LQD, and TLT to understand the full Trust Flow rotation.

Bitcoin accurate bottom and top zones
BINANCE:BTCUSDT
This is my market mood indicator. Accurate determine the bottoms and top of cycles.
Based on this analysis on BLX chart and Monthly timeframe we can find something interesting
- Marked Monthly green zones.
- We never seen white color disbeliefe zones.
- Previews 3 times when we saw BLUE color it was a bottom (I was impressed how accurate it play out!!!)
- Now it looks like 2018-2019 period (green box-blue-green)
- So now no euphoria on market. Need to see yellow, orange and top will be again at extreme red
- Hard to say about timing but most likely we will test trendLine at 35-36 (maybe with fake out to 41)
- Then we will see yellow and orange color on indicator and drop to covid trendLines again 21-19 and continue move forward till 2025 March to extreme RED zones and end of cycle.
Hope you enjoyed the content I created, You can support with your likes and comments this idea so more people can watch!
✅Disclaimer: Please be aware of the risks involved in trading. This idea was made for educational purposes only not for financial Investment Purposes.
---
• Look at my ideas about interesting altcoins in the related section down below ↓
• For more ideas please hit "Like" and "Follow"!

$BTC Cycle Elliot Wave AnalysisMore confluence on why this CRYPTOCAP:BTC cycle will perform similar to 2017 vs 2021.
If we look at Elliot Wave theory, we can see the first cycle (red) had a long 3rd wave and somewhat truncated 5th wave.
The second cycle (green) had a muted 3rd wave and extended 5th wave.
The third cycle performed similar to the first, which makes me believe the fourth cycle will perform similar to the second cycle.
It appears the ₿itcoin cycle flip-flops every other time.
*NOTE* I used Closing Candles for when drawing EW to cancel out noise.
**EW drawings are extremely subjective, hence why I don’t use often for analysis.

Down Down Baby - BTC Short Term RetracementI'm pretty confident that we will retrace back to mid 40's - Then go on a parabolic run.
This doesn't mean sell your position.
I would stay put and wait for the turbulence to play out. The market will always decide the price action.
***Not financial advice**

The next target of the Bitcoin cycle is the historically MVRV?Bitcoin's price is currently overbought locally. Yesterday, the price reacted with a decline of 4.9%. This was the first response, and now it’s important to hold the level of $62,700–$61,800. A breakdown below this level would signal a trend reversal to a downward trend with the first target being the imbalance zone at $52,500–$49,550, as marked on the chart. I would like to see investor support manifest in this imbalance zone, but if I don’t observe sufficient buying volume, I will expect a swift reversal and a breakdown towards the key on-chain level, the MVRV Pricing Bands (-0.5sd). This is a critically important level from which strong Bitcoin trends have historically formed in a broader perspective.
In a positive economic environment, there is a chance of a rebound from the $62,700 support zone, possibly forming a divergence and a potential double top. The reaction of sellers during the bounce from $62,700 will play a significant global role. If the price consolidates above $67,000–$68,500, then we could see a BullRun!

Bitcoin Market Cycle This chart tried to reflect the uncanny similarities between Bitcoin's previous cycles and will try to use that information to "predict" next market cycle top in terms of price and time.
The price is derived using Log FIB extension 1.618 and is the minimum Bitcoin has to hit.
Although Bitcoin has gone way above this extension in the past, I am going to keep things a little conservative.
The chart is aimed to not use any indicators to keep it clean but you can apply Pi cycle top indicator (which has been super accurate to make it more precise)
The chart shows how bottom of the previous bear market to the next one takes about 206 Weeks or so and how bear market lasts about 52-55 weeks while Bull market (from the bottom and not halving) is about 155 Weeks ish.
While the drawdowns are becoming less and severe by some percentage, I chose about 75% drawdown for next bottom in 2026 with price of about mid 40K.
Like someone said " All models are wrong but some are useful" this can clear some noise and provide us some timeframe when we can start taking some profits based on time and price.
Over time, I will provide update to this model if I think I can make it more accurate.
LFG!!

Are We Looking At A Bitcoin Bull Trap?In my last TA post, I talked about the possibility of Bitcoin heading back to the $35-36 range before the halving, and I still don't think I am wrong about that. Let's take a look at why...
Bitcoin is really hitting some resistance at the current range. When I look at other cryptos like Ethereum, it's much of the same. This pattern looks to me like a bull trap. This is where we bounce out of a significant down trend and this price action tends to catch bulls by the short and curlies as they think the price is going to recover and continue to the moon, but it just doesn't work that way. These retracement pumps tend to get people caught in a FOMO mode and then turn on them and head back in the other direction. I believe this is one of those times.
Very rarely does a market like Bitcoin just bounce straight up. It has it's big parabolic rises, yes, as we have seen recently, but this action cannot last forever. In the last cycle, we saw the pump from the 3K range up to nearly 15K and back to the 6.5K range before the halving, so my prediction of seeing a 35K-36K Bitcoin price before April is not out of the cards.
My non-financial advice to traders is if you have been trading this reversal from the 38K range, then you might want to think about taking some profits off the table. Just saying, because that is exactly what I am doing. I am also still DCA accumulating BTC as we go along and will stop that action once we break all time highs again, then it will be off to the races and looking for good market cycle take profit signals.
How are you playing this Bitcoin and crypto action?

Bitcoin Is On Track With Last CycleDoing some cycle analysis today and looking at the bigger trends. One thing I have been noticing is the correlation that Bitcoin has with last cycle's action. To me, Bitcoin is on track with last cycle, sometimes you just have to zoom out to see it.
Too many times in crypto, people focus too heavily on the lower term time frames, trying to catch profit swings, or looking for the next memecoin to bounce, that we forget to zoom out and see the bigger picture.
Today, I had to do just that to get a better perspective of where we are in the markets before I get to trading this week. There has been a ton of activity and 'sell the news' action after the Bitcoin ETF, which I actually sat out trading, but observed the price action. It actually went the way I thought it would. Pump before the news, dump after. We will see it rise in the longer term simply due to the fact that Wall Street is now a major player, but for now, we have to wait it out and see.
What I am seeing when I zoom out to the weekly time frame, is that Bitcoin's price action resembles last cycle in very eerie ways. They say history doesn't repeat, but it rhymes, well, this is certainly true for this cycle. If you look at the chart you will see the similarities. We are in that same after bottom pump that we had in 2018-2019 where the price rose up after the market bottom and then settled back down through the block reward halving event before we went to this recent cycle highs.
I am not seeing much different, and especially after the way the price has risen over the last few months without a significant pull back, me may be seeing that form at this time. I thought is that we see a potential decline back to 36K-38K because that is the closes major level of support where Bitcoin found some consolidation for a while. This creates a shelf for it to revisit. But it's not a bad thing if you want to stack some cheap sats. Just saying. We might be ranging for the next few months until the block rewards are cut in half, then through the summer into the fall, we may need to be watching for some fireworks! Until then, it's going to be some ranging so I am going to be looking to take some short range swings and accumulate for the bigger cycle push!
Just got to sit back, be patient, and trade logically! Just my dudely advice, haha.

Bitcoin CyclesJust another update to my long term chart. Add Pi indicator and clearer trends on the DXY.
Because of the way the DXY has been behaving, it has me thinking were not repeating the last cycle, but the one prior.
We still haven't had that peak in the RSI that was also present on both previous cycles, so yeah.. I dunno make of this as you will.
When things start showing this is wrong, ill admit im wrong.

BTC A New Way of Viewing Market Cycles?This idea is from an experimental historic indicator I'm working on which uses market price history to display a new type of crypto ribbon. Found some interesting patterns that I thought a few investors may find interesting.
2021 Market Cycle Pattern
2017 Market Cycle Pattern
2013 Market Cycle Pattern
2011 Market Cycle Pattern
Cheers!

Bitcoin: Next Big Cycle till December 2024Next Big Cycle till December 2024
Target 1: 150k$
Target 2: 250k$
1 year great buying opportunity --> DCA
I wish much fun for the next 1.5 years and enjoy the ride :)
Be patient!

BTC start forming divergence on 4H MACDBINANCE:BTCSTUSDT
Channels on chart its a key. If we a looking on local 4H situation we can see we are trade in 2 channels. On MACD we start forming like usual 3 bottoms divergence (maid going up, price on chart going down)
Downtrend white channel first support 12 October at 53900 top of this channel 10 November 69000
now we going down and found second touch support 4 December 42600 resistance at middle line white channel at 51700
now we have to find support at 46800 (higher low) 12-13 December and once again retest 0.5 level by fib since May
17 December going over middle line white channel 52700 and trade above with retest local fib downtrend line (dot lines) around 22 December we will touch 58700 (0.781 level by fib since May) and top of white downside channel. Then we will see if we reject price going to official bear market if we are breaking out we make a continuation and cycle will be longer than everyone expect. In this case you can check my previews idea about global BITCOIN moves since 2020.
Hope you enjoyed the content I created, You can support with your likes and comments this idea so more people can watch!
✅Disclaimer: Please be aware of the risks involved in trading. This idea was made for educational purposes only not for financial Investment Purposes.
Don't forget sub and join my channels under this idea!

Bitcoin Cycle Thoughts Current Short Term / Long Term PositionLonger term analysis of current market cycle position. Some of the data as to why certain points are used can be found in ideas (see related idea below for more info).
Bulls would probably feel short changed with the current state of the bitcoin "top" - should this current position be the top.
I personally am optimistic of price action however feel Bulls should be tested before further up can be relied upon. We have had a nice trap here which could drag price back down.. from there an aggressive push through the local ATH would set up for further gains.
The upside of this cycle has not lasted near enough time to be considered completed however there is a bear case in play that would see us dip further down from here. Lows in that case are $20k, but I would not rule lows of $12k out. provided there are no black swan events I would consider this the "worst case"
On the best case side, I will look for a blow off top anywhere around $90k as a low end, upwards from there would be extreme but as in the case of the bear view, the case is still in play.
I would look to reduce exposure on any aggressive down moves around £32k, but in general would not be shaken out by a drop below this point. Reduce exposure simply means reducing the risk tolerance slightly, securing some profit and waiting with enough still "in" the space to capitalise.

Bitcoin $526,000 August/September 2022August Capitulation: Fractal taken from prior capitulation in March 2020, lines up with the Gann speed fan & prior all-time-high Capitulation > Cycle Top: The time between the two would be 12 months exactly which is necessary to qualify for long-term capital gains tax in the US Elliot Wave Theory: Remains validated Fibanocci Indicators: Circles, extensions & parallel channels all bring confluence to this exact date & price Cathy Woods: Her macro-scale price predictions on well-known assets tend to be correct, Tesla 2018 prediction for a $800 share price in 2021 was correct (factoring in the stock split)

Bitcoin $526,000 August 2022 Cycle TopAugust Capitulation: fractal taken from previous capitulation in March 2020, lines up with the Gann speed fan & prior all-time-high Capitulation > Cycle Top: the time between the two would be 12 months exactly Elliot Wave Theory: validated Fibanocci Indicators: parallel channels, extensions & circles all bring confluence to this exact date & price
