BTC.D can drop to 43%#BTCD
Bitcoin Dominance reached almost long term resistance and rejected.
🐻 it can drop to support zone around 43%, which is a bullish sign for #BTC and #ALTs
break down from 42.5% can drop it more to long term support zone and descending support, that give us great opportunity to make profit from #ALTCOINS.
🐮 if bitcoin dominance reject from support of 43% it will head up to long term resistance again and cause more drop for $BTC.
Bitcoindominance

BTC.D what im seeing hereBTC.D what im seeing here
simple dom/price action comparison here.
this should follow the same long dump pattern it did last time imo, as thats how they reshuffle capital around to drain alts and your bags to reinflate btc when its time.
interesting stuff, lets see how this plays out.

Altcoins are putting in a MAJOR bottom here pretty sure. I yelled at everyone Jan 2021 that we're about to have an altseason and I'm seeing the same again hard as it is to believe. Ignore the news and sentiment and follow the charts. It's the part of the cycle where everyone hates on alts and says BTC is the only thing to hold, that's where you want to buy/hold through it. Pretty sure things are about to get exciting.

So when are we buying crypto again?Just a case study that I wanted to share with you guys
like and leave a comment if you enjoy it and find it useful XOXO
first let me introduce you to this chart: BTC.D
keeping it simple, BTC.D or Bitcoin Dominance shows you what percentage of the whole crypto marketcap is allocated to Bitcoin.
when the numbers on this chart are high, it shows you that the ALT MARKETCAP is draining, no matter what!
But, when this chart is bearish it shows you (NOT NECESSARILY!) that money is flowing from Bitcoin to other ALTCOINs.
Now let's rewind the previous cycle (2017-2018)
back in 2017, as you can see on this chart, the dominance of Bitcoin on Altcoins was completely lost and went in hands of Altcoins such as Ethereum.
That incident triggers the very memorable Alteason of 2017 which a lot of CT (crypto twitter) people like to brag about.
2017's Altseason lasted until late 2017 when Bitcoin finally tops around $20,000. as soon as the bloody year of 2018 begins, BTC.D started to pump towards high numbers.
at first, you would think that the glorious days are not finished but there is more to come for Bitcoin. But the little we knew that the great Bear Market is upon us!
The psychology of 2018 BEAR MARKET
as the market started to collapse, a lot of shit coins (not very valuable but extremely profitable in bull cycles altcoins) were losing over 90% of their value against Bitcoin,
but Bitcoin itself was losing 80% of its value against the U.S DOLLAR, so why the BTC.D was going nuts?
the answer to this question is very simple, the total market cap of the crypto market was draining, people were selling their coins and not reinvesting in lowers prices, but
there were still some investors left for Bitcoin, and you may forget that the BTC.D shows you the "percentage" of the dominant of Bitcoin over rest of the market, now when
Bitcoin was dropping hard in price the rest of the Altcoins were dropping even harsher and more. but I like to keep it dramatic so this is my favorite approach to this question:
Altcoins were about to Parrish from the market forever and left illiquid for the rest of their lives, but Bitcoin still had its bitcoiners, the people who bought literally above $19,000 or so, with the dream of selling their coins at 100,000 UNITED STATE DOLLARS. sounds a bit familiar, doesn't it?
so in reality you would expect the whole market to collapse together, but the big boys always survive. just like coronavirus and what it did to tiny little startups and entrepenures back in 2020.
Those who survived were left to tell the tails
Now the numbers are too low for people to even think about the $100,000 goal, the dream was finally over. so the market continued developing...
you may find this childish but the market actually breaths the same air that we breathe, it is alive just like us. as we approach the next HALVING for Bitcoin, the accumulation phase began. smart money was here way before retail investors dare to reactive their wallet addresses again. in that final phase we saw that Bitcoin dominance tops just after the Halving and the cycle repeats itself once again.
So what is my speculation
Yes you read it right, this is all speculation and not fact so, please do not consider this as financial advice.
we are obviously in a bear market and as I show you on my chart, the next time we can expect strength and smart money to come back to the crypto market is the next halving ( May 2024).
1- we haven't seen it all yet, another -50% on your favorite Altcoin is not out of mind
2- accumulation phase begins just after the capitulation phase, 2023 near the next halving will be a good time to invest.
3- don't try to catch any knives, prices won't skyrocket in one candle. it takes time and a lot of manipulations.
4- be patient, we can bounce 30% but the reality is the same, the next bull cycle is in 2 years ahead of us so keep your targets as low as possible
5- don't be greedy, with your longs and your shorts
6- GL

$BTCDOM/USDT 2D (#BinanceFutures) Rising wedge on resistanceBitcoin Dominance Index looks locally topped and about to reverse mid-term, let's give it another try!
Current Price= 1517.1
Sell Entry= 1517.1 - 1572.5
Take Profit= 1411.7 | 1311.6 | 1211.1
Stop Loss= 1656.1
Risk/Reward= 1:1.2 | 1:2.1 | 1:3
Expected Profit= +17.24% | +30.20% | +43.20%
Possible Loss= -14.40%
Fib. Retracement= 0.236 | 0.382 | 0.559
Margin Leverage= 2x
Estimated Gain-time= 5-6 months
Tags: #BTCDOM #BTCDOMUSDT #BTCD #BitcoinDominance #Index #Futures #Derivatives #Dominance
Contract:
www.binance.com

Bitcoin Dominance Mirror ImageBTC.D (Bitcoin Dominance) still needs to complete its "mirror image" back from December...
Currently, prices are trading safely above EMA10 and EMA50, long-term/weekly... This signal is strong enough.
We have multiple candles of bullish consolidation (green above EMA10) and the RSI is also super strong.
The signals are also bullish on this chart.
We wait and see how it goes.
Namaste.
Bitcoin Dominance RENKO (Weekly)We have a strong buy signal on the RENKO BTC.D index chart.
We can the last green brick closed above EMA10.
Supporter by really high volume.
A higher compared to February...
There is room for Bitcoin Dominance to go up.
Namaste.

Bitcoin Dominance Move Above EMA50 Weekly (Strong Signal)The Bitcoin Dominance Index (BTC.D) has gone bullish on the weekly timeframe.
We can see it growing above EMA50, which is a very strong signal.
We can also appreciate an RSI above 60 which is also really strong as this is the weekly timeframe.
Looking at the big trading channel above, it looks like Bitcoin Dominance is preparing from a strong price JUMP!
Namaste.

Will the Bitcoin continue to gain market share❓💎"The BTCDOM Index provides insights into the market and can be used as a tool to speculate on Bitcoin’s relative strength against altcoins. Essentially, the index measures the demand for Bitcoin relative to altcoins. When altcoins gain market share relative to Bitcoin, the BTCDOM index loses value. Conversely, when Bitcoin gains market share relative to altcoins, the BTCDOM index will gain value."
💎The BTCDOM Index broke above the resistance trendline, followed by the break ..........

Bitcoin Dominance Likely To Go Up!We can see that BTC.D (Bitcoin Dominance) managed to break and close above EMA300 (grey line).
We have higher highs and higher lows since mid-January...
The RSI is strong.
All these 3 are bullish signals.
This is not financial advice.
Thanks a lot for your amazing and continued support.
Peace, Money & Love 4 You!
Namaste.

Bitcoin and Bitcoin Dominance UpdatedBitcoin struggling to break over and head towards the 34,000 Resistance:
30900 would be the level we could dare to increase our Long positions whereas 28,600 looks like a more probable scenario.
At the same time, BTC Dominance is finally under resistance again and this calls to switch focus very fast to Altcoins:
In any case, this will be very interesting to see when the US markets open.
Volatility could be on today, be prepared.
one Love,
the FXPROFESSOR

BTC DOMINANCE - The Decisive ChartBitcoin Dominance is the key chart and it can be as tricky as it gets...
We see MAJOR Resistance right now at 45% and this is the second time it is put to the test.
If it breaks higher then BAD news for Altcoins (not necessarily for Bitcoin).
If again it gets rejected and eases lower towards 42% or lower then Great news for Altcoins.
On the chart you can see how we had a Bull Run in 2021 (orange level) when tis level dropped from 70% to 40%
So, if you want a 'Bull Run' and a major recovery on our ALTs then this is the chart you want to see lower.
I am also in this category but Bitcoin is my main asset, my preferred trade and Alts are secondary. That is just my opinion.
One Love,
the FXPROFESSOR

BTC.D to 50%#BTCD
Bitcoin Dominance broke out weekly descending resistance and confirmed it as support.
last week candle was a bullish master candle and probably it will drip to half of that candle for pullback that make an opportunity for BTC to rise to $34k.
and after that BTC.D can increase to long term support around 50% that will cause more drop in BTC price.

BITCOIN DOMINANCE AT RESISTANCE - Great News for ALTSFinally some good news from this chart as Bitcoin dominance is at resistance and ALT coins are rising.
We said it yesterday that the market has good chances to recover now and it is happening:
Buy when there is 'blood on the streets' but remember to Buy with a plan.
We told you : ' CRASH CREATES OPPORTUNITY''' and it did create opportunity. Here you go for tholse who followed and took a STEPN forward:
Keep in touch for frequent updates.
One Love,
the FXPROFESSOR

BTC Dominance - Market Update - 17.05.22Hello Traders!
If Bitcoin price goes below the current support in the $29500 - $31000 range, we should expect a continued decline in altcoins, which will lead to an increase in Bitcoin dominance.
On the chart, we see that the price value has found support near the 39.25% level and is currently approaching a breakout of the nearest resistance level of 44.50% and the local downtrend.
With significant selling pressure, we can expect an upward movement on the chart to the resistance level of 50.00% near which the MA100 on the weekly timeframe is located at the moment.
Good luck and watch out for the market
P.S. This is an educational analysis that shall not be considered financial advice

$BTC.D Triangle still valid and playing out. So here we have 2 paths I think this might follow...
Green path illustrates the main count with E already finished and assuming we will go up soon to make wave (2) and retrace quite a bit to create a bit of havoc on the market. This has the potential to play out within the next few weeks at the most, followed by an ALT season.
The red path on the other hand assumes that E is actually A (leading diagonal) of E, and that the current retrace is B of E and that we will go higher and above the triangle diagonal. This would cause the market to to go below expectations and would cause some real FOMO selling.
I'm about 60/40 in favor of E being finished.
Safe Trades, avoid shitcoins, and remember, wave 4 never retraces into wave 1. *wink wink.

A brief take on BTC DominanceI know, a lot of Traders do not rely on the BTC Dominance as an Indicator anymore, since it's not considered as useful indicator for the
current strength in the Market. I still take it into consideration for my trading.
Two patterns to be seen for BTC-Dom. At this Moment. The first one would be the Descending-Triangle and the second one would be a Double-Top Pattern. Both are considered "Bearish". The Target for the Dominance would be somewhere between 31.02% and 28.91%. If the Dominance really would break down, this would imply that a lot of the Altcoins would have a huge run.
On Thing to Consider:
In the last Bull market (17/18) something similar happened. BTC-Dominance was going sideways and then broke down leading to a huge Altcoin run, just to confirm the end of the Bull market. The Dominance, then, slowly began to rise as high as 75%, which clearly showed that most Crypto-Traders do see Bitcoin as a safe haven, for that Time at least.
Well, history doesn't repeat itself, but it rhymes - keep that in mind.
This Analysis is not intended to be investment advice. Always DYOR.

Bitcoin Dominance Suggests Bear MarketThis break-out is quite significant and realistically potentially indicates a real turning point in the market.
Up until recently, it was still questionable whether BTC would find a bottom and may continue the Bull Run.
But after the carnage this week and the Luna catastrophe, the market has lost all momentum.
Alts are bleeding to nothing and BTC has become king again.
If we simply use this chart to gauge where we are at on the Macroscale, this highly suggests we are well underway into the 2022 Bear market.
Now it is important to understand the targets for the BTC Domanence as it will prove to be potential turning points.
The first target being 50% and the second target being 60%.
If we compare the last Bear Market in 2018, it wasn't until after BTC Dom reached 60% before it found a bottom.
Now I'm not saying it has to hit 60% again this time, but I am definitely targeting 50% from here. That is the next point of interest.
My Bearish sentiment doesn't just stem from Crypto, it reaches far out toward the broader stock market and enormous macro headwinds.
I can't possibly explain it all in this post to keep everyone's attention but if you check back through my previous posts, there are soo many Gems to learn from to navigate this environment.
Now is the time to LEARN and grow your knowledge so you can benefit from all this chaos later on.
Now is when success is made, not at the top of the Bull Run.
Let me know if you have any questions!

DUMP?usdt dominance breaked major resistance , next target is 8.7-13% , seems like huge crypto crash is coming

Bitcoin Dominance Descending Triangle On Watch - Target 31% BTC.D still respecting the descending triangle. If confirmed over the next few weeks and months we could see bitcoin dominance reach the very low 30s maybe even into the high 20%. Alt coins will explode if BTC.D loses 39% IMO:

Bitcoin Dominance Breakout could Be Really Bad news ⚠️Bitcoin Dominance had been going sideways in what we called 'slow death April 2022'.
Well, early in May the price is attempting (right now) to exit from the descending wedge and it appears to be doing that going North (Up).
When Btc dominance rises it's bad news for Altcoins so let's be careful and see how the price behaves at resistance.
Keep you posted and remember what our plan has been this year:
Buy BTC, hedge with some short positions on some Alts and Nasdaq...
Been working here but still, very painful to see Alts losing even more ground.
This is our opinion here, our only advise is to do your own research and take it easy.
One Love,
the FXPROFESSOR

Do not disount Altseason - YET !!Bitcoin dominance is in a descending triangle for 12 months now.
It has touched the base three times now.
In most of the cases the breakout is bearish.
The PO of such pattern would be a dominance at around 25 - 27 %.
Do not discount an Altseason yet.

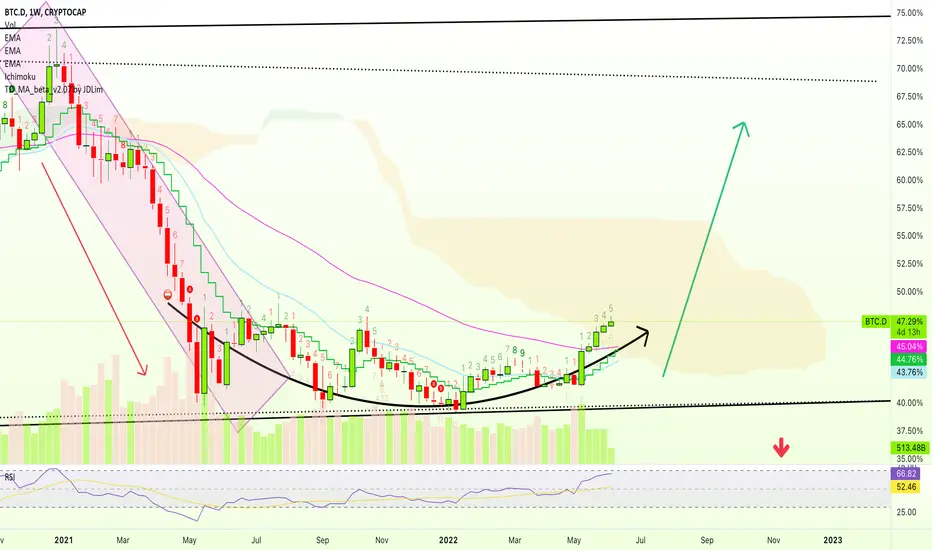
Rounding bottomBitcoin Dominance has formed a rounding bottom formation which is a bullish pattern how ever there are two things which needs to be consider here,
1. If this shoots up then alts and Bitcoin will fall.
2. We can see a relief rally if it goes down a bit and in this case we can see a pattern formation called CUP n handle which is also a bullish pattern.
So only time will tell what will happen, Hope for the best.
