Bitcoin Dominance Breakout$BTC Dominance is seeing break of the downtrend trendline, but has yet to make a HH to signify the break. RSI is breaking resistance, although it had not had many touches.
Typically a bearish scenario overall, but not always.
Bitcoindominance

Bitcoin sellers, really? That's all you got?Traders,
The charts are showing me that Bitcoin price action might now be ready to move up. Get ready!
- Stew

BTC Dominance is a big support, lets fall further!watch for BTC dominance move up
a bit and come back to the downside.
Do not freak out, this does not mean the
price will crash...it just means that some
of the money will come out of BTC and
be moved into the Alt-coin market...which
will make the Alt coins scream bullishWhen Bitcoin Dominance
gets to 39%-31% thats when
ALT coins will absolutely RIP!

BTC.D UPDATE! ALTSEASON SOON!!Hello everyone, if you like the idea, do not forget to support with a like and follow.
Welcome to this BTC DOMINANCE update.
Bitcoin dominance is trading inside a descending channel. SO here I expect two scenarios for BTC.D-
Scenario1:- BTC.D starts dropping from here and is likely to break below the channel. In that case, Altcoins start bouncing from here.
Scenario2:- We might hit again the upper trendline of the channel and from there we saw the rejection. After hitting the upper trendline it is highly likely that it starts dropping. In that case, we see some more corrections in Alts so that would give us the best entries.
So in both scenarios, we might see soon a great Altseason.
What do you think about this?
Share your views in the comment section.
If you like this idea then do support it with like and follow.
Thank You!

Bitcoin dominance Hello cryptofolks
If this pattern get validated we can expect a mini alt season and after that a good price gain in BTCUSD
Stay tuned
Goodluck

BTCD at support of 41.45#BTCD
Bitcoin Dominance struggle to break down from support of 41.45%.
🐻 breaking this support can drop BTC.D to 40% and lower that can cause more rally for ALTS and BTC.
🐮 holding this support will increase it to resistance of 42.8% , which is the end of rally of so many altcoins.

BITCOIN DOMINANCE: H&S PATTERN!! ALTSEASON IF?Hello everyone, if you like the idea, do not forget to support with a like and follow.
Welcome to this BTC DOMINANCE update.
BITCOIN DOMINANCE is forming a head and shoulder pattern here which is generally a bearish pattern. Currently, it is trading around 41.44 level and hovering near the neckline of the head and shoulder. If it breaks below the neckline then we can expect a quite good dump in BTC.D and a good pump in Altcoins.
If it bounces again from the neckline then we see some more correction in Altcoin. IMO it's better to wait for the close below the neckline. After that, we start taking positions in many altcoins. Till then stay safe.
If you like this idea then do support it with like and follow.
Also, share your views in the comment section.
Thank You!

Bitcoin Dominance Potential Strong Drop AheadBTC.D trading below EMA10 holding one final support... If it breaks, we will witness a strong drop.
The RSI is very weak as you can see...
We have the SPX correlation and you can see my previous bearish BTC trade ideas which supports this chart.
We have bullish and bearish waves.
Bullish wave March.
Bearish wave April.
We can expect another bullish wave May.
Strong bearish wave June...
Namaste.

Bitcoin Dominance BTC.D - Alt season! Huge descending triangle!- I hope you are ready for the upcoming alt season in 2022!
- We have a descending triangle on the weekly time frame, which is definitely very bullish for altcoins.
- Bitcoin Dominance is going down and there is still no signs of trend reversal.
- ABCDE triangle should be completed and now we are waiting for the huge breakout!
- Previous swing low resistance (2018) is our next target, then here we can experience a bounce.

BTC.D Critical Territory AgainThe Bitcoin Dominance looks like it wants to make a local low here , compared to the previous one it would be a Higher low and potential massive reversal to the upside can happen from this point.
1st Scenario (higher probability) BTC.D will break above 43,40% and thus confirm the higher low , which will lead to Altcoins bleeding versus their bitcoin pairing as up to 55% on a macro scale.
2nd Scenario (lower probability) BTC.D will break the 41,30% and thus Invalidate the local low , which will lead to Altcoins gains versus their bitcoin pairing (Mini-Alt season) , further down we have the BIG support around 40% , if the bitcoin dominance were able to break the 40% support a really Massive Altcoin season will occur.
P.S. Would like to hear your toughs and opinions in the comment section, Thanks.

BTC Dominance BreakoutGet above SMAs and we'll experience same PA as in sep-jan.
Break below, well we have never seen a cryptomarket which has less than 30% dom. of BTC
It would be fun tho

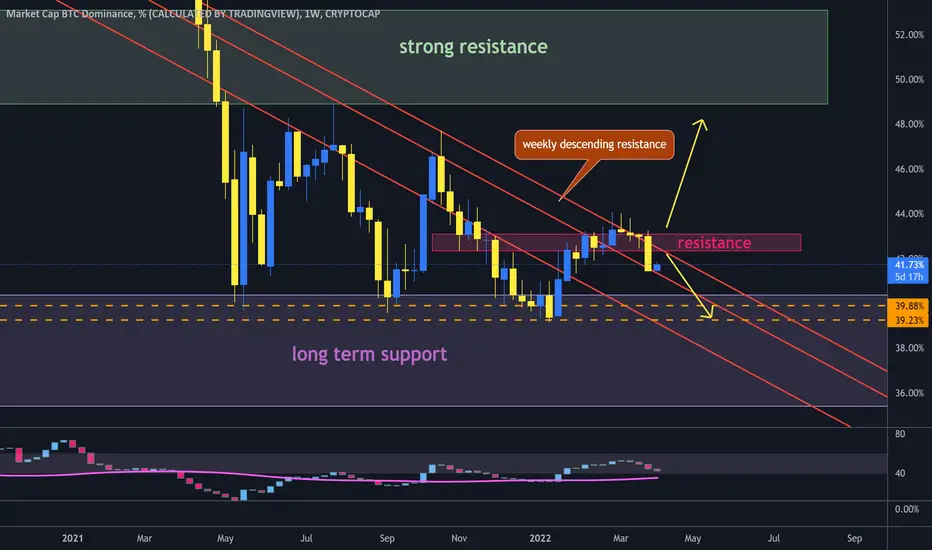
BTCD rejected from weekly resistance but still in critical zone#BTCD
Bitcoin Dominance rejected from weekly descending resistance, but still in this zone.
🐻 so if it hold the resistance zone, it can drop more to 40%, the alt season will continue and we can make more profit from BTC and ALTs.
🐮 but if dominance head up to break out resistance it will be the end of alt season.
❇️ so take your profits and wait for the rest. (more profit or closing positions)
BTC.D BREAKS DOWN! ALT SEASON START!!Hello everyone, if you like the idea, do not forget to support with a like and follow.
Welcome to this BTC Dominance update. Bitcoin dominance is inversely proportional to altcoins means when BTC .D increases Alts starts dumping and when BTC .D dumping, Alts starts pumping. BTC .D affects especially BTC pair altcoins.
Bitcoin dominance is breaking down from the rising wedge in the daily time frame and looks bearish. Also, it breaks below the 21D ma which is also a good sign for Altcoins.
The Green dotted line shown in the charts indicates the support level. I'm expecting the Bitcoin dominance to reach the 40 levels again and we might see a good Altcoin season in the 2nd quarter of 2022.
IMO it's best to accumulate some good Altcoins, especially in BTC pair on spot. Soon I'll share some good Altcoins in BTC pair.
What do you think about this?
Do you also think that we can see a good Altcoin season in the 2nd quarter of 2022?
Share your views In the comment section.
Thank You!

Bitcoin Dominance lost supportHello my friends...
BTC.d lost support and it means people doesn't buy bitcoin for now. so what are they doing?
if you look at USDT.d chart, you see bearish movement. so money is going toward Altcoins. find Bullish alts and buy them in supports.
if you have any questions about market, please ask in comments.

BTC.D chart from a different perspective / Plan HI think the technical chart is like a galaxy, and the easier it is to look at it from a distance.

SXP/BTC TRADE SETUP! READY TO PUMP MORE THAN 100%!!Hello everyone, if you like the idea, do not forget to support with a like and follow.
Welcome to this SXP/BTC TRADE setup. As I told you in my previous BTC.D update that Dominance is breaking down and ready to fall so it's the best time to accumulate some Altcoins in BTC pair. Here is my first pick.
SXP looks great here. Breaking out from a symmetrical triangle in the daily time frame. Looks like it is ready to go its previous ATH. Buy some now and add more in dips.
Entry range:- 0.00003200-0.000036
Target1:- 0.00004200
Target2:- 0.00005000
Target3:- 0.00005800
Target4:- 0.00006600
Target5:- 0.00007400
Target6:- 0.00008400
SL:- 0.00002800
Buy this on spot and hold it for 2-3 months.
If you like this idea then do support it with like and follow.
Also, share your views in the comment section.
Thank You!

BTC.D perps planpretty confident we get a double or at least a single tap of the 0.5 retracements. This will allow stronger alts and eth to run with it.
After,
1) if lengthening cycles do play out, I think an alt season is on the cards with BTC.dom falling way further.
2) if the majority opinion of a dead cat to 47-52 and then sub 30k plays out. I think ALT/BTC pairs will bleed very hard. and naturally lead to BTC.D making new local highs.

USDT Dominance Chart Showing WeaknessA while back I posted a Bullish Shark with Bullish Divergence setup for USDT.D that signaled that USDT.D would rise as BTC fell and since posting that BTC Dominance indeed went up and price has certainly fallen. Now we have the opposite situation with USDT.D showing us a Bearish Shark with Bearish Divergence that we've failed to test above twice now and if things go as planned we should see BTC rallying as the USDT Dominance chart falls.
I will be targeting the zone between the 50% and 88.6% Retraces for profit taking before looking for any signs of reversal later on which if found could prove to be bearish for BTC if that time comes.

#BTC Dominance Decisive time coming by 31st March, Here's why!Welcome to this brief Analysis of Bitcoin Dominance.
Reasons to Follow me?
*9 Years in Trading!
*7 years in Crypto
*Certified Technical Analyst
*Record Holder of Most liked Bitcoin Chart on Tradingview.
*Consistent updates on Markets and Trade Setups
*No Bias
*All-time Top Author on various assets and index charts globally.
*Very Active Community during both bull and Bear Market
Let's get to the chart!
Bitcoin Dominance is getting rejected at the local resistance but does not take it as a confirmation for a possible alt season.
ALTS are still bearish IMHO. We can buy way cheaper but later. It pumped almost 4.18% since my last post and I expect more growth in Dominance for the next few weeks. Possibly till the end of this month.
When it hits the resistance, that will be the actual time to know whether the index will break or get rejected.
Currently, it's almost reaching the resistance better wait for the right time.
If you follow me you already saved a lot of your funds which was possibly stuck in many altcoins.
INVALIDATION: A daily close followed by a confirmation candle below the 21DMA and 50DMA will invalidate this chart.
What do you think?
Do let me know and hit the like button.
Thank you
#PEACE

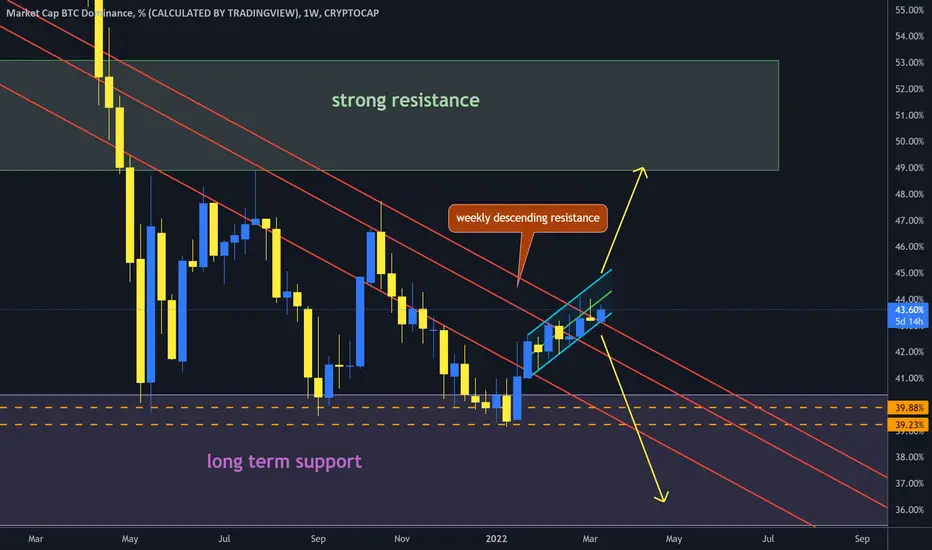
BTCD struggle with weekly resistance#BTCD
Bitcoin Dominance is above weekly descending resistance but this weekly candle is still open.
🐮 if this weekly candle close above descending resistance it will head up to long term resistance zone around 50%, that can force BTC drop
🐻 and if this weekly candle going to close below descending resistance, it is possible that drop to support of 39%, and help BTC grow.
ALT SEASON SOON? BITCOIN DOMINANCE UPDATE!!Hello everyone, if you like the idea, do not forget to support with a like and follow.
Welcome to this BTC DOMINANCE update. Bitcoin dominance is inversely proportional to Alts means when BTC.D starts dumping altcoins starts their rally and vice versa. Currently, BITCOIN Dominance sitting at support.
BITCOIN Dominance makes a rising wedge pattern in the daily time frame. Once it breaks down this rising wedge altcoins will start bouncing especially in BTC pair.
There is also 21ma support. Once break below this we get the confirmation and after the confirmation, I share some good altcoins which gave us amazing profits in the Alt season.
Do you think we can see alt season in 2022?
Share your views in the comment section.
If you like this idea then do support it with like and follow.
Thank You!

📊BTC.D - An important area reachedCRYPTOCAP:BTC.D reached an area of strong resistance. The confluence of levels in this zone along with a bearish formation (descending triangle) favors a bounce back to 39%
If it breaks the resistance (~44.50%) we can expect a quick rally to 49%
The next few days/weeks will tell us more about where we're headed.
!! be prepared for a small altseason🤑 as well as for alts sell-off💀 !!

$BTCDOM/USDT 2h (#BinanceFutures)Ascending triangle break retestBitcoin Dominance Index broke-out bullish on Low Time-Frame (LTF), let's catch next pull-back to 50MA support for continuation scenario.
Current Price= 1273.5
Buy Entry= 1260.1 - 1248.7
Take Profit= 1285.0 | 1311.5 | 1330.9
Stop Loss= 1228.8
Risk/Reward= 1:1.2 | 1:2.23 | 1:2.99
Expected Profit= +19.52% | +36.40% | +48.80%
Possible Loss= -16.32%
Fib. Retracement= 0.618 | 1.117 | 1.414
Margin Leverage= 8x
Estimated Gain-time= 10 days
www.binance.com
www.binance.com
www.tradingview.com
