BITCOIN - Will The Price Return?❌ Bitcoin is currently trading in the range of 39,500, which is a slight recovery from yesterday. Yesterday, its price fell to the range of $ 38,400 (about 2%).
Today, Bitcoin's dominance in the digital currency market is about 42.2%, and the Total Market Cap, which is 1.4% higher than yesterday, is about 1.77 trillion dollars. The trading volume of the last 24 hours has also decreased significantly and is estimated at $ 54 billion.
Among the Altcoins, the Chiliz rose more than 20% yesterday, and the Monero and Convex Finance were the bullish currencies. Other altcoins have not been recovered yet.
The Fear and Greed Index of digital currencies today, like yesterday, shows 22 and is still in the Extreme Fear range.
✅ Well, let's look at Bitcoin in the 4H timeframe
Bitcoin's current candlestick is close to the uptrend line, and one of the possible scenarios for price recovery could be the same as the uptrend line. But will the price return from this point, or will the uptrend line be broken?
Although the $ 40,000 support for Bitcoin has been lost in recent days, the uptrend at this point is a good sign for market investors. If the price maintains its current bullish reaction to this trend line and re-enters the $ 40,000 range, we can expect Bitcoin to grow again in this range by stabilizing above $ 40,000.
But if the Bitcoin uptrend breaks and stabilizes below the trend line, it is possible to accelerate the downtrend again. In that case, the next price target for Bitcoin would probably be $ 36,000.
Bitcoindominance

BITCOIN - Will the decline continue?Bitcoin's $ 40,000 support fell sharply yesterday to $38,400. But will the decline continue?
Bitcoin dominance over the digital currency market is about 42.3%, and the total market cap of cryptocurrencies is about $1.76 trillion, down 4% from yesterday. The trading volume of the last 24 hours is estimated at $83 billion.
Altcoins have also fallen in price with the recent drop in bitcoins. Ciphers like Waves have dropped by about 15%. And Celo and Anchor Protocol currencies have experienced slight growth of around 5% and 7%.
The fear and greed index was at 22 today, which indicates the Extreme Fear range. Yesterday, the index was in the Fear range and showed 33.
Bitcoin lost $40,000 in support again yesterday, falling below $38,400. The price is currently trading at $39,000.
✅ But will these losses continue?
In the daily channel, Bitcoin breaks the middle line of the channel downwards. Of course, the positive point is that the price below this line has not stabilized, and it is still possible to return to the top of the line if Bitcoin is supported. If the price returns above the midline of the bullish channel, its next destination will be the channel ceiling.
But if the decline continues and the acceleration accelerates again, it is possible that bitcoin will reach the bottom of this channel, which is the support of $35,000. Of course, $39,000 and $36,000 are good supports for Bitcoin, and the price may be back before it reaches the bottom of the channel.
✅ It is better to know this news today:
1- Switzerland intends to block Russian cryptocurrency assets in that country. It will seize the crypto assets of active Russian companies and Russian citizens.
2- Bitcoin whales moved nearly 11,000 bitcoins in an hour. These transfers have certainly been effective in recent price declines and have taken place in two transactions.

#BTC Dominance. ALTSEASON will trigger at this level...
Welcome to this extensive analysis of Bitcoin Dominance.
If you are reading my updates for the first time, make sure you follow me if you want the most complex charts
Explained in the most simplified manner.
I also post margin and futures trade setups.
Now, let’s get to the chart.
BTC Dominance is currently holding the 42.4 level. As long as it holds this level it's highly likely we will see some rally in BTC while it reaches the 45.22% level. This will trigger the rally in BTC too, possibly till $46k only if it maintains $38k support.
CONCLUSION:- BTC.D is likely to rise to 45.22% and get a rejection at that point which will eventually trigger the rallies in altcoins against BTC pair.
Invalidation:- Daily close below 40.27
What do you think of this chart?
Do share your views in the comment section and do not forget to hit the like button.
Thank you
#PEACE

BTC.D IS ON FIRE Bitcoin Dominance has now reached to multiple harmonic pattern's PRZ , that's the way I see ...

#BTC Dominance ALT SEASON POSSIBILITY EXPLAINED!!
Welcome to this extensive analysis of BTC Dominance.
If you are reading my updates for the first time, make sure you follow me to read the most complex charts
Explained in the most simplified manner.
I also post margin and futures trade setups.
Now, let’s get to the chart.
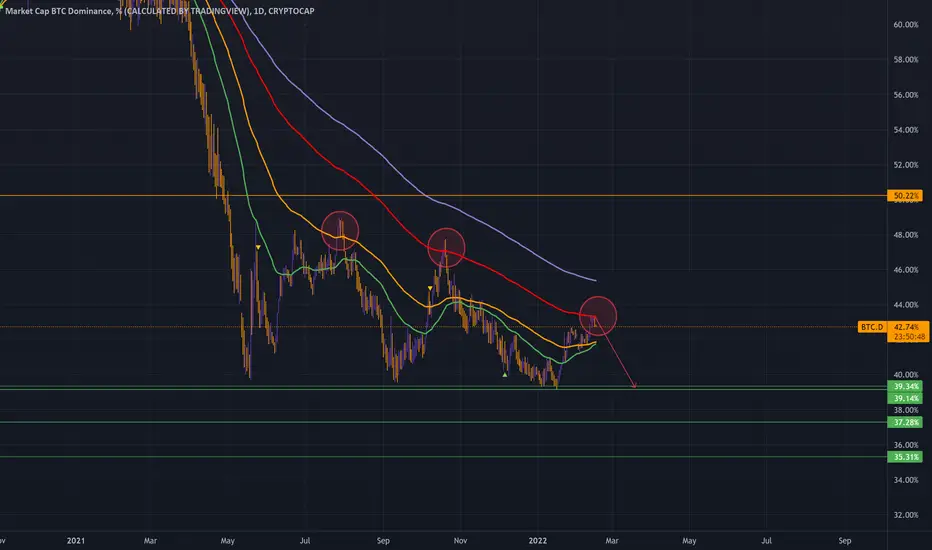
BTC Dominance bounced right from the bottom of the channel around 39.15.
Currently moving around 42.27 level and broke above the blue MA.
The chart is pointing towards a possible rally towards 45.49 in the next 2 to 4 weeks.
This will eventually give some momentum to BTC against altcoins.
ALTS in BTC pairs are likely to continue some decline for the next few weeks unless it hits the legacy trend line resistance which is almost
300 days old. So once the index reaches that resistance level a rejection would lead to a 3 months rally in Altcoins in BTC pairs. So we need to wait for a few weeks to see
whether it breaks the resistance or gets a strong rejection.
CONCLUSION:- Alts will continue to bleed till dominance reaches 45.49 level. Once that level is reached I will update the next chart.
We will have to see whether it gets rejected or breaks the trend line.
Invalidation:- Close below the Blue MA.
What do you think of this chart?
Do share your views in the comment section and do not forget to hit the like button.
Thank you
#PEACE

$BTCDOM/USDT 12h (#BinanceFutures) Rising wedge breakdownBitcoin Dominance Index just lost 50MA support and seems to be heading lower, that would be a nice relief for Altcoin.
Current Price= 1205.1
Sell Entry= 1209.2 - 1228.8
Take Profit= 1162.2 | 1131.3 | 1101.2
Stop Loss= 1262.7
Risk/Reward= 1:1.3 | 1:2 | 1:2.7
Expected Profit= +18.64% | +28.76% | +38.64%
Possible Loss= -14.32%
Fib. Retracement= 0.382 | 0.5 | 0.618
Margin Leverage= 4x
Estimated Gain-time= 5 weeks
Tags: #BTCDOM #BTCDOMUSDT #BTCD #BitcoinDominance #Index #Futures #Derivatives #Dominance
www.binance.com
www.binance.com
www.tradingview.com

Altcoin Dominance at bottom of Daily ChannelIf we're going to see alts continue to gain in dominance, it needs to turn around here. That's not to say that it couldn't ride the bottom for longer before it turns up, but we shouldn't see it drop much lower.
Lose the channel and expect it to move down more before up.
Bitcoin dominance looks like it's very close to moving down, having created a wedge here (inverted chart below).
- That said, if BTC.D moves above ~46-47% and doesn't see a strong reaction turning back down, then we're likely to see more correction across the market or at least a sharp rise in Bitcoin that eats up alts.
- Or, instead we see others.d move up from channel bottom and btc.d move down to new lows, we may see an alts run prior to btc moving back towards ATHs or even a new ATH.

Possibility of the BTC.D and the Altseason SenarioAs you know, the whole BTC.D is in a bear market structure since 2016. if we look at the bear market structure of 2018 of BTC we see a similarity between the behavior of the BTC.D and BTC /USD
they both reacted to the main resistance level several time and each time they bounce less (lower high)
and each time they pass the resistance line (more depth and time)
I would say since the 2021 BTC.D is having a similar structure to the 39.8%, it might be the scenario that we have one more test of 39.8% and bounce back to 41% (the last jump), and then we have everything season (where BTC Dominance will fluctuate in the resistant line) and after few days/weeks alts will be outperforming BTC

DominanceFast update.
- Rejected on EMA200 D1.
- Follow BTCDOM is important to detect and understand next altcoins pump.
Happy Tr4Ding!

Alts are on the brink of melting faces.As you can see Total 3 is in a descending broadening wedge and was most recently rejected at the upper diagonal line of resistance.
Assuming BTC continues it's bullish reversal we can expect Alt's to do likewise.
Could we come back down and test the recent lows again? Yes. But there's also a good probability that we hold the 720B area as support and attempt at breaking out of the descending line of resistance. A break above would finalize an inverse head and shoulder pattern with a breakout target at the .786 fib level which is approximately at 1 trillion.
I think we could see this break out around mid-late February with a run towards 1 trillion ending at around mid-March.

BTC.d three possible scenariosThis is a 20 minute video showing everything I know about this Bitcoin Dominance (BTC.d) chart. In the beginning, I show basic things about BTC.d for those who do not understand the importance of it to altcoin holders. So if you are experienced, be patient. In the latter half, I go into more technical detail.
The three scenarios I go over is that this wave form of this altcoin bull market is a:
1) 12345 impulsive wave
2) Wave B (wxy) corrective
3) Flat (ABC)
I also show what possible pattern BTC.d might form going forward in years.
I think there is something in this video for both the inexperienced and experienced traders.

BTC.D UPDATEBtc dominance clear two scenarios shown here. The results are that if dominance pumps that means first the king will pump and then after alts and in second scenario if we go down directly down from here that means king and alts will pump together.

Weekly Levels - February 6, 2022 (Watch Bitcoin THIS WEEK!)This week Bitcoin BITFINEX:BTCUSD is at a key RESISTANCE LEVEL and you need to watch it! We take a look at the Bitcoin Market Dominance to see if Alt Season is underway. The S&P500 and Nasdaq Stock indexes and the VIX Volatility Index are all giving us signals that this recent correction is over! Oil continues its rise to 100.
Now is the time of year for volatility which equals OPPORTUNITY! Do not miss out!

Bitcoin Dominance: 1W Chart ReviewHello friends, today you can review the technical analysis idea on a 1W linear scale chart for the Bitcoin Dominance.
The chart is self-explanatory. The Bitcoin Dominance recently broke out of the S/R 1 line and headed for a re-test. If the re-test is successful and the price moves upwards, the Bitcoin Dominance will start moving up. I noted multiple Support and Resistance Lines to keep an eye on. The RSI also broke out of a resistance line headed up. Lastly, a Triple Bottom was recently formed which is bullish. This is a weekly chart so please be patient.
Included in the chart: Trend line, Support and Resistance Lines, RSI, Triple Bottom Formation.
If you enjoy my ideas, feel free to like it and drop in a comment. I love reading your comments below.
Disclosure: This is just my opinion and not any type of financial advice. I enjoy charting and discussing technical analysis. Don't trade based on my advice. Do your own research! #cryptopickk

BITCOIN DOMINANCE About to EXPLODENow Dominance of Bitcoin is situated into a falling wedge which means a breakout will happen soon. MACD is neutral below the positive line but it s not bearcrossed.
Ai trimis
Stochastic is oversold and soon will jump
Ai trimis
at RSI you have a huge bullish divergence which means the dominanta wil skyrocket up and the trend will be reversed

Bitcoin Dominance About To Shoot Up!Here we have a very good setup for the BTC.D (Bitcoin Dominance Index) chart.
When we look at "a", "c" and "e" on the wave count above, we can notice lower lows while we have strong higher highs on the MACD and RSI.
The MACD has now entered the bullish zone daily and the RSI is really strong:
Now, going to the weekly timeframe -the main chart above- we can see prices closing above EMA10 last week and EMA21 being challenged.
We also have a higher low compared to May 2021.
The trading volume is still low and needed for confirmation.
Bitcoin Dominance (BTC.D) is set to move higher.
This analysis is invalidated on a candle close below 39.15%.
Thanks a lot for reading.
Namaste.

BTC Dominance - Never Doubt The King: The Only Green Chart! 🚀While the market is red. There is ONE chart that is green. 🤩
It's called the BTC Dominance chart. Never doubt the king. 🤴
Like and follow if you liked my idea!

BTC.D inside weekly resistance#BTCD
#Bitcoin #Dominance
it is inside weekly descending resistance zone.
break it out will increase dominance to green resistance zone, and we better to have no altcoin in our bag.
rejection from descending resistance will drop it to support zone and 31% and maybe another great time for Alts and #BTC.

BTC.D. P-Modeling Pt 6. The Cajun Cups of Bitcoin Dominance Welcome Hyperspace Travelers,
This is BTC .D. Depicted by Cajunomics.
Bitcoin Dominance is very special. How it is special is for you to figure out. The greatest thing about Tradingview is the ability to press play on the charts after time has elapsed. Be sure to come back after 6 months to press play.
Your mouth will drop.
This will be one of the most studied charts of mine for years to come.
But I am a simple pleb swimming endlessly in the pool of knowledge.
I know enough to make you think twice about your plan.
It whispers sweet melodies into your soul. Time and time again, I find myself staring in awe at one of my time-series creations.
Bitcoin dominance is going to 96%.
This means it will absorb the entire alt coin market.
Doubtful?
Excellent.
It means BTC .D is going to absolutely rip your face off.
The technical presented is quite simple when you take a step back and look at my overall macro narratives..
As it should.
Net Weight distribution of BTC .D will fuel a USD ( DXY ) hyperinflationary cycle to 135.
Net Weight distribution of BTC .D will also fuel a XAU .USD ( GOLD ) hyperinflationary cycle to 2600.
That is your clue.
Absorption of BTC .D with TOTAL Market Cap absorption = 100% chance of BTC going back to abysmally low level.
This chart is old. I have worked on this for years.
Waiting patiently for the narrative to execute.
Oh and it will execute. That is a guarantee.
One of the best kept secrets in the game...
Thanks for Pondering the Unknown with Me,
Glitch420

Bitcoin Dominance Bottom - Altcoin Winter ApproachesData from our Crypto SmartWatch Portfolio Balancing Spreadsheet, The Altcoin Opportunity Index is in the low red zone, suggesting Altcoin Winter is near.
In today's update we saw the following
- a bearish shift as we see
- 5 coins hit the 4 hour EMA Exit to drop to 1/2 position size
- 3 coins hit the 12 hour EMA full exit signal
The Alt Entry Index will rise as we go into a bear market for alts, but the Entry Index alone is not enough, we will need the Opportunity Index high at the same time for a really bullish setup.
VIEW the January 17 2022 Altcoin Opportunities Panel
Throughout the past months, I've been watching for BTC.D to bottom and rise along with Bitcoin finding a bottom and rising.
I recently posted details in a video on YouTube
'Altcoin Winter Alert'
www.youtube.com
Please leave a comment. Let me know if you think BTC.D will be rising for the next while. If you do, let me know with yes I do. And give examples of what made you come to that conclusion.
And
if you don't think Dominance will rise, let me know that you don't.
And in my next videos I'm going to break down some of the indicators we use and what they are saying about the next moves in Dominance.
So if we all share as a group, we'll then get better ideas for making the most of the next moves in crypto.

#BTC Dominance Breaking Down? Or Just a Trap!Welcome to this quick update folks.
BTC dominance is currently retesting the Blue MA on this 2day chart after breaking down.
If we consider the wicks the scenario changes completely opposite of what we see here.
Considering the current chart, It's highly likely we will see a dump in this index in the next few weeks given the condition it stays below this Blue MA.
Close above this MA will invalidate this chart.
ALTCOINS in BTC pairs will show some strength in the coming days.
Currently, most of my portfolio is in USDT and BTC.
I will accumulate the altcoins with some good fundamentals and will hold on spot.
What's your trading plan?
Do hit the like button and share your views in the comments section.
Thank you
#PEACE

