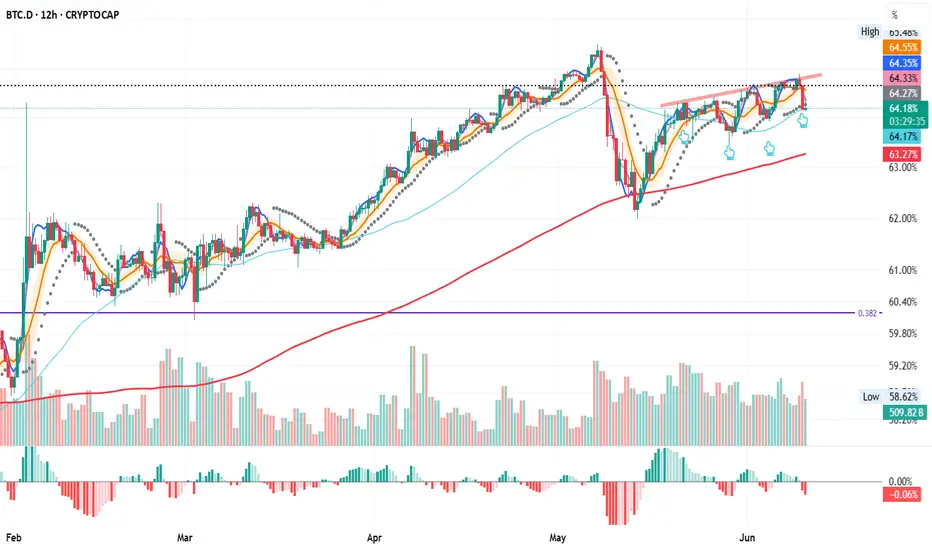
BTC.D – Repeat or Reset?
BTC.D (Bitcoin dominance) on the 12H chart is now testing the 50MA for the fourth time.
The last three touches led to a bounce toward the triple top trendline.
Will it play out the same way again, or will the 200MA need to step in as support?
Let’s watch it unfold together.
Bitcoindominance
Altseason Index Proxy (TOTAL3 / BTC.D) Weekly TF
Symbol & Timeframe:
* **Symbol**: CRYPTOCAP\:TOTAL3 / CRYPTOCAP\:BTC.D
* **Timeframe**: Weekly (1W),
* **Purpose**: A clean, data-driven proxy for detecting altseason momentum
Technical Structure:
✅ Key Support Zones
* **13.47B (61.8% Fib)**: Critical golden zone; current price consolidation area
* **12.45B (50.0% Fib)**: Lower bound of golden zone
* **11.00B**: Historical support zone
* **8.15B (0.0%)**: Absolute bottom of retracement range
🔹 Hidden Bullish Divergence
* **MACD Histogram & Signal Lines** show hidden bullish divergence
* Price action forming **higher lows** while MACD makes **lower lows**
* Indicates trend continuation potential
🔢 Fibonacci Targets
TP1: 16.8B (100.0%)
TP2: 22.2B (161.8%)
TP3: 30.7B (261.8%)
🔄 Expected Path
* Potential short-term correction toward 12.4B followed by a breakout
* Bullish continuation path sketched with progressive Fib targets
📈 Macro & Fundamental Confluence
📉 Liquidity and Monetary Easing
* Global monetary policy is easing (e.g., Fed pivot expected mid-2025)
* Increased liquidity historically precedes strong altcoin rallies
BTC Dominance Decline
* BTC.D rolling down from long-term highs
* Signals beginning of capital rotation into altcoins
🚀 Emerging Narratives
* Rise of L2s (e.g., Base, zkSync), AI tokens, real-world asset protocols
* Fresh narratives tend to amplify altseason rotations
💼 Institutional Tailwinds
* Spot ETH ETF approvals pave way for alt ETF flows
* Regulatory clarity expected to reduce uncertainty in late 2025
Related Reference Charts:
🌐 TOTAL3 (Altcoin Market Cap Excluding BTC & ETH)
📊 BTC Dominance (BTC.D)
These charts offer standalone confirmation of:
Altcoin strength forming on TOTAL3
BTC dominance facing structural resistance
Composite Altseason Thesis:
1. Liquidity injections + halving = BTC rally
2. BTC.D breakdown + TOTAL3 support = altcoin strength
3. Technical confirmations: hidden divergence, fib confluence
4. Narrative and regulatory catalysts = widespread rotation
**Conclusion**:
We are entering a prime zone for altseason acceleration. Price reclaim above 13.47B and continued BTC.D drop will validate bullish thesis. Monitor closely for breakouts past TP1 and momentum into TP2/TP3.
📌 Current status:
- Price rebounding in the 12.45–13.47B Fibonacci zone (50–61.8%)
- Hidden bullish divergence on MACD + ascending price structure
- BTC.D has rolled off 65% resistance — suggesting capital rotation
📊 Altseason Thesis:
1. Post-halving BTC rally → profit dispersion into altcoins
2. Macro conditions (Fed pivot, record liquidity) enabling risk-on environment
3. Technical confirmation via index momentum and fib structure
4. Narrative tailwinds: Layer-2 adoption, AI-crypto, altcoin ETF catalysts
📈 Targets:
- TP1 @ 16.8B (100% Fib)
- TP2 @ 22.2B (161.8% Fib)
- TP3 @ 30.7B (261.8% Fib)
🟢 Key support: 12.45–13.47B zone; breakout + BTC.D collapse = altseason trigger.

BTC.D (Dominance at Critical Fibonacci Confluence) 2025 Weekly
**Summary:**
Bitcoin Dominance (BTC.D) is testing a major Fibonacci confluence near the 66% level. This zone historically acts as a major pivot and may signal either a continued dominance rally or a potential reversal setting the stage for altseason. We use three layered Fibonacci retracements to outline dominant trend zones, key resistances, and projected targets.
**Chart Context:**
This chart uses **three distinct Fibonacci retracements** to map the historical and projected behavior of BTC dominance:
1. **Primary Fib** (100% to 0%): Captures the macro move from BTC.D \~100% down to its 0% level at \~0%, which aligns with the first altseason (2018–2019).
2. **Secondary Fib** (100% to 38.88%): Maps the first bearish wave to identify potential recovery levels. BTC.D retraced up to the 61.8% (\~73.68%) but failed to break further.
3. **Third or the Current Fib** (73.68% to 38.88%): Maps the latest bearish fall in BTC.D. As of now, BTC.D is hovering at the 78.6% retracement level of this move, indicating heavy resistance.
**Key Technical Observations:**
* **1st TP (Resistance):** 66% — Strong Fibonacci confluence zone:
* Fib2 48.6% ≈ Fib3 78.6%
* Major reversal zone historically
* **2nd TP (Support):** 52.25% — Multi-Fib confluence:
* Fib1 48.6%, Fib2 61.8%, Fib3 38.2%
* **3rd TP (Ultimate Support):** 38.88% — Historical BTC.D bottom, aligned with the first altseason.
* Intermediate Fibonacci confluences between 48%–60% serve as layered support during decline phases.
**Indicators:**
* No external indicators used; pure multi-frame Fibonacci confluence.
* Price action structure and historical patterns highlight potential market rotation zones.
**Fundamental Context:**
The current phase of the market reflects increasing speculative activity in altcoins while Bitcoin consolidates. Historically, high BTC.D correlates with Bitcoin-led rallies, while a sharp drop often triggers altseason.
* Growing inflows into ETH, SOL, and possible now XRP, and mid-cap alts suggest capital rotation.
* If BTC.D faces rejection from 66%, the market could enter a new altseason phase.
* Macro tailwinds (e.g., easing monetary policy, risk-on sentiment) support altcoin performance in the medium term.
**Philosophical or Narrative View:**
BTC.D acts as a barometer of market risk preference. As confidence expands beyond Bitcoin, money flows into altcoins—like tributaries branching off the main river. The rejection from major confluences signals this psychological shift, marking phases of creative decentralization.
**Related Reference Charts:**
* TOTAL3 Fibonacci Setup (Altcoin market excluding BTC & ETH):
* TOTAL2 Correction Probabilities:
**Bias & Strategy Implication:**
* **Primary Bias:** Bearish rejection from 66% followed by correction to 52% and potentially 38.88%.
* **Alternative Scenario:** Brief breach above 66% before reversal.
* Traders may consider rotating into altcoin exposure if BTC.D confirms reversal at the confluence zone.
**Time Horizon:**
* Mid to Long Term (1–6 months outlook)
* Weekly timeframe tracking
**Notes & Disclaimers:**
* This analysis is for educational purposes. Market conditions may evolve rapidly.
* Use proper risk management when acting on dominance signals.

Biggest Altcoin Season of this Bull Cycle is Coming! As you can see, there is a Massive Ascending Broadening Wedge forming on the #Bitcoin Dominance!
Currently dominance is located almost near the top of the wedge. More likely we will see its ascend up to 67% which will be marked as top before the dump.
The breakdown of this wedge will signal a beginning of a HUGE Altcoin Season (comparable to Autumn of 2021 or Autumn of 2023) when not only small cap, but major altcoins will be sent to new highs. With high probability it will begin in August and will last till December this year.
Mark my words & be prepared for the last opportunity of this bull cycle!

BTC Dominance New Update (12H)We are truly at a critical point for Bitcoin dominance.
It’s possible that the main drop in Bitcoin dominance has already begun. If the green zone is lost, dominance could experience a deep decline, especially since the final wave of this diametric pattern | wave G | has touched the 0.618 Fibonacci level.
That said, there’s still a chance that the green zone might once again push the price near the previous high before we witness the drop in dominance. However, there are also signs suggesting that the main drop may have already started. Follow the chart closely and monitor it with precision.
For risk management, please don't forget stop loss and capital management
Comment if you have any questions
Thank You

Skeptic | Bitcoin Weekly Recap #15 Bull Run On? Altcoin Next?Hey everyone, Skeptic here! Bitcoin’s been throwing curveballs this past week—did it leave you spinning? 😵 Still unsure if the bull run’s officially on, or hunting for the perfect altcoin entry? Don’t worry, in this recap, I’m laying it all out with clear reasoning to give you a crystal-clear view of the market and help you ditch those FOMO-driven decisions. Here at Skeptic Lab , we analyze Markets with one motto: No FOMO. No hype. Just reason. We’re not like others who panic over dumps or hype every pump—we’ve got risk management , stop losses , and we stay glued to the market’s pulse. Let’s dive into the Bitcoin Weekly Recap and unpack it all! 📊
Monthly Timeframe: The Big Picture
Let’s zoom out to the last three months. The 74,000 to 82,000 range has been a rock-solid support zone for Bitcoin, with heavy shadows every time we touch it. Big shadows like that scream potential trend reversal, and right now, Bitcoin’s major trend is firmly uptrend. Until we see a clear signal for a trend change, all that noise about Bitcoin crashing to 50K or “the bull run’s over” is pure nonsense. If you hear anyone making those bold future price predictions, run the other way! Our job isn’t to predict the future—it’s to map out scenarios and have a plan when they play out. Comparing the 2022 bear market to now is flat-out silly. Why? Back then, we’d already seen massive gains, but now, we haven’t had significant growth yet—altcoins are quiet, and total market volume hasn’t spiked. The end of a trend isn’t when everyone’s scared of losses; it’s when everyone’s dreaming of becoming a millionaire and the news is pumping FOMO. 😄 So, ignore those baseless analyses and let’s get to the real stuff.
Weekly Timeframe: Momentum Check
On the weekly chart, we kicked off a solid uptrend momentum, even hitting a new all-time high. Bears tried to jump in and sell, but here’s the catch: the previous ceiling hasn’t been technically broken yet, so we haven’t gotten a clear buy signal. Why? Because support and resistance levels aren’t static—they shift over time. The longer time passes, the higher or lower these levels move, and they need updating. Right now, we got rejected after testing the ceiling because our true resistance is still intact. So, when do we get confirmation? Let’s drop to the Daily Timeframe for clarity.
Daily Timeframe: Spot Trigger
After breaking 112,000 , we’ll get the main confirmation that the last ceiling before the correction is broken, signaling the continuation of the major uptrend per Dow Theory. That’s our spot buy trigger—buy above 112,000 with a stop loss below 100,000 , giving you a 10% stop loss size. Please, manage your capital so that if you hit the stop loss, you lose no more than 3% of your total capital. Staying alive in financial markets hinges on risk management. Now, let’s hit the 4-Hour Timeframe for long and short triggers.
4-Hour Timeframe: Long & Short Setups
We had a solid upward trendline on the 4-hour chart, but it broke to the downside. When this happens, two scenarios are possible: either the uptrend’s slope has just softened with no trend change, or we’re entering a correction. My take? We’re likely heading for a time-based correction (think range-bound boxes). If we start ranging, don’t beat yourself up or pile into trades impulsively—win rates for most traders tank in range phases, and losing streaks pile up. For long positions, I suggest waiting for a break above 108,900 . That’s where we got a strong rejection and pullback last time, so we need solid confirmation to go long since bearish momentum is stronger in this phase. For shorts, 105,000 was a good level, but the next short trigger is a break below support at 101,577 . If we see a strong reaction at any level on this timeframe before that, you could short on a break there too. For breakout confirmation, indicators like SMA or RSI work, but volume is king. High volume on a break means it’s likely to continue; low volume screams fake breakout, so cut your risk there.
Bitcoin Dominance (BTC.D): Altcoin Timing
Let’s wrap up with a quick look at BTC.D to figure out if it’s time to jump into altcoins. BTC.D shows Bitcoin’s share of the total crypto market cap—the higher it is, the more liquidity flows into Bitcoin, often from altcoin sales. On the daily chart, we’re still above an upward trendline I mentioned in previous analyses, and altcoins haven’t made any real moves. When I say “moves,” I mean serious 100-500% or even 10,000% rallies , not just 10-20% pops. An altseason would be confirmed by a break of this trendline and a drop below support at 60.27. That’s when we’d expect massive altcoin gains, but it only works if Bitcoin’s already in a strong uptrend with solid market liquidity. Otherwise, don’t expect crazy altcoin pumps. The total market cap needs to be growing too for this to happen.
💬 Let’s Talk!
If this recap sparked some ideas, give it a quick boost—it means a lot! 😊 Got a pair or setup you want me to tackle next? Drop it in the comments. Thanks for joining me at Skeptic Lab—let’s grow together with No FOMO. No hype. Just reason. Keep trading smart! <3✌️

Bullish Altcoins: Bitcoin Dominance In Correction ModeHere BTC.D is still moving within a classic ABC correction. The peak happened 7-May. After 14-May there was a bounce but this bounce ended in a lower high. The correction is not over.
As this index moves lower, the Altcoins market will grow.
When Bitcoin turns sideways, retraces or consolidates, it is an opportunity for the smaller Altcoins to move forward. This is the scenario we are entering right now.
» Bitcoin sideways. Altcoins bullish. Long-term growth.
The 2025 bull market is only starting now. Prepare for growth until late 2025 or beyond (early 2026).
Namaste.

WARNING! Sell Your Altcoins, -40% Drop AheadHello, Skyrexans!
The title of this article is made specially for haters. I see euphoria on each small drop of CRYPTOCAP:BTC.D and understand that altseason now will not happen. People are still holding and dreaming Lambos. This is very bad for potential growth, so I expect only dump on risky alts with the new dominance push!
Look at the 4h time frame. As you remember from my previous analysis I expect the global wave 5. In my opinion waves 1 and 2 have been finished already. Wave 2 represented as an irregular ABC correction. Target at 0.38 Fibonacci has been reached. Now it's time for wave 3 which will reach 67%. During this dump on altcoins I wanna see total disappointment of moon boys and selling on every local bounce. I will repeat once more, market shall be cleared from the crowd to go up.
I am not an altseason hater. I am also holding some altcoins, but it's important to understand the real picture and have the right exaltations. Otherwise you will be disappointed and go out from rocket. I wish for clever, patient and realistic people to earn on the altseason, but first of all market need to persuade greedy and disrespectful people to escape altcoins.
Best regards,
Ivan Skyrexio
___________________________________________________________
Please, boost this article and subscribe our page if you like analysis!

BTC DOMINANCE AT CRUCIAL LEVEL! When Alt season? 🚀 Hey Traders! 👋
If you’re finding value in this analysis, smash that 👍 and hit Follow for high-accuracy trade setups that actually deliver! 💹🔥
Bitcoin dominance is once again hovering around the key resistance zone (~64%) that previously triggered a sharp rejection and boosted altcoins. 🚨
🟢 What we're watching:
Dominance bounced back after a breakdown from the rising wedge 📉
It's now retesting the breakdown zone (red resistance)
A rejection here = Altcoin Rally 🎯
A clean breakout above = Altcoins stay weak ⚠️
⏳ We’re at a decision point. Altcoin bulls are watching this zone very closely.
🧠 Our take:
Until BTC.D rejects from this level, don’t expect a full-blown Altseason. A strong red candle from here could open the floodgates for mid and low caps to run wild again. 🚀
📌 Stay patient, stay positioned. The move will be big—just a matter of “when.”

BITCOIN DOMINANCE Update (12H)This analysis is an update of the analysis you see in the "Related publications" section
After hitting the two resistance lines marked on the chart (yellow circle), we saw a reaction, but it doesn’t seem like the trend has changed.
There’s a possibility that a double top could be forming on the dominance chart.
This suggests that selling pressure on altcoins may continue until this index approaches its peak zone.
For risk management, please don't forget stop loss and capital management
Comment if you have any questions
Thank You

Altseason Will NOT Start While You Are Holding Altcoins!Hello, Skyrexians!
Time for the negative article about CRYPTOCAP:BTC.D which is our favorite topic recently because I see now the euphoria again that altseason has been started. The answer is no, it has not and the main reason is the crowd which still holding altcoins. I told many times - sell altcoins and altseason will be started.
Let's go to Elliott waves. As I told you wave 4 has been finished at 0.38 Fibonacci level and with the Awesome Oscillator cross of the zero line. Now it's time for wave 5. Target is the same equals 67%. Only when we see this price and the double divergence we have a chance that liquidity will transfer from Bitcoin to altcoin. Next 2 weeks will be disaster for all altcoins holders.
Best regards,
Ivan Skyrexio
___________________________________________________________
Please, boost this article and subscribe our page if you like analysis!

Bitcoin Dominance Is Growing, But Don't Panic!Hello, Skyrexians!
When I shared last update on CRYPTOCAP:BTC.D I mentioned that not sure that altseason has been started, now I decided to go back to my first scenario where dominance shall reach 67%.
You can tell me that wave 4 shall be ABC shaped and now we will see dump to 61%, but dominance usually has the very sharp corrections, moreover 0.38 Fibonacci has been reached and Awesome Oscillator crossed zero line on 2 days time frame. Wave 4 is likely to be finished. Now wave 5 is going to the most likely target at 67%. This pump will be fast, may be in 1-2 weeks. Also wanna tell about disaster max target at 72%. This target is very very unlikely because it will break all picture on 1 week time frame, but also let's just keep in mind. This analysis perfectly correlates with ATOM analysis, which is also actual for all altcoins.
Best regards,
Ivan Skyrexio
___________________________________________________________
Please, boost this article and subscribe our page if you like analysis!

BTC DOMINANCE NEW UPDATE (1D)This analysis is an update of the analysis you see in the "Related publications" section
This upward move is in line with our previous plan and is meant to complete wave G.
Wave F didn’t touch the green zone exactly and reversed slightly higher due to market maker manipulations, which has made trading in these areas more difficult.
It is expected that from near the top, the price will drop to complete the larger wave F | which might come with a green and attractive market. Completing wave G, which we are currently in, will likely take several more days.
For risk management, please don't forget stop loss and capital management
Comment if you have any questions
Thank You

BTCDO Analysis | Catch the altseason! (12H)Note: This chart is tied to Bitcoin dominance and moves accordingly.
The trendlines have been lost, the price has dropped, and it has reached a support level. Such strong trends, when they come to an end, usually result in a pullback to the trendline or the broken levels.
Currently, the price may pullback to the supply zone and then enter another correction and drop, which could cause altcoins to turn green again.
Targets are marked on the chart.
A daily candle closing above the invalidation level will invalidate this analysis.
For risk management, please don't forget stop loss and capital management
Comment if you have any questions
Thank You

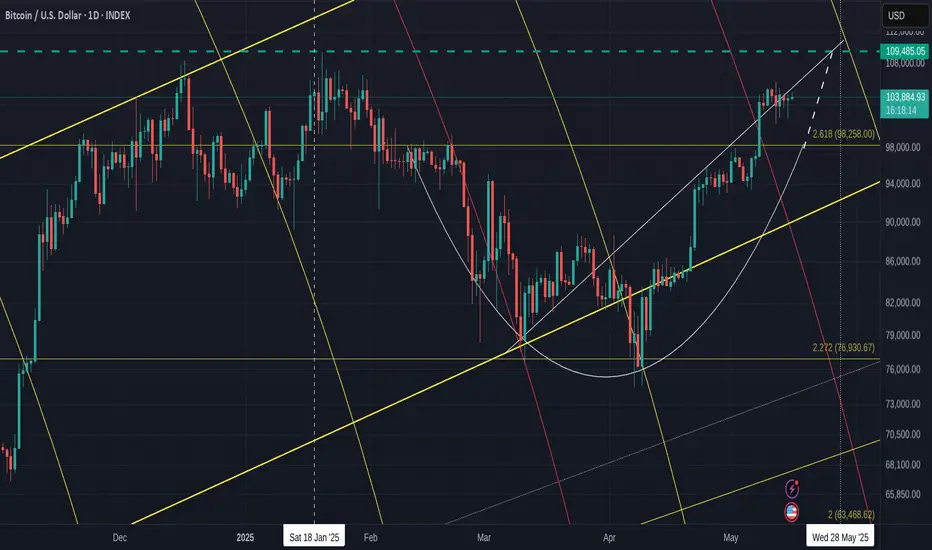
Comprehensive BITCOIN Analysis for the next 7 days - DAILY chart
First Off - Sorry for all the lines on the chart but EVERY one is very relevant to what is happening right now.
The Dashed Blue Horizontal line is the current ATH line. possible Resistance.
The 2.618 Fib extension has not yet been tested as support. This could happen still, at any point till end of month and is around the 98K usd zone.
PA has Ranged through the Local rising line of support, as if it no longer existed, which was a little surprising given the strength that PA has still. There maybe some uncertainty in the air.
PA is above the neckline of the Cup pattern it printed and, again, it would not be unusual to see PA come back down to test this Neckline as support, which is on that 2.618 Fib extension.
The Bold Yellow line is Long Term Support line since 2015, showing that Bitcoin PA is in the Lower side of a Long Term ascending channel, with plenty of room to rise,
PA has a lot of inert strength right now, so, we may not see this retest happen.
We just have to wait.
BUT you can see that Rising dashed line, the extension of the Cup pattern.
PA may range across into this and bump into it next week. If it acts as support again, PA will then be pushed into a tight Squeeze against the other rising line of support, with an Apex on the current ATH line.
PA ALWAYS REACTS BEFORE THE APEX
All that points towards some Volatile times next week if PA remains in this area.
The other descending line there is a 618 Fib Circle. You can see that 98% of the Time, PA is effected by these.
All this shows us 4 points of resistance, in the same Zone, All Next week and PA will Either Shoot through it with a Big push, Or we may see PA Drop back down. The Big question being, how Far ?
We do not want to loose the 2.618 Fib ext at 98K
But what else can we look at. ?
The RSI DAILY
This is still up high in the near Over Bought zone. It can range up here for extended periods but this is something we should be aware of as the possibility of a drop does exist.
On the weekly, RSI has room to move higher & the 4 hour is in neutral zone, again with ability to push higher.
The MACD DAILY
This is once again curling over and about to test the red signal line as support.
On a 4 hour chart, the MACD is down on Neutral line, giving it strength to push higher and if that continues, we will see the yellow MACD line bounce off the Red signal line on the Daily chart.
Once again, Look at the Histogram and the similarity to the area that the Arrow is pointing at.
We could repeat this but on a larger scale. We have to wait and see if this happens.
But also note how there was a Visit into a red Histogram ( for 4 days ) before the bigger push and I remind you about what has been said above.
So, what else can we look at that may offer some ideas ?
The Chart below is the 4 main Crypto Dominance charts by market Cap - 4 hour
BTC.D - ETH.D
OTHERS.D - USDT.D
( OTHERS = Top 125 Coins MINUS Top 10 by Market Cap) Mid to Low cap
We have recently seen a Drop in Bitcoin dominance, giving the ALTS some time to push higher. This is seen with the BTC.D dropping and the ETH.D and OTHERS.D rising
Also note how USDT.D Dropped, showing that stable coins were being exchanged for Crypto,
And as we see now, we have the possibility of BTC.D being rejected by its 50 SMA ( Red)
ETH.D is above its 50 SMA, showing it had a good push and may get support if PA drops
OTHERS.D has already fallen below its 50 SMA, showing a brutal sell off, rapid profit taking.
That is the world of ALTS.
In the last 48 hours, we saw a return for Bitcoin as it rose from a shallow Low in its Range. This was enough to cause a sell off of the ALT coins as we see in the Drop in Others.D
ETH however, remains in a range with obvious intention to continue higher if the market allows.
Lastly, we can compare Bitcoin to the other Markets
Bitcoin - CFD GOLD
DXY - S&P500
Bitcoin has performed well. It has reclaimed some position on Gold recently while it climbed alongside the S&P
We can also see how BTC climbed while DXY dropped.
This highlights some Flaws in using the BTC USD pair to judge the success of BTC but this is explaned better in another post. But in short, If the $ looses Value and your BTC USD pair appears to climb, theg ain is lost as the $ is worth less.
Use BTC XAUT pairs. Bitcoin Gold Pair - Historically, GOLD looses little Value by comparison. So when Bitcoin gains against Gold..It is WIN WIN
So, in conclusion, we see Bitcoin under some pressure to avoid Lower or sharper Drop in the short tern.
The Lower Timeframes show us that BTC has the ability for a Continued Range but with caution.
We see ETH ( and larger Alts ) intent on remain in the game now they have had a small glimpse of Gains
And we see that Mid and Lower Cap Alts are mostly just money makers providing you play the game right. And that game may have some more time if Bitcoin Stumbles in the next 7 days.
And that possibility does exist.
Today is crucial in many ways and will set the tone for the following week.
There is Financial Data being released by the USA today and if unfavourable, we may see some sharp moves.
And ,Longer Term VERY BULLISH - I HOLD AND CONTINUE TO BUY WHEN I CAN ON SPOT ORDERS
I hope this helps and I am grateful for comments
Bitcoin Dominance Double Resistance – Altcoin Breakout Ahead?Bitcoin Dominance Double Resistance – Altcoin Breakout Ahead?
Post with Emojis:
📊🚀 Bitcoin Dominance Double Resistance – Altcoin Breakout Ahead? 🌈📉
Hey Traders!
BTC Dominance just hit a critical confluence of resistance at the top of the ascending channel (62.82% to 63.53%) and is already showing early signs of rejection. History tells us this zone doesn’t hold for long—check the left side of the chart for past failures!
📚 What This Means:
If dominance rolls over here, expect altcoins to finally break free and start outperforming. 🌱
Watch for a key breakdown below 62.32% to officially kick off the next wave of altcoin dominance.
Targets for dominance on the downside: 59%, 56.9%, and possibly even 54% over the coming weeks.
📈 Probability Outlook:
✅ 70% chance BTC dominance gets rejected—altcoin rally ahead! 🚀
❌ 30% chance dominance breaks higher—remain cautious on alts.
This is the moment we’ve been waiting for. Altseason isn’t declared yet—but the gates might just be opening!
One Love,
The FXPROFESSOR 💙

Having a Mini ALT pump -but it may not last much Longer -CAUTION
The main chart is the Daily BTC PA and the BTC DOMINANCE ( BTC.D ) super imposed below, for the same period.
When BTC.D Drops and BTC PA remains stable, we see ALTS increase in Value, Mostly.
On the main chart, you can see that in Nov 2024, Till Dec, we had a mini ALT seasons and we are having another now
But will this last ?
If we look in more detail at the BTC.D chart below, we can get some ideas
Will it Last ? I do not think so.
We are on two areas of strong support right now.
The 618 Fib extension has provided support already and PA bounced. In fact, at time of writing, Many ALTS are in the RED on an hour chart. We need to watch and see where we go in the next 7 hours
Should this Fib extension Fail, Just below is a longer term line of support.
SO, I would head towards a High rate of Caution with the ALTS right now.
Does this mean that Bitcon will push higher ?
The potential is there, YES
High Level of Caution for th eALTS right now

Altseason Has Been Started (But I Am Not Sure...)Hello, Skyrexans!
Let's carefully make update on CRYPTOCAP:BTC.D because previous analysis where I bet for local top slightly above 65% is playing out even stronger than I supposed. Today I will show you why altseason could be already started, why I am not sure and where is the critical level.
Earlier I told that daily time frame does not suit for this Elliott waves cycle measurement, but we have 155 bars there, slightly above 140 bars, so we can count it as a valid. Moreover we can see zero line cross on Awesome Oscillator, but again only slightly. That's why I am not sure if uptrend on dominance is over or we shall wait for earlier predicted wave to 67%. But anyway I am sure that 60-61% will be reached before, so it was not a mistake to be in altcoins from 65.3%. When price will reach Fibonacci level we will see how it will approach it and make a decision about our altcoin's holdings.
Best regards,
Ivan Skyrexio
___________________________________________________________
Please, boost this article and subscribe our page if you like analysis!

BTC Dominance New Update (12H)This analysis is an update of the analysis you see in the "Related publications" section
We had a bullish diametric for Bitcoin, and it seems that the price has reached the highest point of this diametric. Wave E of this diametric, which is a bullish wave, is nearing its end.
We refer to this as the highest point because Wave G might not reach the peak of Wave E.
We expect a rejection from the red box, and this rejection could be very strong. Smaller altcoins could experience a significant pump.
A daily candle closing above the invalidation level would invalidate this analysis.
For risk management, please don't forget stop loss and capital management
Comment if you have any questions
Thank You

Bitcoin Dominance TA, Bearish SignalsRecently I spotted a very strong, long-term bearish signal on this index. A triple-bearish signal as it is present with three indicators. I am talking about a bearish divergence.
Volume has been dropping significantly as the index moves higher.
The weekly RSI peaked October 2023 and has been producing lower highs. The MACD peaked July 2023.
These are long-term, but let's have a closer look and consider the daily chart.
Here we have some interesting signals as well, let's start with the candles:
—Here we have a rising wedge ending in a rounded top and long-term double-top. The uptrend is also in risk of failing. A breakdown of this uptrend, which can happen anytime, would result in a strong crash of this index.
Next is the daily RSI:
—The peak happened November 2024. There is also a short-term lower high as the peak this month happened on the 7th of April, the index peaked on the 22nd.
—The daily RSI is already trending lower.
Clearly the most interesting and revealing of all three indicators is the daily MACD. Let me show you the chart first and then I'll describe the signals:
—Here the lower high is so strong that reveals what is coming to this index. The MACD peaked in February and produced a lower high this month, April. Notice the bearish cross, it happened yesterday.
The daily MACD and RSI trending down with short-term, mid-term, long-term and long long-term bearish divergence all point towards a lower reading on these oscillators.
The last major drop for this index happened in November 2024 with the bottom hitting a month later, December 2024. At this time Bitcoin produced a very strong advance as well as the entire Altcoins market, it was awesome.
It is surely interesting to notice that the index recovers and moves higher while Bitcoin continued to grow. But at that time the Altcoins were starting their correction. Most of the Altcoins peaked late November 2024 and some in early December 2024. So this index is more related to how the Altcoins behave rather than Bitcoin.
When it drops, it does not mean that Bitcoin will drop but that the Altcoins will grow. When it grows, it does not necessarily means that Bitcoin is moving up but that the Altcoins are moving down.
We know the Altcoins are set to produce their strongest growth period since 2021. This Bitcoin Dominance index works as confirmation. It leaves no room for doubt.
» Doubt can remain open as to whether the start of this rise will happen tomorrow or within a few weeks. Short-term, anything goes; the market can become erratic and produce some strong shakeouts, specially preceding a major wave of growth. But after 2-3 weeks, it is 1,000% certain that the entire Cryptocurrency market will be bullish and up. Regardless of what this index does or anything else for that matter. When the time is ripe, the market grows.
The time is ripe right now... You will be happy with the results.
Namaste.

BTC Dominance at Crucial Support– Altseason Incoming OR Ending? 📊🚀 Bitcoin Dominance at Crucial Support – Altseason Incoming? 🌈💰
If you’re wondering why I’ve been focused on BTC more than altcoins recently, this is exactly why! Dominance plays a critical role in understanding market cycles and timing those explosive alt moves.
📚 Quick Recap:
BTC dominance reflects Bitcoin’s market share versus altcoins.
Historically, altcoin bull runs often begin when BTC dominance tops out and reverses.
The last big altseasons kicked off from the 73% dominance zone—but remember, history doesn’t always repeat, it often rhymes!
🔎 Current Chart Observations:
BTC dominance is currently testing support at 63.41% within an ascending channel.
Resistance sits at 64.25%.
The dominance is flirting with re-entering the channel, but hasn’t confirmed yet.
📈 Probability Outlook:
✅ 62% chance BTC dominance breaks down—bullish for altcoins!
❌ 38% chance dominance holds and moves higher—bearish for altcoins.
If BTC dominance breaks down from this level, it won’t just be a red candle—it’ll be a flashing green light for altcoins! 🚦📈
Mastering these cycles is crucial if you want to position yourself properly ahead of the next big alt moves.
One Love,
The FXPROFESSOR 💙

Bitcoin Dominance: Don't Be So OptimisticHello, Skyrexians!
My previous CRYPTOCAP:BTC.D forecast now is playing out well. I bet for the reaching 65.35% before drop, we have seen 65.5% which is almost the same. Now dominance is dumping, but I warned you it's not the end. Now I will give you small update.
I will not cover higher degree waves, you can check previous articles, let's cover only this Elliott waves cycle. The wave 3 now is finished slightly above the 1.61 Fibonacci level and now is printing wave 4, to make sure that wave 4 is finished we want to see the Awesome Oscillator zero line cross and reaching the target area next to 63.5%. After that I expect wave 5, it's not going to be extended because wave 3 is extended, so, the target is 65.5% again to retest. After that we can wait for bigger correction to 61%.
Best regards,
Ivan Skyrexio
___________________________________________________________
Please, boost this article and subscribe our page if you like analysis!

A Table to show you Money Flow when BITCOIN DOMIANCE MOVES
A Simple Rule of Thumb can be followed when BITCOIN DOMINANCE moves up or down and it can save you a fortune if you use it properly.
BTC.D - BTC - ALTS
increase - increase - Decrease
increase - Decrease - Decrease Rapid
increase - Stable - Stable
Decrease - Increase - Increase Rapid
Decrease - Decrease - Decrease / Stable
Decrease - Stable - Increase
Currently we are seeing BTC.D Decreasing and yet the BITCOIN Price in Increasing and ALTS are INCREASING
Tjhis is Great BUT you need to watch BTC.D like a Hawk now because when that changes and begind to rise again, as it will do one day, maybe soon maybe in a month....then the likly hood of ALTS dropping Quickly is high
Bitcoin is now in heavy resistance and pushing through.
Pay attention to how long it can do that
The table above is your Saviour
