BITCOIN: LAST SUPPORT AREA + HEAD AND SHOULDERS PATTERN.Bitcoin seems still in bearish scenario as you can see at Timeframe 4 Hour, show head and shoulders pattern (bearish) and bitcoin failed to break EMA 200 at Timeframe 1 Day.
The last support area around 39812 - 41183 price. You can take short position and take profit there with stop loss around 49355.
Watch your money management and do your own research before trading.
If break it will be bearish season.
Look my previous ideas here:
note: only take position after confirmation and do your own research before trading.
Bitcoindominance

BTC Dominance - Why alts dumping was predictable... 🙄If you studied the BTC dominance chart you knew that the 40% market share for BTC was a key support.
Once hit, there was only one result... altcoins will bleed and now they are all in double digits red.
Bitcoin dominance has bounced of the support and now is moving higher. Yes, BTC price is also falling, but not as fast... hence BTC is gaining in market dominance.
This is usually the worst outcome in the market, where everyone loses. Just that BTC holders suffer less.
However, this dump is... uncharacteristically slow. We seem to go lower bit by bit... This is either a massive bear trap and we PUMP hard soon or the market will continue to bleed slowly until it finds equilibrium again.
There is no flash crash, no news, just... money exiting. So long BTC/ETH don't make a lower low, there is till hopium. If not, goblin town welcomes you.
Like and follow if you liked my idea!

Declining Bitcoin DominanceAs the crypto market matures, Bitcoin dominance decreases.
This is a positive development for the overall market as blockchain entities distance themselves from Bitcoin's influence.

BTC.D broke out descending resistance#BTCD
Bitcoin Dominance broke out descending resistance as I expected and probably it can rise more to resistance zone. this rise of dominance can cause drop in price of #BTC.
but also $BTC price is at strong support that can hold it.
lets see what will happen in coming days.
🐻🐮

BTC Dominance: Alt Season Coming!Hello friends, today you can review the technical analysis on a 1W linear scale line chart for the Bitcoin Dominance. I generally look at candlestick charts, but for presentation purposes, a line chart is used.
1) The BTC Dominance has been respecting a Parallel Channel since the May 2021 crypto market correction.
2) Also there is a Bear Flag Pattern that has formed in the charts. This pattern's target is usually the length of the flag staff.
3) Since the RSI (relative strength index) recently broke a key support line, it may go back up to re-test the trendline before falling further.
4) With the potential increase in RSI, the Bitcoin Dominance may go up as well before a drop down.
5) If the Bitcoin Dominance falls to the target, it could result in potentially the biggest Altcoin Season.
6) If Bitcoin Dominance breakout above the Parallel Channel, it could invalidate this idea.
7) This is a weekly chart so don't expect anything to happen quickly.
If you enjoy my ideas, feel free to like it and drop in a comment. I love reading your comments below.
As the year is coming to an end and holidays are almost here. I want to wish my friends Happy Holidays and ready for an exciting 2022! What are your thoughts for the coming year?
Disclosure: This is just my opinion and not any type of financial advice. I enjoy charting and discussing technical analysis. Don't trade based on my advice. Do your own research! #cryptopickk

bitcoin dominance chart analysisyou can see from these charts that money is moving to bitcoin, slow but steady movement, and all moving averages are in opposite order, this is the best place to buy and wait for moving average crosses, we will see hard bumps from here and after, i would not mind a wick downward, but bearish is not an option anymore, bitcoin is about to explode

What If the Bitcoin Dominance drop same as what previously donein this chart we are just comparing the slope and possible potentials of what happen historically.
2017 we had 2 altseason and a pause in between
early 2021 we had a kind of altseason for some coins and we are looking to complete one season and we already has a pause phase.
as it seems the power of alts increasing I just reviewed the possibility of what happened in whole (2altseasons) last cycle and this cycle (whatever we already experienced in BTC.D

Bitcoin Dominance in DAILY TimeframeHere's a very simple price action analysis for bitcoin dominance.
As you can see dominance can hit the support level 39 or around it and then the dominance can rise up to 44 and maybe to around 47-48 which we can see a price up for bitcoin.
Beware of ALTCOINS!
ps,I have been hearing about altseason as well which i find unlikely to happen.
We will see the growth of altcoins for a time as you can see on dominance but NOT an altseason for now.

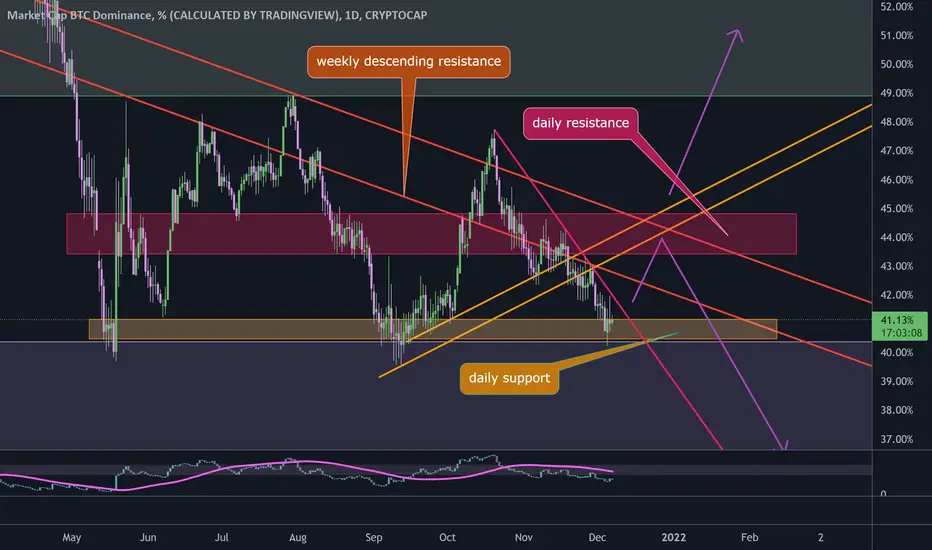
BTC.D at support zone#BTCD
Bitcoin Dominance is at daily support zone and struggle to break it down.
also it is near a daily descending resistance, if dominance hold the support and breaking this resistance, it will lead upward to daily resistance zone, which is the same with weekly descending resistance and ascending resistance that can reject the dominance to break the support stronger.
bitcon dominanceif dominance go lower than green zone alt season will start...altseason is comming...

Bitcoin dominance is falling despite market crashThis is an interesting development of the Bitcoin dominance considering that the markets were all crashing. In the past most crashing events led to a sharp rise of the Bitcoin dominance while Altcoins were dropping much harder in comparison to Bitcoin. Seeing this could actually mean that we will see a break-out to the downside of the 40% range soon that could lead us to 30-35% levels once momentum is picking up. Generally, one should still be careful trading this setup as markets are reacting strongly to Evergrande's potential defaulting & the sharp rise in cases of the omnicron variant.
Good luck with your trades! Do not consider this as financial advice.

Bitcoin Dominance ProjectionBitcoin influence continues to decline as the market matures.
Expected behavior.
Alts are detaching.

Bitcoin Dominance is about to go high again!Bitcoin dominance could easily bounce back up and this would cause major drops on all altcoins that recently made x100 and more.
I expect bitcoin correction while altcoins keep falling finding their new bottom.
Bitcoin dominance could easily be restored to 65% - 70% of all crypto market cap by the year 2023.
Expect many coins at their new bottom.
One of the greatest falls I expect on Dogecoin down to $0.005, which means it could drop down to 99.3% from its ATH.
Prepare to face the reality, I'm buying popcorn and start watching :)

Bitcoin Correction Same Like My Analysis. Where is Reversal?Bitcoin correction same like my analysis. Here is the strong support to reversal.
Bitcoin correction finally touch Fibonacci area 0.618 (51627.94) and touch the strong support area around 51k-53k.
It indicate the support and reversal. Bitcoin need to make higher low and fill the gap that's why there is correction there.
Wait for break out to take long position.
Look my previous ideas here:
note: do your own research before trading.

Daily Crypto Market Update - Ethereum Looking Strong! 💪💪💪In this video:
* A rundown of market conditions in the crypto space
* What is looking strong and what is looking weak
* Ethereum looking strong
* Some clues to good entry areas on various altcoins are given

BITCOIN NOT YET SAFEEven though there is pullback but bitcoin not yet safe to take position cause bitcoin still trying to retest EMA 50 TF1D and EMA 300 TF4H.
Wait until break out it will be good sign. The decision is yours.

BTC.D Further Thoughts1,2,3 down
Mostly all contained within the downward channel
If this is the scenario that plays out, alt coins will be massive !
Below is an idea "super alt season" check it out, very similar to this one

BTC.D broke down ascending support#BTCD
Bitcoin Dominance broke down from ascending support zone, but here is another support that possible to reject it and head up to break the weekly descending resistance.
but if BTC.D success to break down from daily support zone. then drop to around 35 will be easy.

Bitcoin Dominance Ready to Drop!!?Once again we are discussing the very important BTC dominance, the reason of why this is being brought up over and over by myself is due to the fact that this is the best indication of where the market is headed and most importantly where the altcoins are headed. If we continue to see drops in Bitcoin dominance each drop is going to significantly boost the altcoins, keep in mind that Bitcoin is likely to drop if we see a spike down in dominance in turn bringing the alts down with it, but heres the catch.. initially the alts will bleed along with BTC but once we see a settle and catch support for BTC the altcoins will be primed to breakout and rally to the upside. we have broken through the 42.62% support level and we will need to hold under here for our daily close and we are coming up on our next support at 42.36%, a decent support level with some strength, but what im seeing right now could be pose a big threat to this support level which is exactly what we want, and that is, the bollinger bands. As you guys probably know by now grabbing onto the bottom band can trigger an explosive move to the downside. Our current price levels are resting right on that bottom band and as we head into our daily close this could be huge for altcoins, a close ontop of this bottom band opens up the door for continued red candles that will likely push down in a vertical manner in turn shredding through most support levels we are currently facing. The RSI has been rejected off of longer term downtrend resistance, we are now heading for the further downside and the very bottom zone, this resistance level poses a threat to the RSI as it is very strong and could definitely give the RSI a lot of problems when we try and break it at a later point. Overall this is very good aswell though and the main thing is that we are continuing to cruise around in the bottom half of the zone underneath the midline, being under the midline puts us in a confirmed downtrend scenario that could go on for quite some time, and downtrend in BTC.D equals explosive moves for the alts. Now the MACD, i have it zoomed in pretty far so we can get an accurate read but we just recently had a bearish cross which is a good sign and we are seeing day after day increased red bars on the histogram giving momentum to the bears, our MA's are looking good off the bat we are seeing good separation and we want to continue to see this play out as itll get harder and harder to get a bullish cross. Not financial advice just my opinion!

#Bitcoin dominance - update Drew a rough roadmap of the Bitcoin dominance a month ago
The structure is looking quite good for a breakdown
so a run for the #altcoins seems imminent.

BITCOIN DOMINANCE EXPLAINEDTo be successful in crypto you need to know how the market works and why it’s behaving like it is.
Bitcoin is the first ever cryptocurrency and will be the biggest a long time. This means that what bitcoin does will have a large impact on the market. But there are also times where every coin does it’s own thing.
Here is where Btc.d comes in.
Simply put, when bitcoin dominance is high, it means that almost every move is similar in the whole market. While when it’s low, we don’t need to worry too much about what bitcoin is doing if we see a good trade in some other coin.
We can take advantage of this!
Btc.d is surprisingly accurate with technical analysis. In the chart you can see two boxes where I would either buy bitcoin or altcoins.
You still have to find good setups and everything, but it gives a good indication of it’s either altcoins or bitcoins time to shine!
Good luck traders! Leave a like if you found this helpful <3

BTC Dominance - 2017 vs CurrentBitcoin Dominance charts are shown with the left being the current market and the right being the 2017 market.
Could we be playing out a similar BTC dominance but with a longer cycle?
The upcoming days will tell if this is true or not. I thought it was interesting to share with the community.
What are your opinions on this? Comment below, hit the like and follow me. Thank you!
Check out more below for recent Altcoin, Bitcoin and Stock Ideas.
Disclosure: This is just my opinion and not any type of financial advice. I enjoy charting and discussing technical analysis . Don't trade based on my advice. Do your own research! #cryptopickk #bitcoin #altcoins

BTC Dominance - A Nasty Retest? A retest of this level, previously seen as a strong resistance, provides a nice support if BTCDOM were to turn in favor of altcoins
I have tried to demonstrate this with 1-2-3-4 pattern
BTCDOMINANCE is slowly turning around, very slowly
The above chart contradicts this chart, suggesting the recovery will occur sooner
