How to Use the Bitcoin Dominance Chart to Maximize ProfitsIn this post, I'll be explaining a simple approach to the cryptocurrency market, and how you can refer to the Bitcoin Dominance Chart (BTC.D) to maximize profits.
Disclaimer: This is not investment advice. This is for educational and entertainment purposes only. I am not responsible for the profits or loss generated from your investments. Trade and invest at your own risk.
Bitcoin Dominance (BTC.D)
- Bitcoin Dominance is simply an indicator that demonstrates the percentage of Bitcoin's market cap relative to the entire market cap.
- When Bitcoin dominance is high, it indicates that Bitcoin's market cap is relatively larger compared to that of other altcoins, and vice versa.
- So when Bitcoin dominance rises, it could either indicate that:
- Bitcoin is rising at a faster pace than altcoins (during an uptrend)
- Altcoins are correcting at a faster pace than Bitcoin (during a downtrend).
- Vice versa, a drop in Bitcoin dominance could indicate that:
- Bitcoin is dropping at a faster pace than altcoins (during a downtrend)
- Or that altcoins are rising at a faster pace than Bitcoin (during an uptrend).
- Understanding this, you can refer to the Bitcoin dominance chart to rebalance your portfolio according to market situations.
Historical Price Action
- Above, I've marked Bitcoin's price action (black), relative to that of ETH (blue), which represents the overall altcoin market.
- The captions in the chart best explain the logic behind the price action, and how dominance is affected by it.
- What's important to understand is that the situation is relative: a high dominance does not necessarily indicate that buying altcoins is a good idea.
- It's important to understand the overall market cycle and structure to determine which regions are good entries.
Anatomy of a Market Cycle
- Above, we have the market cycle explained using Elliott Waves.
- The market never moves in straight lines: It goes through phases of impulse waves, and corrective waves.
- Elliott Waves also have very strict rules that must be kept.
- Or else, the wave count is considered negated.
- Here are the rules:
- Waves 1,3 and 5 are always with the trend
- Waves 2,4 are always against the trend
- Wave 2 can never drop below wave 1’s low
- Wave 3 can never be the smallest wave
- Wave 4 can never drop into the range of wave 2 (unless it is part of a diagonal)
- With this in mind, we can now take a look at where Bitcoin is, from the larger wave count.
Bitcoin Market Cycle using Elliott Waves
- We can start counting the wave from $3.1k, when Bitcoin bottomed out around the end of 2018
- Based on this wave count, it could be said that the move up to $64k was the end of the 3rd impulse wave.
- We have recently completed the 4th corrective wave, and are on our way to complete the 5th impulse wave.
- As to why I have selected the $200k region and June 2022 as my price and time period target, please refer to my previous analysis below:
Conclusion
Bitcoin dominance is currently forming a double bottom on the weekly. With Bitcoin's wave count lining up for an impulse move upwards, I expect Bitcoin to rally upwards, outperforming other altcoins in the short-mid term. As Bitcoin paves way for the entire crypto market cap by breaking through all time high levels in Q4, we could see Bitcoin dominance reach resistance around the 60-70% range. At that point, given that the broader market cycle isn't over, it would be a good point adjust your portfolio, and scale profits from Bitcoin into altcoins for maximum returns.
If you like this educational post, please make sure to like, and follow for more quality content!
If you have any questions or comments, feel free to comment below! :)
Bitcoindominance

#Bitcoin #Dominance ideaIf bearish pennant pattern plays out well, the we can have good rally on #altcoins.
We will wait to see if it breaks down or not.
$BTC #dominance #analysis
NFA

USDT.D Chart update#USDT.D 4H Chart update
USDT.D has been moving in a downtrend on both HTF and LTF.
However, it currently broke out from the descending channel on LTF where it could be reaching 3.01% before moving down again. However, if it breaks through that level, we would be expecting a rejection from the 4h breaker else it would be breaking previous highs on HTF that could result in bullish moves which is not expected.
--------------------------------------------
Best Regards, Reda Souhail™

#Bitcoin Dominance to 30These levels were something I've been looking at for most of the year
Ever since since Bitcoin was up in the 70's!
Been hell helluva ride!!
Final push now!!!

Alts pump next!#BTC.D massively pushed to the upside enters its major resistance area of 44.01% - 44.37%.
#alts should dump hard but #BTC move compensated that.
We have a good chance that #Dominance will fall from here which tends to rise in alts, if #BTC stables above $50,000
--------------------------------------------
Best Regards, Reda Souhail™

BITCOIN DOMINANCE PUMPING! BE CAREFUL WITH YOUR ALTS/BTC PAIR!Hello everyone, if you like the idea, do not forget to support with a like and follow. Welcome to this important update on Bitcoin dominance. As you know when bitcoin dominance bouncing Alts dump hard especially in BTC pair.
In my previous update of bitcoin dominance, I clearly mention that dominance is going to bounce from 42 levels so book profit in your Alts. Hope you listened and took the necessary steps. So what now? Is this a good time to enter in Alts again?
Let's get to the chart first. Currently, Bitcoin dominance hovering at above 44 levels and there is some resistance at this level. If we break this resistance then the next resistance is at around 48 levels. It is highly likely that we see a rejection from that level. If we break the 48 level resistance then things get very ugly for altcoins but IMO we may see a rejection from the 48 levels.
Right now I recommend do not take entries in Alts. Wait for the right moment and keep a close eye on resistance levels. If there is any change in the plan then I'll update you.
The last time Bitcoin dominance bounced from the 40 levels. It's very strong support. If we somehow manage to break the 40 levels then we see the greatest Altseason of history.
What do you think about that?
Do you also think that we may see the biggest Altseason?
If you like this idea then do support it with your likes and follow.
Also, share your views in the comment section.
This isn't financial advice. DYOR before investing.
Thank you!

BTC.D head up to weekly resistance#BTCD
Bitcoin Dominance is heading up as I thought, so it will going to touch the weekly resistance, if this resistance reject it, then fall down to the long term support.

WHY 100% bull market? Let me show you EGLD, BTC.D & more (PT.1)In this first video, I'm going to show you why we are 100% in a bull market and why altcoins are going parabolic in October and maybe early november.
It's easy:
- look at the overall structure of the charts
- look at the moving and exponential moving averages daily crossing
- look at the weekly charts
Also, I'm speaking about a new scenario when it comes to the bull market which I called "the DOLLAR scenario". It will be discussed in Pt.2

🚀 Bad News, Good NewsChina bans (once again) crypto activities, and only news outlets seem to care about it.
A positive reaction to bad news is one of the most bullish signals experienced investors wait for to assess the market's mood. You could argue that China's FUD is now almost no news anymore, but it can always represent a new opportunity for speculators to push the market lower.
The market barely reacted to the news, and it remains in pause mode before moving to the next phase. Looking at the broader picture, you can see how the market moves in cycles, which last on average two to three months.
The chart shows how Bitcoin's price (orange line) and dominance (blue line) evolved over the last year. By combining both trends, you can evaluate how to optimise your portfolio allocation and what strategies could work better in the next couple of months.
Should the sequence of market phases start back from October 2020, Altcoins may significantly underperform Bitcoin. In perspective terms, Bitcoin Dominance is currently sitting at record lows, which validates, even more, this thesis.
Time will tell, meanwhile better adopt a flexible approach and be ready to handle the next chapter.

bitcoin dominanceI think Altcoins should be avoided for a while
Bitcoin dominance is bullish
It is better to just invest in bitcoin
Altcoins will have a chance to enter later

BTC Dominance Hidden Bearish Divergence Update!Taking a look back at our Bitcoin dominance hidden bearish divergence things are starting to play out just like we would want, this strong pattern indicates a continuation in trend and we are clearly in a strong downtrend, this is very positive for altcoins especially as dominance falls Bitcoin will have less of a grip on the market and this can and usually always leads explosive upwards movement for the alts. Now keep in mind if we do see a hard crash in dominance this could trigger an initial fall in BTC (which likely will bleed into the rest of the market) but once we find some footing we can expect altcoins to start going on some massive runs! Please feel free to refer back to my last TA to learn and see exactly whats involved with this hidden bearish divergence pattern! We are currently still trading within the bearish pennant and we are seeing what looks like a bearish transition candle but we have to wait till daily close to get that confirmation, as we approach the apex or end of this pennant we want to see a trickle downwards and a breakout to the downside which historically is very likely to be the case. Looking at the RSI last time i was talking about a likely rejection off the midline or slightly above it and we are seeing that play out perfectly, and is actually a good sign and indication these TA's are playing out, we want to see Bitcoins dominance stay in a confirmed downtrend with the RSI below the midline as shown over the past month on the RSI. The Stoch RSI aswell, since we already got 2 confirmations on the stoch RSI of the hidden bearish divergence it is a very good sign we are seeing a bearish cross and a fall out of the overbought area which directly correlates with PA, we want to see some separation in the blue and orange and to see a clear downwards projection coming from the blue, both the RSI and Stoch RSI are strengthening this call and making it more and more likely we are going to see this play out just like i've been saying. Now a new indicator to this series of TA's, the bollinger bands, we are seeing squeezing in the bands which shows volatility shrinking and indicates an explosive move looming, now the problem is it doesn't give a hint of which way but thats exactly why we are using other indicators and patterns, there is a much higher chance of us having a huge breakout to the downside rather than upside and thats due to all the facts i have been talking about in this TA like the Bearish pennant, hidden bearish divergence pattern, the start of a fall from the stoch RSI & RSI and also what looks like a return to a confirmed downtrend on the RSI, all of things point to something very clear, a looming drop in bitcoin dominance and remember that if we do see this crash its likely the market will feel the impact but afterwards we can expect altcoins to have some serious mega gains! Not financial advice just my opinion!!

Is evergrande enough to stop the bullrunBitcoin 2021-2022 100k target is still intact. By december if the price dont break 60k then its over :)

BTCD up trend#BTCD
Bitcoin Dominance is still bullish to me.
BTC.D broke out from upper line of triangle in 4h time frame. so I think it is going to touch the daily resistance zone in coming days or weeks.

BTCD accumulation #BTCD
in my point of view Bitcoin Dominance will accumulate and a very slow upgoing to touch the weekly resistance line where it is cross the daily resistance zone. then will drop to break the long term support strongly.

Crypto Market Daily OutlookBitcoin Dominance is testing the trendline and bouncing from there.
Bitcoin Dominance is still bullish and with BTC high volatility we see more blood in alts market.
Dominance will go to 44% levels in the next couple of weeks.
The major support is 40% and breaks below will lead to a good rally in altcoins.
Market gainers are currently much bigger than losers and volume has picked up dramatically for this to be a Sunday trading session.
ETH and ADA remains the highest volume pairs and we’re likely seeing a weekly close push in the next few hours.
Get ready for it.
--------------------------------------------
Best Regards, Reda Souhail™

Down Trend fake break out- Be careful guys , down trend still not broken...
- it has done like this before..
- It may go down harder in this..
- We still have big chance for Alt season on October fingers crossed.

Bitcoin Dominance is again moving higherDominance is again moving higher, the market tried to shift its market structure.
Now #BTC is dumping and #Bitcoin Dominance is also moving higher
A high of 42.13% should be a sign of a fall in #BTC.D.
Best Regards, Reda Souhail™

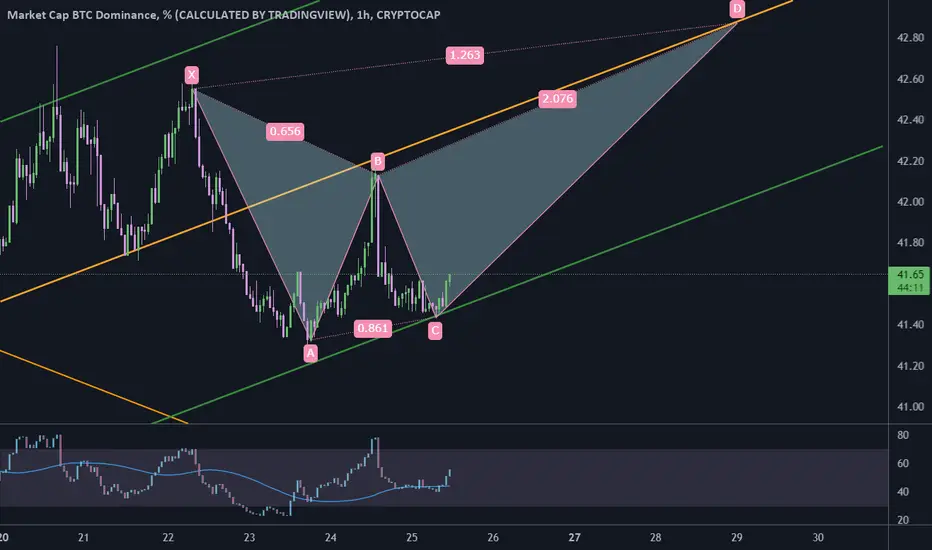
BTCD butterfly pattern#BTCD
Bitcoin Dominance in 1h time frame, rejected from middle line of parallel channel and now it seems to going to shape a butterfly pattern.
for completing this pattern it should go up the touch the middle line again around 42 or 43.
Bitcoin Dominance - Double Tops or Double Bottoms?I see two possible directions from here, green arrows up or red arrows down to same ATL or a new ATL and then green arrows up. Red arrows down gives us a short lived altseason (weeks), unless we get below 30s and then we could last a bit longer. Or, we get a double bottom right now and BTC starts to gain its dominance back quickly.

Bitcoin Dominance BTC.D - Descending channel- This is my technical analysis for BTC.D - as you can see, we are currently breaking out of the descending channel.
- For expected duration of the trade, probability, stop loss, profit target, entry price and risk to reward ratio (RRR) - please check my signature below ↓
- If you want to see more of these ideas, hit "Like" & "Follow"!

BTC.D broke down middle line of channel#BTCD
Bitcoin dominance broke down from middle line of a parallel channel, and I think it has to fall more to touch the lower line.
that help bitcoin touch the upper line of ascending parallel channel.
also it is possible that BTC.D fall more to long term support zone again, and touch the long term descending support line. then start a rally, that may have cause the drop of bitcoin.

Time to sell altcoins 🤔❓Decided to analyze bitcoin dominance and the global altcoin picture. Bitcoin and altcoins have already corrected enough. Based on logic, now is a good time to buy assets at a discount. If you follow the DCA system, now is definitely a good time. But that doesn't mean that prices can't go lower. What do we have on the bitcoin dominance chart? If you look at this chart, the picture for altcoins is not good. The double bottom, the local trend line has been broken and is now testing as support. None of this is good for altcoins. Be careful and follow your strategy.
Write in the comments all your questions and instruments analysis of which you want to see.
Friends, push the like button, write a comment, and share with your mates - that would be the best THANK YOU.
P.S. I personally will open entry if the price will show it according to my strategy.
Always make your analysis before a trade

Bitcoin Dominance - breaking downLooking at BTC.D on the hourly chart reveals a rising bearish wedge that started forming about a week ago. It broke down out of the wedge this morning and is forming some sort of pennant just below.
I've seen a lot of TA pointing to A sharp and quick decline to 39k for BTC and I think that idea has merit. I see such a move potentially causing a back-test of the recent BTC.D breakdown, but without doing as much damage to alts.
I think we're on the cusp of another #altseason
