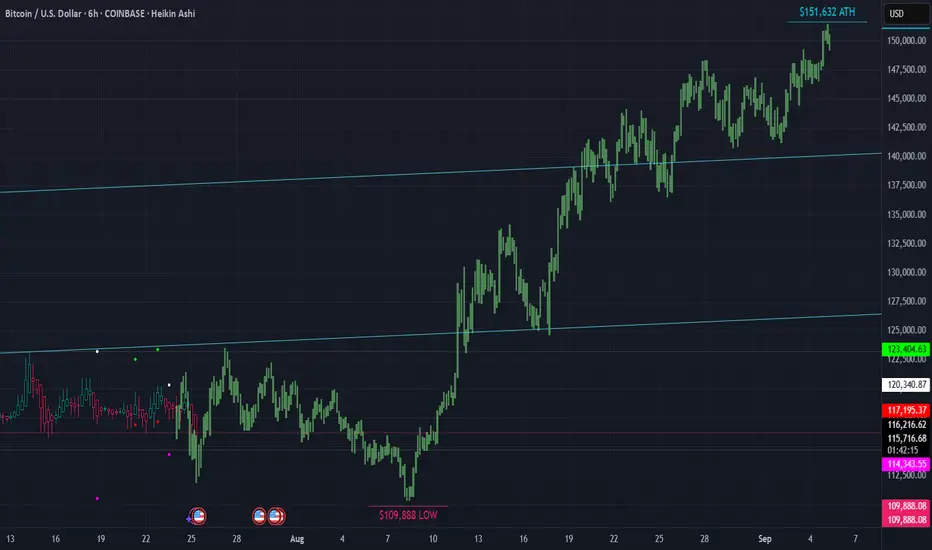
▒₿▒ BITCOIN FORECAST | 6HR ▒₿▒Hello @everyone. Long time. . . I was on a 3 year spiritual journey. I am back now and have many good things in the works. Who took my (non-financial) advice 3 years ago when I called the low of $15K a year in advance? And who believed me that it would go to $150K once we hit that $15K low? Who believes me now? Are you still thinking we've topped? Or do you think we have our $150K target in sight?
Have a look at this 6 HR Forecast. We have a low coming around AUG 8TH at $108K. And the most notable ATH of $151K around SEPT 5TH.
This is it. The playbook years in advance. I have never asked for anything or tried to sell you anything. It's all been done from a position of "paying it forward". Please, if you've taken my advice do the same.
I first bought Bitcoin in 2011. Was part of the MT GOX hack. And have had many ups and downs since then. One thing has never changed. . . And that is that Bitcoin is King. It's an asset class and a hedge against inflation. We're seeing this happen more now than ever. It's only got inflation as the halvings continue. The inflation rate of Bitcoin since/after this last halving is 0.84%. Bitcoin is up over 120-Million percent since 2011. Look at the BTC 6 MONTH candle chart and you'll see what Crypto asset you want to be in. Bitcoin is the only crypto asset.
When I first bought BTC it wasn't possible to purchase on an exchange with a debit card. I had to buy Linden Dollars from "Second Life" (which didn't always work because I had to deal with International Payment Processors due to US restrictions), then convert them to BTC on Mt Gox. Hardware wallets were not a thing. Now you can setup your bank account to auto buy on Coinbase and others. It's easier than ever. Store your coins on a hardware wallet and stay protected from the next FTX or hack.
This is the asset of the future. The "Digital Gold". I've seen the future and it runs on Blockchain and digital/virtual currency. A Super Artificial Intelligence will run and optimize all of our systems. Voting, assets, deeds, ownership and more will all be on a public blockchain ledger.
DEMATERIALIZATION/VIRTUALIZATION
INFORMATION & MEDIA
Music
We had music being played using metal, tin and wax in the 1800's, then mid 1900's we went to Vinyl and later in the late 1900's we went to plastic cassettes. And in 1990 - 2000 we had the CD which used laser optics to play the music. Effectively digitizing it. Then of course the MP3 player which was the next evolution in digitization. But where are we now? We are still in a type of digitization however it's evolved also. We are in a virtualization, where the music is not stored on the device itself, it's stored on servers which host the data to be accessed in the cloud/virtually.
You see the progression?
Metal/Wood > Vinyl/Plastic > Plastic/Digital > Metal/Digital > Virtual
(Or even further simplified on a higher level it would be Thoughts > Things > Digital > Virtual >)
What else has taken this path?
Movies
Metal/Wood - Film Projectors & Metal Reels
Plastic - Video Cassettes
Plastic/Digital - Optical Discs
Metal/Digital - Personal Digital Devices
Virtual - Cloud-Based Streaming
Books & The Written Word
Metal/Wood - The Printing Press
Paper/Plastic - Paperback Books
Plastic/Digital - Digital Archives on Discs
Metal/Digital - Handheld E-readers
Virtual - Cloud Libraries & Audiobooks
Money & Finance
Metal/Wood - Gold & Silver Coins (and even wooden coins)
Plastic - Payment Cards
Plastic/Digital - Secure Chip Cards
Metal/Digital - Mobile & Digital Wallets
Virtual - Digital/Crypto Currencies
This is the natural progression path. Are you the one still listening to cassette tapes while the MP3 player exists? Are you still using a physical thing while the virtual exists? (Nostalgia aside.)
NOW IS THE TIME!
Gold has been virtualized and it's called Bitcoin. While trading at 1,200,000 times more than it was 14 years ago it still has not yet realized it maximum value. In the past Gold and Silver were taken and bank/promissory notes were given in exchange. In fact it became illegal to not exchange your Gold and Silver for Dollars in the US. (1933 with the issuance of Executive Order 6102 by President Franklin D. Roosevelt.) The Dollar has no cap and is no different than Doge in that sense. BTC has a cap and a proof of work concept just like Gold. If you need to pay for things convert your BTC when you need to but holding or planning on making money off any other crypto currency that does not provide a base layer for our new virtualized financial infostructure it will not happen.
BITCOIN IS FINANCIAL LIBERATION FOR YOU, YOUR FAMILY, FRIENDS AND LEGACY.
BTC is up 3,000% in the past five and half years alone.
That's a 5.45 X Multiple per year. 545% growth rate compared to the unlimited and inflationary Dollar. Why not setup a reoccurring dollar cost average automatic purchase? We live in a day of virtualized programable currency, why not convert vapor currency to digital gold with the few clicks?
I am not a financial advisor. I am a Bitcoin Maximalist. Trade at your own risk. Assume your own responsibilities.
I have a big project I'm working on right now but also working on some TV Indicators in the background. I will share them with you all once I'm done testing them.
DISCLAIMER
I AM NOT A FINACIAL ADVISOR, NOR AM I YOURS. THIS IS NOT FINANCIAL ADVICE. MEARLY DOODLINGS ON A MATHMATICALLY DRIVEN GRAPHICAL INTERFACE, TRACKING AN INVISIBLE 256BIT MILITARY-GRADE ENCRYPTED ASSET. . . FOR ENTERTAINMENT/AMUSEMENT PUROSES ONLY. ENJOY!
Bitcoinforcast
don't be excited about this short rally👽hello everyone🤙
I want to say just be careful out there, we always see short pumps in bearish trends
this chart is still bearish to me

BTCUSD top-down analysisHello traders, this is a complete multiple timeframe analysis of this pair. We see could find significant trading opportunities as per analysis upon price action confirmation we may take this trade. Smash the like button if you find value in this analysis and drop a comment if you have any questions or let me know which pair to cover in my next analysis.

In terms of Elliot waves, three scenarios can be considered for The first scenario is to start the upward movement from now
In the second scenario, we can move up from now on, but in the future we will see weakness in the upward direction and we will move down again within 5 waves (flat correction pattern will be formed).
In the third scenario, we have to move down through 5 waves, of which 3 waves have been completed so far and we are now in wave 4. So we have to have another downward wave. The maximum amount of this decrease is up to the level of 14 thousand dollars.
Which scenario do you agree with?

BITCOIN BTC Bottom ?I wonder if this could be the bottom for Bitcoin. November 2022. Then of course we see sideways action and a gradual uptrend over the next x months until we enter a full on bull market cycle. What are your thoughts?

BTC - SHORT Idea (Live Trading)hello guys
on weekend I take 1 : 2 risk to reward on BTC; I just placed the trade let's see how it works. :)
this is not any Financial advice

Now is the best time to buy BitcoinIn terms of Elliott wave counting rules and regulations
Wave 1 is over and now we are in the fall of wave 2
If we predict correctly and maintain the bottom level of wave 1, we can enter wave 3 and move upwards with strength.
The validity of this analysis is until the level of 17,660 is not broken down

bitcoin movements btc once rejected from 16-18 area and thats a daily demand area
now we can see that 21-22500 daily supply area and bitcoin can reject from that area too the down side very easily
if price wants too grow too the upside ( idont think) can move like the green paths
comment your idea about that
have nice weekend

THE HOLY GRAIL BITCOIN MASTER CHARTThis is a simplified chart analysis of the BREAKDOWN of Bitcoin.
Trading Is Made Simple when you break down Price from TOP DOWN.
There is Genius in simplicity.
Price has Gone UP.
Price has Gone DOWN.
Price has just consolidated for 4 weeks.
If you apply your Descending Triangle defense to this Weekly Chart you will see with your own eyes BITCOIN is shorting as she consolidated for the last 4 weeks.
Bitcoin sold off from this level before and established the 25k TA Level.
She's setting up to SMASH that TA NOW>
I see the FALL of Bitcoin Next week or the week after next.
These are very exciting times in the Trading Space!
As always NEVER Over Leverage.
trust your Trade Set Up.
have Fun.
#TradingMadeSimple

BTCUSD - Small Short AnalysisAnyone want to trade Bitcoin, can short here and Target as mentioned on the charts.

Bitcoin will go 28K-30KLike & Comment & Follow & Share it
how are you with my 38K-40K Idea?
43K-44K it's a PRZ zone in my setup
28K-30K it's a good support but .....
yeah i know this Idea it's not good for market but thats truth.
good luck.

bitcoin price predictionjust based off percentages from last year from may on. just adding another perspective. short term bear, mid-long term bull.

#BTCUSDT Long Position in 12% Profit. Next Setup here..Welcome to this short update on Bitcoin.
Reasons to Follow me?
*9 Years in Trading!
*7 years in Crypto
*Certified Technical Analyst
*Record Holder of Most liked Bitcoin Chart on Tradingview.
*Consistent updates on Markets and Trade Setups
*No Bias
*All-time Top Author on various assets and index charts globally.
*Very Active Community during both bull and Bear Market
Let's get to the chart!
BTC broke out of the microchannel and is currently trading around the $42k level.
The lower support is around $39400 to 40340 which also happens to be the area too long BTC if you haven't bought yet.
I also understand that the breakout was too quick and many people missed the move.
No worries, never FOMO.
You have two options,
1. You can simply start buying now and add to your positions following DCA strategy or
2. You can wait for the retest around the green zone.
I opened some longs based on yesterday's bullish divergence and bearish momentum in USDT.D Chart.
Expecting more upside here as per the chart.
#DYOR before taking any trade.
This is not financial advice.
What do you think?
Do let me know and hit the like button.
Thank you
#PEACE

Bitcoin bull run time? 22.2.26Bitcoin is approaching below its resistance area, which can be revised up to 36,500 due to the weakness. But there are signs of a reversal of the downtrend. Breaking the 41,500 range and the downtrend line and stabilizing them above is necessary for the climb
⚠️ This Analysis will be updated ...
👤 Sadegh Ahmadi: @SDQ_Crypto
📅 26.Feb.22
⚠️(DYOR)
❤️ If you apperciate my work , Please like and comment , It Keeps me motivated to do better

Bitcoin crashes to 29K???I think Bitcoin can crash up to 29,000 and does not have significant support up to that area.
⚠️ This Analysis will be updated ...
👤 Sadegh Ahmadi: @SDQ_Crypto
📅 24.Feb.22
⚠️(DYOR)
❤️ If you apperciate my work , Please like and comment , It Keeps me motivated to do better

Bitcoin short term roadmap 22.2.23Whats your idea? Bull or Bear?
⚠️ This Analysis will be updated ...
👤 Sadegh Ahmadi: @SDQ_Crypto
📅 23.Feb.22
⚠️(DYOR)
❤️ If you apperciate my work , Please like and comment , It Keeps me motivated to do better

Bitcoin Longterm Roadmap 22.2.22In the long run, Bitcoin is in a parallel channel with a ceiling of 72,000, and in case of loss of this channel, it has a significant support of 20,000. The important thing is that there are other supports and resistances to which the price can react
⚠️ This Analysis will be updated ...
👤 Sadegh Ahmadi: @SDQ_Crypto
📅 22.Feb.22
⚠️(DYOR)
❤️ If you apperciate my work , Please like and comment , It Keeps me motivated to do better

Bitcoin (BTCUSDT) TA: 22.2.22The 36,500 range does not seem to have much power to reverse the price of bitcoin. Although there is a positive divergence in the chart, traders' fears have overcome this issue. The next support is in the range of 33,000 to 34,000. Beware of long positions because there is a lot of fear in the market.
⚠️ This Analysis will be updated ...
👤 Sadegh Ahmadi: @SDQ_Crypto
📅 22.Feb.22
⚠️(DYOR)
❤️ If you apperciate my work , Please like and comment , It Keeps me motivated to do better

The bear market journey Sticking to my earlier analysis this is what I am able to see for bitcoin
Analysis is based on 50/200 MA in 1 day 3 day weekly and monthly chart, support and resistance Elliot waves theory.
I have been bearish on bitcoin since the 3 month close when it formed a inverted hammer candle which was the also a confirmation for reversal and then rejection from 50 ma in weekly chart confirmed the bear market.
I am able to analyse that this bear run will be a short one as this is also the 4 th sub deca cycle wave which happens to be steep and fast also the bearish divergence in monthly is also a sign for that.
I believe we will start the final leg of bull in November or December this year which will continue till 2024 to 2025 and top out around 200k level which almost 2.8x or current top as we have been forming tops in descending multiple since 2013.
The 2025 top will also coincide with the global political and economic plans as we are on the verge of war which will continue for atleast 2 years and would require a transfer of value for war requirements and that can in this times be supported by only 3 assets gold bitcoin and dollars thus I am bullish on these 3 and bearish on indexes till 2025

#btcstarburst THIRD TIME IS A CHARM!!This is another look at a GANN study… Here we see the bounce, If we are heading to the 60k region and it kind of looks like it, maybe we break through clean.. There are three options on the board… Support levels look pretty good… fear and FUD is falling… So the question really is hold and buy or Sell? BTC will always go up long term… It always has. We could be in for a massive double Bottom… and or Not…. Either way DCA safely this is time to accumulate 25k-45k is a quality buy especially if you are a HOLDER… If we ever spike to 11k something is definitely off in the market, THE FUD that comes out is timed to perfectly!! This is a study

Bitcoin went down 11% head & ShoulderOnce again we can see that Bitcoint amazed us but not with an increase but decrease, but no worries in a few weeks will recover itself.

Bitcoin has produced the first micro rally and hit resistanceBitcoin has approached the target for that first a-b-c move up of the early January low.
That Red Target box is drawn at confluence of:
- two Anchored Weighted Moving Averages
- downward sloped red trend line,
- 100%, and 138.2% ext of wave -a- up.
After completion of that rally we can see another pullback in wave -ii- down to re-test the breakout resistance level 42,800 from above

LONG BTCUSD 15Min Daytrade - Open, TP & SL at ChartHi mates,
Reopen Position at 0.618.
Take Profit and Stop Loss on Chart.
Indicators:
Traditional Pivot P = Middle Line (Blue)
Woodie Pivots = S/R 1-5 (Blue Zones)
Triangles = Fearpoints based on SMA Highs Lows
KeltnerBands Range with 3.618 & 6.618
--
Much success
tbot21
the trading robot 🤖
--
