BTC/USD LongAn idea with a broad perspective on bitcoin. My assumption is that if it breaks the ~17700 level , with upward direction then possibly we can see the price hitting the 20000 level , in order to complete the pattern. So i will enter in the trade if the price closes above 17700 level on a 4H chart :)
Bitcoinforecast

BTCUSDT 4H:27/12/2022
You can see possible scenario and important area on the chart.
If you have a question, feel free to ask.
💡Wait for update!
🗓️27/12/2022
🔎 DYOR
💌It is my honor to share your comments with me💌

#btcstarburst Are We really off TRACK?A closer look, off the track we need to be on… The gann lines may tell a different story this is just a study DYOR DCA SAFELY…??

BTC Analysis Log.= = = = = = = = = = = = = = = = = = = = = = = = = = = = = = = = = = = = = = = = = = = = = = = = = = = = = = = = = = = = = = = = =
All contents published here are my ideas / opinions and for reference purposes. Use these contents at your own risk.
I will try to use a single article to aggregate my analysis and monitor price movements.
= = = = = = = = = = = = = = = = = = = = = = = = = = = = = = = = = = = = = = = = = = = = = = = = = = = = = = = = = = = = = = = = =
First of all, I noticed that there are 07 price areas that I am paying attention to and there is a high probability that the market will react in these areas.
Please note: These areas are not fixed and will constantly change over time.
📍 Range: 6300 - 7650
📍 Range: 9000 - 10300
📍 Range: 16150 - 17400 ( ⚓ The trading price is in this range )
📍 Range: 18800 - 20700
📍 Range: 22700 - 24000
📍 Range: 29200 - 30600
📍 Range: 38350 - 39650
As of the time of this analysis, BTC is trading between 16150 - 17400 about 4.5% below its most recent low around 17590 on June 18 and is still holding up.
🔼 Positive opinion:
BTC will continue to fall to 15500 before rising to 18800 - 20700 or better straight to 22700 - 24000.
🔽 Negative opinion:
BTC will continue to rise to 18800 - 20700 and then continue to drop to 9000 - 10300 ( equivalent to 50% of value ) or drop directly to 9000 - 10300 ( equivalent to 40% of value ).
📊 I will continue to update in the update section below. ⬇️

BTC Continues Sideways! What's Next?On the 4h chart for BTC, you can see we broke above the 50 EMA, but are still below the 100 and 200 EMA at 16.9k and 17.1k respectively.
Our Wave Fusion indicator still hasn't flashed a buy but we are close to support at 16.7k so I remain cautiously bullish until we break that. If we go below 16.7k, I'm afraid we're heading to 16.3k, where I'll still be DCAing next. Although if y we break above the moving averages, I'll be looking for a short at 17.3k which is heavy resistance.
If you enjoyed my TA or have any questions about my indicators, please send a boost my way, leave a comment below, or send me a PM :)

Bitcoin in a Falling Wedge?Falling wedges can break either direction & are notorious both for faking out market participants AND for the speed at which the ultimate move goes. Should this pattern fill out a bit more so that it's crystal clear that it's a FW, here are the break out targets visualized.
For breaks to the upside:
~$30,000 (macro resistance)
~$25,000 (highest high in the pattern)
For breaks to the downside:
~$9,750 (1.618 extension of move)
~$5,250 (measured move)
Armed with these targets, you should be able to begin formulating a plan.
Again, markets tend to move VERY quickly once a breakout occurs. I often liken it so someone yelling FIRE in a crowded theater & everyone rushing for the exits at once. Those sidelined & off sides will react swiftly to close their positions (both manually or with stops). Margin cascades will occur fast and fierce.
As is often the case during bear markets, LIMIT YOUR MARGIN USAGE!

BTC Long Trade Setup Idea to $17,300-600Based on my HTF Analysis and LTF Analysis I believe we will see a pump from here.
With good risk management this could be a nice trade setup.
NFA.

BTC To $17,300-600 Before heading to $14,000I think we will see this since there is more buying pressure then selling pressure and that price broke and re tested the resistance line.
I also believe before a big dump we need liquidity so a scam pump is ideal before making newer lows.

Did you see that Huge Wedge on the Bitcoin chart?I hate technical analysis patterns and think they are crap. But there is one pattern that has a good winning percentage and that is the wedge pattern.
Did you see this wedge on the bitcoin chart on the weekly timeframe? It looks strong, but it could still touch the $10-$12K zone.
Friends, I will be very happy if you like this idea and subscribe to me. It will be the biggest gratitude for me and an incentive to make even more cool content for you. 💚💚💚

BTCUSD Bitcoin : "Falling wedge" and what's next! 23.6Practicality, simplicity and logic.
Lack of emotion in trading fused with the ability to see pure rational and logic is crucial.
A classical reversal "falling wedge" is appearing on the chart with connecting lows and highs of the last close to 12 month of trading.
The range of the wedge currently stands between 17,500 to 31,000.
The more likely scenario is a resistance breakout and resume of upward trend, meaning current target and target to break is 31,000 for full on up-trend to be back and a new high within reach.
This may take a lengthy period of time of weeks to months.
The less likely scenario is a drop below 17,500 which could take Bitcoin back to 12,000 horizontal support stretching back to 2017.
Bitcoin is capped to 21,000,000 coins and currently stands at 19,000,000.
Once supply is capped , what is the endgame for Bitcoin?
Today roughly 11% of the population holds crypto, once the percentage hits 50% , what do you think the price of Bitcoin would be considering no more coins can be mined?
Recession, inflation and so forth give the Bitcoin potential to be huge.
With descending trust in banking and conventional currency, which the last 2 years significantly exposed with trillions of USD printed, cheap endless credit globally and an overall aging monetary system.
The short-term may prove to be low risk high reward territory.
17,500 immediate support, compared to 31,000 target - 20,000 at the moment of writing this.
Trade with caution!
--------------------------------------------------------------------------------------------------------------------------------
Thank you so much for reading! I hope this proved to be useful, if so - I would appreciate a like and follow :)
Any comments and questions are welcomed, looking forward to answer them all.
I am not a financial advisor and encourage you to do your own research before trading.
--------------------------------------------------------------------------------------------------------------------------------

Most logic Bitcoin analysisOn 2014 Bitcoin dropped -86% from the its highest point with the Money flow index hitting the oversold area and two years later bitcoin ran back up 12370%
2018 Bitcoin dropped -83% and the Money flow index hits the oversold area again and a year and a half later bitcoin ran back up 2200%
currently bitcoin is on the move downwards, Money flow index is oversold and people are panicking and thinking this the end of bitcoin just like it happens in every bear cycle.
Chart is indicating the bottom is at $9k - $13k range <-- this is where i will scale in and ride bitcoin all the way up to $100k.
The greatest profits come from seeing things better than others do.


#BTC/USDT $20k target if this happens!In our last chart, we predicted the $18.4k target.
The price followed every single point.
For now, the support remains around $17350.
The price is likely to move higher from here.
Possibly $20k.
The second scenario is if we lose the $17k level, we are looking at a $15k target for the Bears.
(Less likely)
For the $20k target, the condition being BTC holds the $17.3k level which is also the invalidation point of our chart.
Let us know what you think.
Please show your support with your likes if you find my updates helpful.
Thank you
#PEACE

Bitcoin, Bulls or Bears, who will win?⚡️The price has compressed and is trading in a very narrow range. This cannot continue for long. Soon we will see a strong momentum on the Bitcoin chart.
The next 48 hours. Bitcoin, Bulls or Bears, place your bets in the comments!

BTCUSD top-down analysisHello traders, this is a complete multiple timeframe analysis of this pair. We see could find significant trading opportunities as per analysis upon price action confirmation we may take this trade. Smash the like button if you find value in this analysis and drop a comment if you have any questions or let me know which pair to cover in my next analysis.

BTC Still Below 3 EMAs! First of all, MERRY CHRISTMAS! Hope you enjoy the TA :)
Looking at BTC on the 4h, we can see it's still under the 50, 100, and 200 EMA:
Pink - 200 EMA
Blue - 100 EMA
Purple - 50 EMA
Until we break these, my bias still remains to the downside. Now there's still support at 16.7k, so whichever move we make, it will be violent. If BTC breaks to the downside, we're still looking at 16.3k as our next level of support and where I'll start to DCA. If we break to the upside, 17.3k is the next level where I would be looking for a short, follwed by 17.6k.
With all of this said, if you want to place a long, you could place it here with stops at 16.6k, or wait for a short at 17.3k. I would not try to trade anywhere in-between.
If you enjoyed my TA, please send a boost my way and comment below! :)

btcusdt wyckoff distribution on 3 Hours time framebtcusdt posible complete its distribution .if the move sow level thhen price ll bounce back for AR Retest LPSY ..
if it happend then i m sure we ll see 15k next price level

Bitcoin Analysis 24.12.2022Hello Traders,
welcome to this free and educational analysis.
I am going to explain where I think this asset is going to go over the next few days and weeks and where I would look for trading opportunities.
If you have any questions or suggestions which asset I should analyse tomorrow, please leave a comment below.
I will personally reply to every single comment!
If you enjoyed this analysis, I would definitely appreciate it, if you smash that like button and maybe consider following my channel.
Thank you for watching and I will see you tomorrow!
You can also check out my previous analysis:

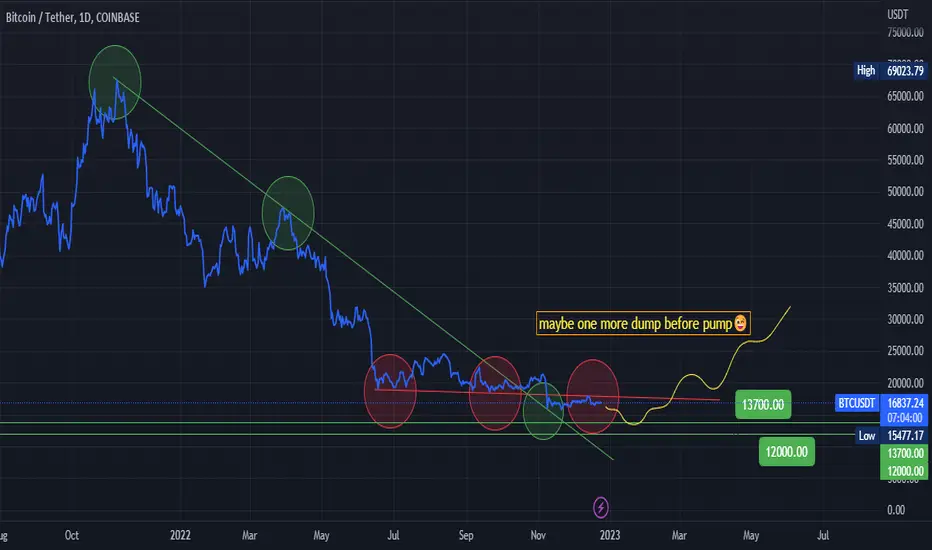
last final dump or what?😐we have two strong supports at 13.7k and 12k
and...
ONE verry verry strong resistance at 18.5k
I see no point at the level of 15-16k to hold the price of bitcoin, for now personally I'm still bearish and waiting for 13.7k price.
we'll see what happens next, just have to wait.
Bitcoin Bull Flag 1HAs you can see we formed a symmetrical triangle on the 1H chart for Bitcoin and perfectly broke down by the height of the triangle. Following that we saw a v-shaped recovery and now we can see a bull flag is forming for BTC, and although bull flags have a higher probability of breaking to the upside, we saw a death cross on the 1H with the 50MA and 200MA. In conclusion, the volume that will come after Christmas will determine which direction we can break out, and the potential targets are shown on the chart above.

at the end of the a wave?end of the a-wave is 1.41iv or 1.61iv?
you can follow the targets of the Shark or Cypher harmonic pattern of the top.

bitcoin on the bottom?70K was the 4.23BC and a very strong resistance and 17.5K was the 3.6BC of the Fibo retracement level.

BTC Elliott Wave count 1H TFBictoin may continue to the upside to end an ABC zigzag correction. 0.5-0.618 fib retracement target where I am looking to sell.
