BTC Decending Triangle ConformationIt looks like Bitcoin just get the conformation for Decending Triangle pattern in weekly.
If the price goes down 15.5 k, more drop can be expected. In that case, let's see if the 12-10 k range will hold the Bitcoin or not...
If price can hold up on 15.5 k or go above 18.5k, this formation will not be valid anymore.
This is not a financial advice. This is just a trial.
Bitcoinforecast

BTC Bitcoin Price Review - Short TermToday you can review the technical analysis idea on a 1D linear scale chart for Bitcoin (BTCUSD).
The Bitcoin price looks like its forming a lower high as part of the downward market structure. There is a chance for the price to go higher as shown in the chart before heading down lower. Targets shown in the chart. To support the analysis, I have included the Ichimoku Cloud, RSI, Volume Profile (VPVR) and Fibonacci Retracement.
I have been calling drops on BTC since November and December of 2021. I am more concerned than before that more drops are coming. Be careful.
If you enjoy my ideas, feel free to like it and drop in a comment. I love reading your comments below.
Disclosure: This is just my opinion and not any type of financial advice. I enjoy charting and discussing technical analysis . Don't trade based on my advice. Do your own research! #millionaireeconomics

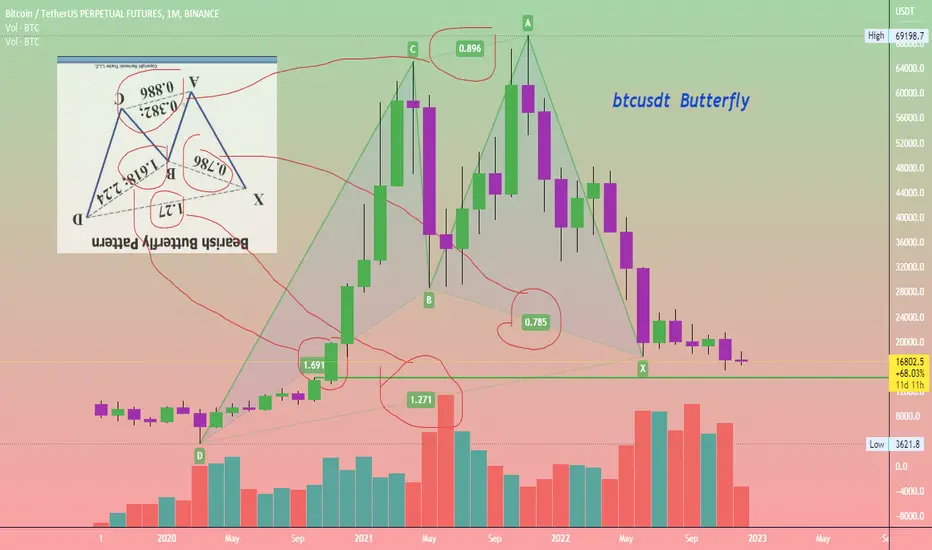
Btcusdt also Completed Harmonic on 1 Month time frameBtcusdt also Completed Harmonic (Butterfly) Pattern in Different way on 1 Month time frame
we can Expect we are near to to the Bottom .
DYOR
NFA
Bullish Divergence on Bitcoin Bitcoin has been in a downtrend a long time, last bear market i was here, i called the bottom, i longed 3,700 i will do the same this time too, bullish divergence on bitcoin 1 hour does not look great for bears.
Currently bitcoin is stuck in a liquidity lock but over the new years period this liquidity will decline and the liquidity lock will become reduced. From a fundamental perspective many are expecting global markets to worsen, i think these people are negative parrots that refuse to understand the technology and the adoption of that tech. I am a Bitcoin bull right now, below $20,000 bitcoin is a bargain, people would have done anything to buy here just a few months back, bitcoin needs to fill the liquidity gaps around 25-30k so this would be my target for early next year heading into tax season as weird as that sounds.
If you want to know more about my thoughts, follow me on YT.

BTC [BITCOIN] | POSSIBLE ROAD TO 10K. ???BTC ROAD TO 10K. ???
Now i see bitcoin price drop and drop again but till now wait for Lower low for confirm to 10K.
It possible ?? look on lower line it's relative So it has a chance to go down to 10k.
Ton Day_Trader

Bitcoin, 15minOur priority scenario in BTC is the rise in the price in wave b to the range of $17300-17500. If the price continues to rise above $17,500, our markup will change.

BTCusdt - local up, pls.
If you like the idea, please "Like" it. This is the best "Thanks!" for the author 😊
P.S. Always do your own analysis before a trade. Put a stop loss. Fix profits in installments. Withdraw profits in fiat and please yourself and your
your friends.

Bitcoin Will Hit 13000 ? Bitcoin MARKET UPDATE
Bitcoin support levels - $16,300 and $16,000-$15800 strong Support
(is Ka Matlab yahan buyers hain)
Bitcoin resistance - $16,600 and $16,900 strong resistance
(is Ka Matlab k yahan sell karney walay hain, sell hoga bitcoin)
Bitcoin per market depend karti hain tu ap ko update de di hai - is k according plan apko khud karna hai AB kiya karna hai apna funds k sath.
———————————————————————
Analysis -
BTC Support is at $16,300 and $16,000-$15800.Resistance is at $16,600 and $16,900.
BTC broke its 16600 support and made a wick towards 16260. 16300 level has acted as support. Manage risk strictly as per mentioned support and resistance levels.
BTC closed its daily candle red at 16438.Total Crypto Marketcap is at $795 billion down by 2.12% and BTC dominance is at 39.9%.

Bitcoin price analysisAs per the analysis i am assuming that the bitcoin will fall to $6000 in upcoming months. Since its already in a trend reversal phase this gonna be happened in nearest future

Fulfilling projections expectations 2023On Wednesday 14th December, 2022
We’ve placed an order at $18 140 to SHORT Bitcoin following our projections and Biz plan towards 2030.
Following our management plan; we expect to see more downside in Crypto Assets World.
Last week, the FED gave us every reasons to believe that growth will be retained; till we are able to see a better Economic Landscape in projections to the mid-ending of 2023 to the beginning 2024.
Carefully moving with wide eyes opened

BTCUSD last pump or straight dump?Hello everyone,
in my last idea I show several possibilities, one price prediction was price reaching 19k and then drop short to 12k.. but instead the price reached the maximum around 18364.. In this analysis I've shown a downtrend channel where if price respect the trendline then the price can jump to 19-20k price. price is consolidating around 16k so there is possibility for price to reach 19-20k... before it drops dead to 12k or below..
good luck

Bitcoin – the bounce is possible!Hello, everyone!
As you know I am in short position and I am sure that the new impulsive wave to the downside has been already started, but local picture told us that we can catch the pretty nice scalp long trade.
Let’s take a look at the 1h timeframe of the BTCUSDT chart of the WhiteBit exchange. I decided to consider the waves 1 and 2 as it is shown of the chart. In this case the wave 3 reached exactly 1.61 Fibonacci retracement level – the natural target. Awesome oscillator minimum value also confirmed my idea that wave 3 has been finished. Oscillator has also crossed the zero line which is the minimal requirement for the wave 4 end. It means the we have to catch the wave 5 bottom to trade the potential bounce.
Let’s wait for the divergence and the bullish reversal bar to enter the long trade. Watch out my updates I will tell you when I am going to execute this trade.
Best regards, Ivan

BTCUSD range trading 1h timeframe (NEW)Bitcoins is about to retest resistance again. We expect that it will breakout this time. Targets are shown on the chart.
How to trade: enter long position only when/if it breaks out the resistance.
If it gets rejected you can buy at the support (red line) and place the stop loss.

CRYPTO | BITCOIN | BTCUSDT -DECRYPTERSHi people , Greetings from Team Decrypters
As you can see we Bearish Pattern we expecting price to move down after a consolidation

BTC - Buy Low Sell High StrategyEveryone is asking the same question: When and where will Bitcoin find the bottom and where should I enter...?
To be able to answer this question at least a little bit, we present you the strategy "Buy low and sell high". This is actually the simplest strategy in investing, which is nevertheless done wrong by 95% of investors, because buying low and selling high is only a matter of opinion.
For one person Bitcoin is low at 50,000$ and he buys and for another person Bitcoin is low at 10,000$ and he gets in.
Therefore, the successful implementation of this strategy is based on precisely predefining the low and high points in order to be able to determine where a "low" and where a "high" is.
Entry areas
Defining this is harder than one might think, especially in such volatile times as we are currently experiencing.
Therefore, we do not focus on lows, but areas. We delineate the different areas with the help of trend lines and horizontal resistances in order to be able to determine, on the one hand, how low it could fall and in which momentum it is in the individual areas.
Accordingly, we have also shown the areas in gradient colours. The redder the areas the more bearish the momentum, the greener the more bullish!
You have to look at this the other way round in terms of investment strategy:
The redder the area, the larger my entries should be.
The greener the area, the larger my exits, i.e. profit-taking, should be.
Examples of strategy implementation
If you are only waiting for the one perfect entry and the one specific exit, you will probably have very little success. It is much more effective to enter in steps in such volatile markets:
According to market conditions:
You stay constantly on the chart and try to follow the individual levels and react to them. You are thus more spontaneous and can intervene manually.
Light red: invest small amounts occasionally
Red: invest medium-large amounts more often
Dark red: invest large amounts more often.
Light green: take small profits occasionally.
Green: take smaller profits more often
Dark green: regular larger exits/profit-takings
On the basis of fixed predefined entries
You set predefined orders for each entry range (light red - dark red).
E.g.: you divide 100% of your Bitcoin capital as follows:
Light red: 20%
Red: 30%
Dark red: 50%
For each of these areas you now define a price level in this area and place a fixed buy order with the predefined amount at the price level.
You can keep the amount of work small and place only 1 order in each range or if you want to be on the safe side, you can also plan e.g. 2-5 entries in each range.
You can set the weightings and entries (number and value) as you see fit, these are only intended as guidelines so that you can get an idea of what they mean. For example, we are only buying in the red and dark red areas, but not yet in the current light red area.
We would advise you not to plan any exits yet, we will do that together when the time comes again.
Further BTC course
As already mentioned, the redder the area, the more bearish. The green areas represent the price levels from which we would claim, if we reach them, to become bullish again and thus the next uptrends could come. The greener the area, the more bullish for the long-term chart.
We hope we could help you with your entry strategy planning!

BTC Still Hovering Around Resistance!In the above chart you can see Bitcoin is still hovering around the 16.8k resistance level on the 4h and still hasn't definitively closed above it. Although looking at a few indicators, I'm seeing some bullish signs:
1. The more a level is tested, the weaker it becomes (i.e resistance is becoming weaker)
2. The RSI crossed over the signal line and is climbing to the upside
3. The MACD just crossed its signal line to the upside as well
All of this combined with a weaker resistance usually means a strong breakout is on the horizon. With that said, I don't think I would buy right here, only because of the macro economic environment with things still being shaky. I would wait to buy until one of three things happen:
1. Bitcoin closes definitively above 16.8k
2. Bitcoin falls to its support of 16.3k or 16.1k (where I would buy at both levels)
3. If Wave Fusion gives me a buy indication at a support level
If Bitcoin does break the 16.8k resistance, I'm looking for it to retest 17.3k (which also coincides with the 200 EMA) and rejecting a least once back down to 16.8k before longing again.
If this helped you out in any way or you had any questions about the indicators used, please comment below or send me a PM :)

With no reason to move up, BTC is ready to hit $16.025 levelsWith no reason to move up, BTC is getting ready to go down to retest $ 16.025 levels.
What is happening in the world right now putting more and more weight on Cryptocurrencies and BTC prices:
job cuts
Covid is spreading like rapid fire throughout China.
Ukraine War which not coming to near end.
Inflation and massive energy bills
with nothing supporting cryptos, BTC is consolidating between $18000 levels and above 15300, with a higher potential for a drop further towards $16,025 levels, breaking there will lead to a quick visit to $15530.

Bitcoin bleeding out. Only a matter of time 🐻Pulling up the Daily chart on Bitcoin.
We're currently crabbing in the 15-17K range that began in November following the FTX crash.
We've since then pushed up towards 17K, with us blasting through 18K last week only to be rejected hard back down below 17K
It was a pretty glorious bull trap and one that most smart money players could've seen from a mile away.
We think a retest back above 17K is entirely possible, especially if we see a scam rally in equities.
However, the HTF chart looks very bearish and we've been given no reason to flip our sentiment to bullish.
If we get a serious leg down in equities and an SP500 touching 3200, then a 10-12K Bitcoin is the next "bottom".
We've been writing on the incoming crash in both equities AND crypto the last several months, both of which have played out.
We won't give ourselves too much credit though because how can anyone be bullish with FED comments and CPI where it's at?
Let's see how we finish 2022.
Eyes Peeled.
-TucciNomics
Chief Overlord, AlgoBuddy

BTC break-up possible confirm DONE!After a 1-year of down-trend bitcoin had a break-up on parabolic trend. Now it is all about if it's gonna hold on confirmation or not. Confirmation band is between 16500-16700. Any scenario of btc holding the price over 17300 is a good sign of trend-reversal.

Can Bitcoin Break Back Above Resistance?On the BTC 4h, we can see the Wave Fusion indicator called the short perfectly at $18k. Since then, Bitcoin has broken through three major support levels. Now it's currently at resistance of $16.8k trying to break back above. Let's look at a few things:
1. The 4h RSI was oversold yesterday (last time it was oversold was Nov 21st when we started the upwards channel)
2. The MACD is starting to curve back to the upside. It hasn't confirmed, but this is a good sign that sell pressure is relieving temporarily.
3. It's tested resistance a couple times in the past 24 hours and as we know, the more you test a level, the weaker is becomes
With all of this said, I'm expecting BTC to eventually break the 16.8k level, climb to 17k, then retest 16.8k where I'll be taking a long. But I'm WAITING for that confirmation first (it needs to convincingly close above the 16.8k level on the 4hr). If Bitcoin can't close above 16.8k, then I'm looking towards the 16.3k level to take my next long.
If you enjoyed my TA or had any questions about the indicators I use, please leave a comment or send me a PM :)

Financial Wave. BTC m15Our priority scenario in Bitcoin is the rise in wave (iii) the first target is $19293. Price fixing below $16,563 jeopardizes this scenario.

Bitcoin's fall continuesIn the most recent events, Bitcoin has touched the lower levels of the resistance zones before it continued to go down. This gives us two likely scenario, both of which are indicating Bitcoin is going lower.
The first one is that, from here, Bitcoin just decides to go lower, without going up again. The second scenario is that Bitcoin will make a slightly higher high, touching the upper part of the resistance zones.
It is possible that we've already seen the bottom of this market. Therefore there is a possibilty that we won't see a break of the 15k support level. However, with the SPX falling, it seems more likely that the bottom is not in yet.

Binance's withdrawals, FOMO, and no market bottomOver the past few days, many things have been happening in the cryptocurrency market. Binance experienced massive withdrawals of funds, exceeding $3 billion, Bitcoin jumped above 18 000$, and the FED raised interest rates by 50 basis points. However, despite many of these things, we continue to see bullish calls all over the place.
We hate to do that, but once again, it is time for us to dismiss these calls for Bitcoin bottom and primary trend reversal. Yesterday’s spike above 18 000$ could result from various factors like Binance buying tokens on the market (to deliver them to people withdrawing their holdings), algorithmic buying, speculation about the pivot, and chasing the market by investors out of FOMO (fear of missing out).
Whether these are real factors responsible for the price rise or not, after the FED hiked interest rates and Jerome Powell reiterated the central bank’s hawkish position, euphoria suddenly faded, and Bitcoin slumped toward 17 700$. Of course, that is no surprise to us as we repeated multiple times that there would be more economic tightening, pushing the market bottom further away. With that said, we do not believe the bottom has taken place. Indeed, we still maintain our price targets for Bitcoin at 15 000$ and 13 000$.
Illustration 1.01
Illustration 1.01 shows the daily chart of BTCUSD and its retracement toward the 50-day SMA, which often coincides with strong market corrections. This level currently acts as a resistance level for the price. To support our bearish thesis, we would like to see Bitcoin hold below this level.
Technical analysis
Daily time frame = Neutral
Weekly time frame = Neutral
Please feel free to express your ideas and thoughts in the comment section.
DISCLAIMER: This analysis is not intended to encourage any buying or selling of any particular securities. Furthermore, it should not be a basis for taking any trade action by an individual investor. Therefore, your own due diligence is highly advised before entering a trade.
