Bitcoin 2022 - 2026An update to previous Macro plan, this one including ranges of interest to me. Info for fun (but one i'll play). If we achieve my buy zone, it should be an easy 10x. only time , and invalidation will tell us now.
Bitcoinforecast

BTCUSD - SHORTBitcoin is in a correction phase, and I'm expecting the price to break and continue falling. The price is expected to fall all the way down to 15/14K. I.e our support zone. At that point we would be looking for opportunities to go Long.

Bitcoin bullish short termThat could be it for the bitcoin. The emotion in the bitcoin market is very high, especially in the bearish phases. Let's not let that get in our way and look at the technical factors of bitcoin - more specifically, the Elliott waves.
According to my calculations, we are in an uptrend, at least for a short time. Bitcoin has approached the area of the wave (iii), the 1.618 extension and is currently building a clean 5divider. When bitcoin crossed 18060, I could hardly believe it.
Right now we are in the (iv) of the i, so it will go up a bit before the next correction. We will probably reach the 300% extension at 19863 before correcting again.
Are you invested in bitcoin? When do you think bitcoin will go up again?

Bitcoin (BTC) may complete another price reversal moveHi dear members , hope you are well and welcome to the new trade setup of Bitcoin (BTC)
Ona 4-hr time frame, BTC may complete the final leg of bullish reversal Shark move.
Note: Above idea is for educational purpose only. It is advised to diversify and strictly follow the stop loss, and don't get stuck with trade

Wave Fusion Called The Short on BTC!Looking at our BTC chart on the 4hr timeframe, we can see Wave Fusion called the short perfectly which also coincided with the top of our upward channel! This was a huge fakeout for a lot of people because initially they thought the FOMC numbers were good but it turned out the FED is still hawkish for 2023 and actually raised their expected numbers (hence the reversal).
Now I'm looking for $17.6k to hold as support. If it doesn't, then I'm looking at $17.3k to be the next major support level since it also coincides with the 200 EMA (pink line). I'm still expecting the top of the channel to act as resistance and if we manage to break above that, then $18.7k is our next target.
If you enjoyed my TA or want to purchase any of my indicators, please leave a comment or send me a PM :)

BTC Final LOWSIt appears we are approaching BREAK-BARIER for Long-Term LONG Cycle.
Currently we expect short rally to 20,600 in coming days, when with slow confidence acquisition thereby we expect to break 30,300 resistance before January 24th.

"First signals" that the markets are ready for growth, Why?👇Today we will consider the local situation on the BTCUSDT trading pair
And we will offer you a trade that has every chance to work out over the weekend.
Last week we published an idea with a possible BTCUSD price movement, it is still relevant, and we believe that it works perfectly
During the week that is coming to an end, the BTC price slightly touched the purchase zone and buyers organized a rather aggressive buyback (in the context of the current passive market)
Growth Bitcoin price for the week of +7% seems not a bad result, but it is much better that buyers managed to break the first portion of the short stops that were hiding above $17000
The next step is to hunt for the second portion of the short stops hiding in the marked zone above $18000
Today, there may be increased volatility in the market, because unemployment figures in the US are due to be released. It is expected that they will be an additional positive factor for growth in the markets in conjunction with the available data:
DXY - the dollar index began to fall actively (and has prospects for further decline) This means that the value of the dollar is falling, and it needs to be invested in the economy, and in business. So that the value of monetary assets does not depreciate, but generates earnings.
The last time such dynamics of the fall was in 2020-2021, and the crypto market at that time was experiencing a DeFi boom and the overall growth of most cryptocurrencies.
S&P 500 - is steadily growing as a result of investing the dollar in the most powerful companies that are included in the SP 500 index
Experts estimate the probability at 82% that the Fed rate on 13.12.2022 will increase by +0.50%, and not +0.75% as it was in previous months. Just three weeks ago, this probability was estimated at 60%, and this is already a positive trend
Well, considering all the above facts, we consider it acceptable to try the trade on the following conditions:
Entry $16661
Stop $15999
Take profit $18234
Have a nice weekend and profitable trading)
_____________________
Did you like our analysis? Leave a comment, like, and follow to get more

possible Bitcoin price movement for the nearest weekToday we will consider the possible BTCUSDT price movement for the coming days/weeks.
After all, if a pattern of reversal and trend change is forming now, it is important to understand where the safe buying zones are.
If we talk about the Bitcoin price, then you can try to buy it if you see sharp buybacks from the liquidity zone of $15800-16000.
If sellers do not manage to lower the BTCUSD price below $16135 at all, it will be a super strong signal to buy, because it means that sellers are weak and buyers are aggressive.
Well, then buyers can start to drive the BTCUSDT price up, and break the stops of shorts. Each break of the shorts' stops can only accelerate growth because aggressive closing of the shorts is a buy order on the market price.
So buyers can very quickly drive the BTCUSDT price into the liquidity zone of $19-20k even before the end of November.
If you are interested in our global view on the possible future of the BTC price, we invite you to watch:
Speaking about altcoins, you should start buying them when BTC sellers confirm their strength. Also, in our opinion, you should first all pay attention and buy altcoins that have stopped updating the lows of 2022, for example, such as XRP
In the comments, share the altcoins you think are strong and worthy of attention and purchase. And we, in turn, will analyze some of them next week and will publish them here.
_____________________
Did you like our analysis? Leave a comment, like, and follow to get more

Bitcoin – liquidity collection will cause the dump!Hello, everyone!
The target from the previous article has been reached and I think that Bitcoin will not grow above the current price. The upside correction has been finished and now it’s time to see the new deep dive.
Let’s take a look at the 4h timeframe of the BTCUSDT chart of the WhiteBit exchange. I made a mistake with the short entry point at $17300 because I supposed that wave C have been finished there, but wave is extended and I decided to not close the short trade, I told about it yesterday in short update. Now I consider the reversal point, may be we will see one more local pump but it will lead to more severe crash.
$18200 was the magnet zone because of liquidity of short traders. Now there are no any significant liquidity above, but we have a ton of liquidity below, I suppose the next impulsive bearish wave will collect this liquidity next couple of months.
Best regards, Ivan

Financial Wave. BTC m15Our priority scenario was confirmed by the growth of BTC to $18383, where the small wave (3) ended. Continued growth in wave (5) to $18,770 looks most likely. We allow the price to fall in the range of $17357-17635, if the price falls below $17357 we will change our mind.

🆘 sell wall on weekly timeframeHello everyone, as you can see BTC has massive sell wall on it's way to the upside.
we have massive massive resistance somewere beetween $ 18400 - $ 21100
personaly I think $ 19400- $ 19500 can hammer the price to the downside
BTC price still bearish, be very careful
peace

WE'RE GOING TO $59KLooks like BTC is setting up for a pump to $59K then probably a correction before the next MEGA BULLRUN

BTC/USD Daily Levels - December 13th, 2022Looking at Bitcoin on the daily time frame we see lower lows as compared to Ethereum that saw a double bottom on this most recent contagion event. Now, if Ethereum continues that path and general trend upwards from this event, Bitcoin should follow would and bottom out around the $16,889 level before making its way upwards towards $19,356 and testing out those levels seen before the FTX meltdown.
SBF just got arrested, pretty big bottom signal in the markets, we’ll see how they like that news event tomorrow on NY open, but if this explosive move continues to the upside, I’m looking at ~$21,000 to pull profits (TP2) after shaving a bit off at $19.3k as we break these resistances.
There is a possibility like always to come back and retest the origin candle of the breakout, however, in this case that would make for a great entry at $17,295. Anywhere in the range of $16-17k is a phenomenal entry for a target sell price of $19.3k, and an even better entry for a long term slurp. I entered at $16,889 and will keep you updated with more signals to follow.
As always please do your own research, I am not a financial advisor and this chart is for educational purposes only.

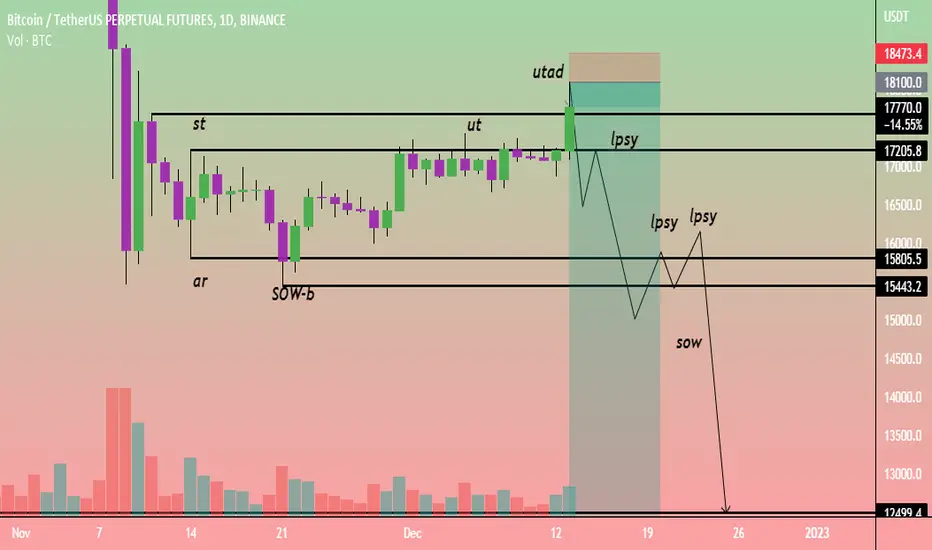
BTCUSDT - Wyckoff Method Bottom FinderHi Traders, Investors and Speculators 📈📉
Ev here. Been trading crypto since 2017 and later got into stocks. I have 3 board exams on financial markets and studied economics from a top tier university for a year. Daytime job - Math Teacher. 👩🏫
A quick look at BTCUSDT from a macro perspective. It seems likely that Bitcoin needs to find a lower bottom where the demand zone is strong enough to stabilize the price. Currently, the volatility in the market may seem like it's bullish, but if you zoom out you can clearly see lower highs which is a benchmark for a bearish cycle. The price action is currently trading in the distribution phase of the Wyckoff Method market cycles, and we still need to establish a clear bottom followed by a period of sideways/range trading.
This was an earlier proposed bottom for BTC by using the Wyckoff Method:
Although my timelines were off, we can clearly see that the price action has not yet entered the final phase of the cycle and is still in a downtrend.
Remember, there are lots of other great opportunities in the markets during December that could make for a better trade setup as opposed to BTC.
Interested in stock markets? Check out this idea on SPX where I cover Apple Inc. , MSFT and AMZN :
_______________________
📢Follow us here on TradingView for daily updates and trade ideas on crypto , stocks and commodities 💎Hit like & Follow 👍
We thank you for your support !
CryptoCheck


Bitcoin Breakout! Big Support Resistance Levels to Watch!Bitcoin finally broke above the 4h 200 EMA and horizontal resistance at $17,300! This was a HUGE step for BTC since that level has acted as resistance for some time now. Now the question is, where do we go from here?
The big levels to watch are the top of the channel at $18,000 and the MAJOR resistance at $18,700. I'm expecting Bitcoin to at least retest the support at $17,640 before continuing higher. If it breaks through that support, then the next MAJOR level is the 200 EMA and horizontal support combined with the bottom of the channel at $17,300. These would be great levels to DCA (dollar-cost average) if it gets there.
If you enjoyed my TA or had any questions, please comment below or send me a DM :)

BTC Bulls Next Target is $17600-$18200 After This HappensBitcoin Bulls are ready for some good green Holidays in December, The current pullback after hitting $16800 could go further down to a more stronger support range at $15800 - $15450 range. This range will provide buyers with sufficient buy capital to attempt the $16800 resistance of which I so see them clearing through it to hit $17300, but here I see market makers targeting Sellers(Shorters) stop-hunt around the $17600 all the way up to $18300.
I'm staying open minded on the support and a possible worst case scenario triple bottom could arise because for now the current Dojis on weekly support shows anything can still happen, What are the chances that the bulls will make it to above $18k in Dec?
I say we have over 75% chances of bulls making it to $18k and over 65% above $20k
The current pullback must not go below last low of $15433 range to be more open minded,
I do see that from December 2022to January 2023 will give buyers the opportunity with the current accumulation on going to achieve a little more recovery to the upside before a major more dump coming from Mid 2023 to 2024.

#BTC Bear Flag $10k FloorWhen in doubt Zoom out.
A picture can paint a thousand words.
85% Draw Down?
75% Draw Down?
IMHO, Bearish looking to play the Bull trap back down to $10k btc.

Bitcoin is on the edge of collapse!Hello, everyone!
It’s time to refresh our global Bitcoin analysis because I have some evidences that the new impulsive wave to the downside is about to happen.
Let’s take a look at the 1D time frame of the BTCUSDT chart of the WhiteBit exchange. When we analyzing the Elliott waves first of all we have to find the minimal Awesome Oscillator value. It corresponds to the wave 3. I consider wave 3 has been ended at the $15500. Now our purpose is to find the wave 4 top to short the market and catch the wave 5. I have already opened short position at the very top $17300 and told you it here 5 days ago. I suppose that the wave 4 has been already ended because of the AO zero line crossover, but I am ready if BTC will show us another one leg up. Maximal target is $17800 where I can wait the price to enhance short position – it’s 0.38 Fibonacci level.
I want you to notice that the 0.5 and 0.61 Fibonacci levels are unreachable because it will violates the Elliott waves axiom about non-overlaping waves 1 and 4. Hence I am waiting for the crash in the nearest weeks. The probable target for the wave 5 is $13200.
Best regards, Ivan

btcusdt dayly timeframe bearish wyckoff distribution foundbtcusdt dayly timeframe bearish wyckoff distribution found
dyor
learning purpose
#BTC/USDT Geopolitical Factors or Manipulation?Welcome to this Quick BTC Update.
A close below $16588 will trigger a bearish rally toward $15k.
I see a bullish rally in the charts with a target of $18k+.
BTC is currently hitting the support with a demand zone from $16500 to $16800 level.
The Russia-Ukraine war is back again, recently 100 missiles were fired again.
This has been going on for a long time.
The FTX saga is over, there's no more pain IMO which is bigger than the FTX.
I AM ACCUMULATING.
Good thing, we closed 75% of our 7 altcoin positions in massive profit when BTC was trading above $17.2k.
25% stopped out with a low profit.
Only CHZ was stopped out with a small loss.
You were warned on multiple platforms.
Check out if you haven't yet.
Not Financial advice, DYOR!
Do hit the link button if you want to support my work as it motivates me to post more setups and updates like these.
Thank you
#PEACE

BTC 2h Analysis 13 dec 2022 (UPDATE)The previous analysis still stands in my opinion. It can return from the specified resistance range to the lower stability and we can correct the numbers announced in the previous analysis

Can Bitcoin Break Above The 200 EMA?BTC recently climbed back into our upwards channel on the 4h chart but still remains below the 200 EMA ($17,300). This is such an important level because it's acted as resistance since Dec 5th and is now coupled with horizontal resistance (red line) near the same level.
This is a big week with a lot of numbers from the government (CPI, FOMC, etc.) so expect a lot of volatility. If Bitcoin can break above the 200 EMA I can easily see us touching $17,640. If not, then my target is $16,700 (next major support). Since we broke out of the upwards channel yesterday, I don't see it as much of a support now. If we break $16,700 then $15,900 would be my next major resistance.
If you enjoyed my TA or had any questions about the indicators I use, please comment below or send me a PM :)
