BTCUSD - Back below 5.000I would like to share what I see regarding Bitcoin. I'm not trading it right now but my system is is still showing a sharp decline below 10.000 and below 5.000 in the following weeks.
Last week we finished printing a symmetric triangle what broke down yesterday.
The symmetric triangle is a continuation pattern , I highlighted the target price what is not funny at all.
21st May looked like we printed an ICL but if you check the RSI 5 you can see when we tagged the overbought territory price started to drop again . It means the ICL still ahead of us . The measured target from the pattern is showing 4353$.
100MA and 50MA crossed over and price had lost the 200 SMA.
While I see a lot of posts how Bitcoin will rally again this chart doesn't look bullish at all... I see a popped bubble what is going lower and lower in the ERA of inflation.
Bitcoinforecast

Can the Pi cycle top predict the bottom?Can the Pi cycle top predict the bottom as well? Yes it can, it has on three different occasions. Coupled with the investors tool not only has it predicted 3 bottoms within 10 days but also the percentage within 7%.
In order to see view this you must be on the one day chart and use the investors tool with the Pi cycle top indicator. When the Orange line has crossed down below the the bottom of the investors tool trading range in the past it was precisely at the bottom within 10 days and has done this on three occasions that all marked the bottom. 2015 was the first time and it fell 53% (you can scroll back to see) 2018 was the second @ 45% fall and the third time was June of this year that fell 49%.
both times afterwards price action met this line (Pi Cycle orange) as resistance including this year. On both other occasions the end of the bear market was marked as soon as price action broke above and then held this line as support.
SO far it's all playing out perfectly, so for me only have we market the bottom we could be ready to flip this line in the next few weeks.
We should never use just one indicator to come up with a conclusion so it's our job to find more of them. Let's see what you have.
Cheers and thanks for looking
If you have any questions or comments please don't hesitate to comment below.

Does history repeat?The question here is, if history repeats and how accurate it may be.
Well so far it has on two other occasions irrefutably along with the RSI.
As we can see here on the 5 day chart the 21 day yellow line crossed the 200 day purple line right on schedule. In previous history the 21 day cross came after the price bottom and had direct correlation with the RSI. The RSI then formed bull divergence and kicked off the next bull run. Looking at this bear market there is almost an exact pattern playing out with all of the indictors including divergence.
I also have linked another chart with similar evidence in as well.
Let me know what you think in the chat below.
How strong do you think historical data is?
Do you think it likely plays out ?
Is this time different?
*Always drink and invest responsible*

BITCOIN, Be prepared!Hello traders and followers. We are going to take a look at BTCUSDT and the scenarios we might have in the following days.
First and foremost don't forget to like this idea if you agree with it, it motivates us to create more.
Now let's get started with the fundamental background that has had two major events this week:
- Binance/FTX feud has caused a lot of distress in the cryptocurency markets as you well know, we still do not have a conclusion
and some tweets can change the price action even over the week end, so i strongly recommend following the accounts that are involved in this.
- CPI announcement yesterday. Caused both currency and cryptocurrency market to jump due to the fact that inflation is showing signs of decreasing.
Technicals:
BTC daily is not looking good, we broke the structure we had before and we are now strugling to break above it.
A positive tweet related to the FTX situation may be the catalyst for the break above, we don't have it yet.
Zooming in the 4h chart we can notice the formation we are in , triangle that is supported by a very weak trendline that
doesn't have that much history.
Note the buy volume that is decreasing - indicating a divergence in the price action, giving a bearish scenario more chances to happen.
In this 4h chart you will also find a 0.33-0.66 Fib that we use with the assumption that closing above 0.33 will increase our
chances to eventually get to 0.66 which is standing at $19.483. Using this indication in priority to the resistance plotted on the chart.
Bearish scenario that still stands
On November 2020 we plotted a daily bullish orderblock that has since never been mitigated, and in my opinion stands as the main point of interest
for longing and as a potential target for shorts if we break this formation on the lower side.
This is my analysis on the daily price action, i hope it was usefull.
Keep a hefty bag of stables , be prepared for both scenarios

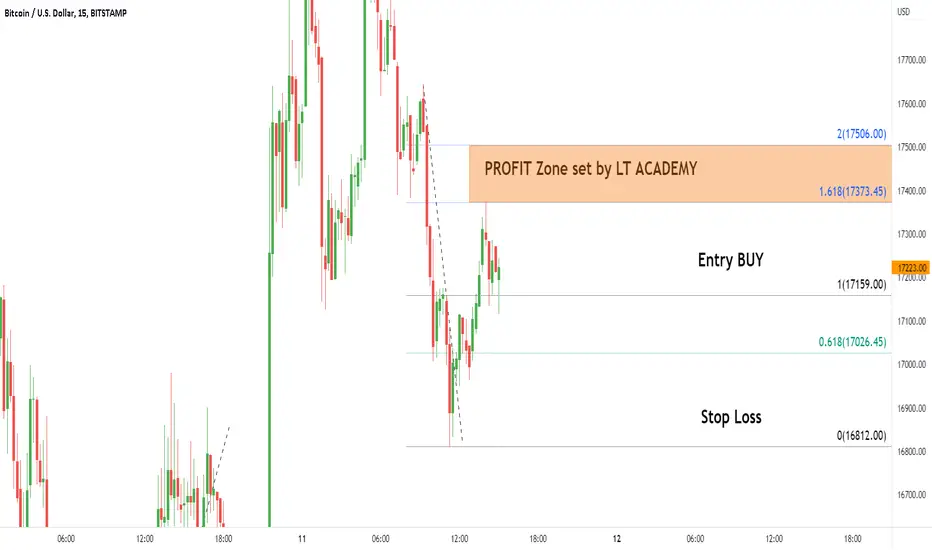
BTCUSD intraday trading & flying to the moon🚀 11 NOV 2022Bitcoin intraday trading alert
3 steps must fulfill before entry
1. 1st breakout done
2. Retracement done
3. 2nd breakout and see you in the sky🚀
Hope you like my Trading Alerts~
Cheers~
Bitcoin Can Hit 100,000$ in This YearBitcoin MARKET UPDATE
Bitcoin support levels $17,200 and $16,300 strong Support (buyers available at this position).
Bitcoin resistance - $18,600 and $19,600 strong resistance (sellers available at this position).
Market depends upon Bitcoin movement so we updated you about Bitcoin now trade with risk management.
———————————————————————
Analysis -
BTC Support is at $17,200 and $16,300. Resistance is at $18,600 and $19,600.
Trade carefully and manage your risk according to mentioned support and resistance levels.
Looking at 1 hour timeframe, BTC is getting support from 20 EMA. However volume is low right now.
BTC closed its daily candle red at $16,869.

Fundamental Analysis Prevails For Bitcoin Well, here we are. After months of frustrating action for traders, Bitcoin has finally given a sizable move. Not too long ago, I had just begun to see the possibility of a bigger relief rally for the largest cryptocurrency. This was due to some technical developments, coupled with the lack of bad news in the crypto market. Granted, I had no intention of purchasing any and still do not. So, my instincts regarding the fundamentals for this market have saved me some extreme losses. For this entire year, I've been writing about why I do not think the fundamentals of Bitcoin and other cryptocurrencies make sense. The vast majority of my posts have been extremely bearish. Many of those posts are linked below. It seemed as though I was just going along with the prevailing sentiment. Yet, my feelings have only become more validated as the year has worn on. When something does not produce an output, and when something lacks usage outside of holding, transferring, and trading, it is subject to speculation - and speculation only. Without a material purpose, an asset like this is easy to manipulate. The question is - would it still be wise to buy Bitcoin from an investing standpoint?
Since money is a somewhat abstract concept, the narrative around Bitcoin and crypto can be warped to fit the intended audience; whether it's empowerment for marginalized/oppressed populations and financial access for the unbanked (political left) or the distrust of big government/big banks (libertarian right), Bitcoin's got a spin for everyone. Or should I say, everyone with the means to access it in the first place. When we saw what happened with El Salvador, that was my "AHA!" moment. No one wants this garbage. People invested in crypto expecting to say F-U to the big banks and avoid a bank run. But here's a very genuine bank run, staring us in the face.
The White Knight is a Wolf in Sheep's Clothing
Enter the snake oil salesmen, as we like to call them. You may know them by name: Sam Bankman-Fried, Do Kwon, and Changpeng Zhao. We call them snake oil salesmen because their entire business runs on selling something that is virtually useless. And my theory is that they know it. Just today, Binance transferred an enormous amount of USD stablecoins out of their exchange. My guess CZ (Binance) and Justin Sun (Tronix) are somehow using their stablecoins BUSD and USDD to manufacture "infinite" money. They extract capital from traders/investors through these unregulated stablecoins and then swap these unregulated stablecoins for more "legitimate" stablecoins such as USDC and even USDT, financing the grandest counterfeiting scheme the world has ever seen, and the first instance of broader DIGITAL counterfeiting. Since this has been a theory of mine for a while (remember, it is only a theory), it came as no surprise to see CZ appear as a "white knight," eliminating the next "bad" player from the crypto market. In taking down SBF, perhaps he bought himself a little time to extract a bit more liquidity from the market. Greed knows no bounds. My theory is that eventually it will all come crashing down. But maybe this is just extreme thinking.
It doesn't seem so extreme after what just happened.
Now, what about the technicals??? Are there any technicals left for Bitcoin???
Well, we have a bounce. The better than expected CPI numbers have sent markets rallying, yet Bitcoin is still substantially lower than it was yesterday morning. Just check out its performance against SPX. This is a chart I show frequently, but I think it illustrates something important:
It shows that equity markets can very well just continue onwards without Bitcoin. The biggest setback for crypto with this FTX disaster is that SBF was a liaison of sorts between U.S. regulators and the shitcoin casino. Lying in the face of the government as the face of an industry will likely leave yet another stain on this market, and perhaps one that is impossible to get out. Yes, I think it is that bad. For those who say, "But no, it's just shitcoins that are in trouble! Not Bitcoin! There will be a new all-time high eventually so buy now while it's cheap!" well....we can clearly see from this last cycle - the average person cares little about Bitcoin itself other than as a speculative investment, and it is now trading below its previous all-time high. The longer Bitcoin stays low, the more likely events like these will continue to occur as there is no bailing out these crypto kingpins, and even the mass production of stablecoins can't keep up with a liquidity crisis. Even back before the LUNA fiasco, I suggested events like these seemed likely.
To move up from here, Bitcoin will need to attract buyers, not sellers here above $17.6k (previous bottom from June). It will also need to hold back above the previously broken downtrend. This trendline has some wiggle room (it's not totally precise), but you can see that breaking back below it yesterday caused a significant selloff.
The next major support level lies near $13.8k - the high from 2019. The $12.5-13.8k zone has a huge amount of historical traded volume. This area seems like it has already been fron-run by traders, given the size of the current bounce from $15.5k to now near $18k. During the initial bounce, USDT de-pegged momentarily as much as 3% and funding became extremely negative for futures, since liquidity dried up instantly as prices went below $16k. If price ventures down there again, I would expect price to get a bit closer to that $13.8k level, and perhaps it would put some stress on those bigger stablecoins and exchange futures funding. But, if Bitcoin can get back above $19.8k soon with decent volume, perhaps the medium-term bottom is indeed in. I just don't see it very likely for crypto prices to sustain higher levels in the future, even if they go up again in the short-medium term.
What a time to be observing and participating in financial markets! It's certainly an amazing lesson in economics and human psychology. Thank you for reading, and for taking part in this journey with me.
As always, this is not meant as financial advice, but for speculation and entertainment only. Please consult a licensed professional financial advisor before making any significant financial decisions. This piece represents my opinion only, and there are plenty of others out there.
-Victor Cobra

#BTC/USDT Urgent Update! DO NO PANIC!!!Welcome to this Urgent BTC update guys,
I will keep it short.
I have mentioned for many days not to take leverage trades.
I hope you understand NOW why.
Eventually, these industry giants work together.
It's all a game for them while common people/traders get rugged on leverage.
I bought BTC around this level of $17450 and I still feel BTC will be above $75k in the next 24 to 36 months.
So zoom out and watch higher time frames.
Even if you see this chart, we might have wicked down to $17166 but still, we are trading inside the channel.
Although am not sure what is about to happen next, I could tell. you one thing for sure, If you are selling now you will regret it for life.
If you are buying now you will be thankful in the long run.
This is the yearly low now.
Still do your own research, I will be more than happy to buy BTC around $13k to $15k if it gets there.
LTF Update:- We will wait for the daily close and the upcoming weekly close.
If the FTT shit goes on for the next 2-3 days more we can see more lows.
Avoid leverage if you are new.
I hope this update helps you. If it did, give it a like.
BE STRONG, THIS WILL PASS. The decisions you take for the next few months are very important.
DYOR Not financial advice.
Thank you
#PEACE

Bitcoin Bottom in finally in! Accumulate.Bitcoin has historically dropped 50% below the 100-month SMA before starting an uptrend for the next cycle. Currently, we are at 58% below, which is exactly what we were at in 2015.

Bitcoin Bottom in finally in! Accumulate.In the previous three cycles, Bitcoin has fallen around 50% from the 100SMA during the capitulation phase. Currently, Bitcoin is at 58%, which matches 2015 exactly. I do not think we fall much further from here, and it is an excellent time to accumulate.

Bitcoin and cryptos - time to bail? too late? safe haven?This custom chart that I post periodically continues to have excellent TA.
Right now it's reflecting the volatility from recent crypto events, and less obviously but more importantly, that gold has bottomed.
The spike upwards is showing us where things are headed - bullish for precious metals compared to cryptos.
BTC *may* have found it's bottom (for now, though I see it headed lower still in 2023), regardless gold and especially silver will be bringing this ratio much much higher in the coming weeks, months, and years.
So if you really want to maximize your crypto gains (this is not financial advice), it might be prudent (and for some, counterintuitive) to pull out of crypto (no, it's not "too late") and dip in to something that CANNOT go to zero: precious metals.
But how you ask? There is a platform that does this reliably that I have done my own due diligence around (please do your own DD too), however trading view does not like me to tell you about it here. (Maybe check the comments ;)
Good luck out there everyone!

Bitcoin: Local Dead Cat Bounce RangeToday you can review the technical analysis idea on a 1D linear scale chart for Bitcoin ( BTCUSD ).
The chart shows a few dead catch bounce ranges for the BTC price to get to before price goes lower. To support the analysis, I have included the VPVR, Keltner Channels, Ichimoku Cloud, Fibonacci Retracement and RSI.
I have been calling drops on BTC since November and December of 2021. I am more concerned than before that more drops are coming. Be careful.
If you enjoy my ideas, feel free to like it and drop in a comment. I love reading your comments below.
Disclosure: This is just my opinion and not any type of financial advice. I enjoy charting and discussing technical analysis . Don't trade based on my advice. Do your own research! #millionaireeconomics

Bitcoin – BLOOD on the market!Hello, everyone!
First of all I wanna tell you that dump is not over. But I have also a good news. We will not see significantly lower prices than we saw yesterday. I tried to understand how this impulsive wave is forming and today I finally wanna show you the sub waves structure. Let’s go.
Let’s take a look at the 1h time frame BTCUSDT perpetual contract of the WhiteBit exchange. Here is the clear Elliott waves structure according to the trading chaos approach. Wave 1 started this crash. Wave 2 retraced to 0.61 Fibonacci level. Wave 3 was the most impulsive one. It have almost reached the 2.61 Fibonacci extension level and now Bitcoin is finishing the wave 4. It has the target $18200, but could be shorter. Wave 3 corresponds to extremal Awesome Oscillator. Wave 4 min condition have already been completed – AO crossed zero line.
Wave 5 target is approximately located at $15000 – there I am going to enter the positions with 60% of deposit. I have already bought a little bit yesterday at $15800 and today temporarily closed these positions. Good CPI data pushed the price higher, but data cannot change trend, remember it.
Best regards, Ivan

BTCUSDT - Phoenix Ascending BEARISHHi Traders, Investors and Speculators 📈📉
The markets have been trading bearish overall, with over 2 billion drained from cryptocurrency within the past 48 hours. This comes as no surprise to me, as I have been watching the DXY increase and the TOTAL crypto market show weakness. And so I made this idea a few days ago :
There is a possibility that we may correct towards the upside after this drop, we could even see a few altcoins increase over the next few days. However, the Technical Indicator Phoenix Ascending is showing that BTC is in trouble in the weekly timeframe, and if a reversal does not show up on lower timeframes, the next major support zone is only at $12500.
Looking for some hobbies or side hustles that make money? Check out these ideas 👀
_______________________
📢Follow us here on TradingView for daily updates and trade ideas on crypto , stocks and commodities 💎Hit like & Follow 👍
We thank you for your support !
CryptoCheck


BTC FINDING BOTTOMBtc crashed from 21k to 16k and finding its support, According to my analysis Btc Bottom might be 12k as there is the good support and it will also complete its AB=CD pattern and there might be the reversal.

BTC/USDT - Key Zones To Watch 👀In the wake of one of the craziest weeks in crypto history, we look at the BTC Daily chart.
There's 2 zones to keep an eye on in both the short & mid term.
That being the $16-20K we find ourselves in now
And the "doomsday" zone of sub-$13K BTC.
We have to consider just how systemic the FTX situation is with the amount of assets they might have pledged as collateral via Alameda.
Combine that with an overall bearish macro situation, that doomsday zone sounds evermore likely.
Nonetheless, we will always remain LONG TERM bullish on crypto, however in the short term we'll be eyeing some nice scalp/swing setups, along with great HODL entry points for longer term investing.
Either way - keep your head on a swivel. Crazy times!
-TucciNomics
Chief Overlord, AlgoBuddy

BTC is going to Complete the right shoulderBTC is supported at this price and going to complete the right shoulder of the pattern.
if nothing happened outside the Market. it can go up to 50000...

BTC Daily TA Neutral BearishBTCUSD daily guidance is neutral with a bearish bias. Recommended ratio: 40% BTC, 60% Cash.
* BOUNCE WATCH . Midterm elections are still undecided as results from Arizona, Nevada and Georgia are still being tallied. US October CPI report is due at 830am today , if it comes in lower we may get an intraday pump but the longer term trend is still down. In what feels like the most hectic two days in Crypto in a long time, Binance backed out of their bid to acquire FTX after looking into their balance sheet. Justin Sun tweeted that him and his team are putting together a solution for FTX ; FTX retweeted it . When LUNA/UST depegged and entered a death spiral on 05/07/22 - 05/09/22, Bitcoin went down 30% from 05/07/22 - 05/12/22; the FTX fiasco has brought Bitcoin down 25% from 11/08/22 - now. Cryptos are currently correcting up after a sharp downturn. Equity Futures, JPYUSD, GBPUSD, EURUSD, Natural Gas and Agriculture are also up. Whereas DXY, Long Term US Treasuries, HSI, NI225, Gold, Oil and CNYUSD are down. The third GDPNow US Q4 GDP estimate came in at 4%, up from 3.6% on 11/03/22 .
Key Upcoming Dates: US October CPI at 830am EST 11/10; UofM November US Consumer Sentiment Survey at 10am EST 11/11; Fourth GDPNow Q4 GDP estimate 11/16; Russia/Ukraine Grain Deal Expiration on 11/19; 2nd Estimate of US Q3 GDP at 830am (EST) 11/30; Last FOMC Rate Hike Announcement of 2022 at 2pm EST 12/14 . *
Price is currently bouncing off the uptrend line from March 2017 at ~$15750 as support and is also testing the descending trendline from November 2021 as support at ~$16700. Volume is back down to being Moderate (high) after reaching an all time in yesterday's session and is on track to break a four session streak of seller dominance if it can close today's session in the green. Parabolic SAR flips bullish at ~$21100, this margin is bullish at the moment. RSI is currently exhibiting bullish divergence with Price and is currently trending up at 32 after bouncing off of 25.60 support; the next resistance is the uptrend line from 01/22/22 at ~35. Stochastic is currently trending sideways and forming a trough at 6.50, a break above ~12 would be a bullish crossover. MACD is currently trending down at -449 with no signs of trough formation and is at risk of losing -232 minor support. ADX is currently trending up at 25 as Price continues to see selling pressure, this is bearish at the moment.
If Price is able to defend support at the descending trendline from November 2021 at ~$16700 then it will likely aim to retest $19417 resistance . However, if Price continues to fall below the uptrend line from March 2017 at ~$15750 , it will likely test $13477 minor support . Mental Stop Loss: (two consecutive closes above) $16700.

Bit coin: In BITS & Pieces.BTC is down 60% for the YTD period and one year period. The prelim analysis shows that the price should be ZERO,yes you read it right.
Disclaimer: Have been a Strong opponent of these sham currencies. But current PT is purely on the technical factors. The breakdown of the current levels of $18,750 ( which was the top and point of reversal in Dec 2017) would be the final nail in the coffin!.

Bitcoin-BTCUSD_W Double Top Pattern Next 12000$Bitcoin-BTCUSD_W Double Top Pattern Need To NeckLine Breakout than next is 12000$ if pattern is complete otherwise market going up and next target is 36000$, Let see market condition. share your opinion in comments, like share and follow me. Thank you...
Monthly Chart double top pattern formation

Bitcoin BTCUSD_W 12 May 2022 i was post next is $12000 See My OPBitcoin BTCUSD_W 12 May 2022 i was post next is $12000 See My OP

BTCUSDThe Godzilla will always find a resting place deep in the sea before it gains the energy to fight on the land. This is the same view I have with BTC, it looks like it loves its resting place at 200MA's before regaining its energy to rally. I am not saying that I am absolutely right, if I'm wrong then I am wrong. But looking at the pattern, still it couldn't convince me that price will make a reversal anytime soon.
In fact, in my opinion, it will keep continue resting until the 20k level, and you know what, it still won't make any difference until any price emerges which shows buying power overcome the selling pressure. It may also continue downwards to 6k level if sentiments continues, there is a chance that it will never go up.
Good Luck.
