Bitcoin's ABCD: 2020 Twin Move - X2 Ahead!Hey crypto enthusiasts! Today, let's unravel an intriguing aspect – how Bitcoin seems to be tracing its own financial history, akin to a monetary déjà vu.
We're shedding light on the patterns from 2020 and how they're mirroring the charts in November 2023.
📈 Identifying Patterns: ABCD and Rising Channels
Ever engaged in detective work with Bitcoin charts? Well, it turns out there's a recurring theme – the ABCD patterns and those rising channels.
What's even more fascinating? They're not merely repeating; they're unfolding in the same sequence and maintaining a comparable distance. It's almost like Bitcoin has a rhythmic financial cadence!
🔍 Are We on to Something?
So, here's the question: Could these patterns be providing us with insights into what lies ahead?
According to this investigative work, there's speculation about Bitcoin setting its sights on that $50,000 milestone real soon – perhaps before we welcome the new year.
💭 We Want Your Take
Now, we're not financial gurus, but you might be!
What's your perspective on this Bitcoin journey? Are we in for a predictable ride, or is this an entirely new financial voyage?
Share your thoughts in the comments – we're all ears!
🌐 Riding the Crypto Wave Together
As we ride the crypto wave, these déjà vu moments give us something profound to ponder.
Stick around for more updates and dive into the conversation.
The Bitcoin story is unfolding, and your insights might just be the missing piece to this financial puzzle. 💬🚀
Bitcoinforecast

Bitcoin's Price BalletSince its inception, Bitcoin has displayed a consistent price action pattern across cycles.
During bear markets, prices adhere to a singular trendline. When breaching it, Bitcoin enters a parabolic trajectory. Historical trends underscore this pattern: from 2012-2014, then 2015-2017. The 2019-2021 cycle deviated slightly due to the "COVID-puncture," altering the bull market shape. Ignoring this anomaly, Bitcoin's price aligns with its age-old parabolic curve.
While doomsayers predict a potential Black Swan event, with prophecies of a dip to 10K-16K, history informs us. The 2014 bear market ended with a double-dip bottom, akin to the 2018 scenario. Hence, the notion of a second dip lingers, urging caution. It's unwise to go all-in at any market point. HODL your Bitcoin, maintaining some cash reserves offers a prudent approach.
Additionally, observing the RSI on the weekly chart reveals a recurring pattern. The RSI typically ascends to the 70 level as the market exits its bottoming phase. This repetitive behavior underscores Bitcoin's cyclical nature, offering strategic cues for seasoned investors.

We'll See What Happens Next! [Short-Term Forecast]In this video we discuss the Bitcoin forecast as we finish out the rest of the year (Crypto Spring). We are keeping an eye on the triangular area between the Maximum Halving High Pressure Zone and the Future Halving Price Line and the potential that bitcoin could meet significant downwards pressure in this area. Also, we're looking at the 365 Day Moving Average, as it continues to trend below the Future Halving Curve (The Jet Stream). Historically, If we finish out Crypto Spring with the 365 Day MA below the Jet Stream, the Bitcoin price would trade mostly below the Jet Stream up until the halving date. What are your thoughts? Thanks for watching!

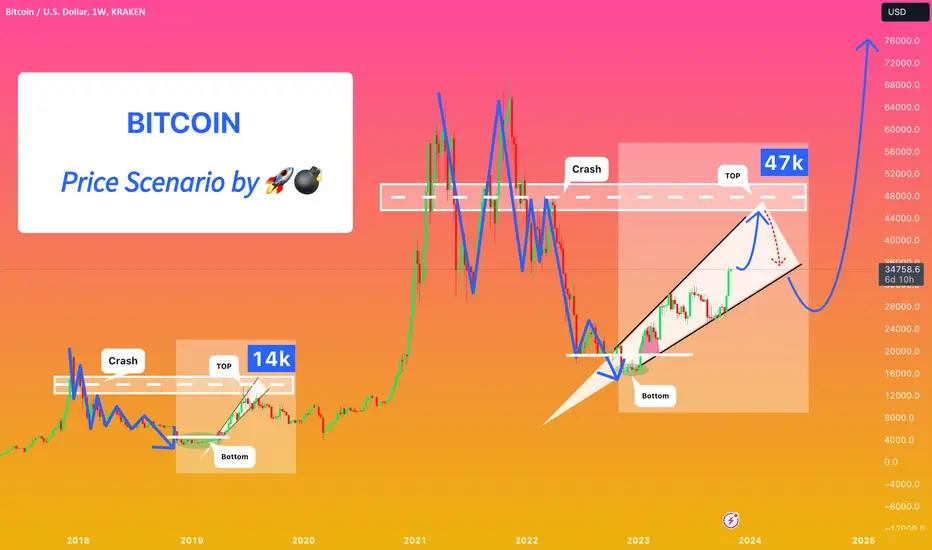
RB Calling for TOP! Comparing Bitcoin's 2019 Rebound with 2023.Hello my dear readers!
Many of us find themselves drawing parallels between past and present, searching for clues about what the future holds for Bitcoin. In this analysis, I will explore the comparison between Bitcoin's market bottom and rebound in 2019 and its current resurgence in 2023.
Can we project a price target of up to $47,000 based on this analysis? Let's dive in.
Resemblance to 2019:
Upon closer examination, it becomes evident that 2023's Bitcoin market rebound shares remarkable similarities with the 2019 scenario. The patterns, trends, and key indicators align in a way that raises intrigue among traders and analysts.
Inverted Wedge Formation:
One compelling aspect is the formation of an inverted wedge pattern. This pattern, which commenced right at the market bottom, is strikingly reminiscent of the conditions observed in 2019. The inverted wedge is a promising sign for traders, as historically, it has often preceded significant upward movements in Bitcoin's price.
Crash Patterns:
Another interesting facet of this comparison is the resemblance in crash patterns. The crash pattern observed in the current cycle shares characteristics with the previous one, yet it appears more condensed and narrow. This contrast becomes especially evident when compared to the flatter pattern that prevailed in 2018-2019.
Projection for Bitcoin's Price:
Based on this analysis, there is a potential projection of Bitcoin's price targeting up to $47,000. This projection aligns with the trends and patterns observed in both 2019 and the current market, offering an exciting prospect to monitor in the coming months.
As we observe the ever-evolving dynamics of the market, this comparison between the events of 2019 and 2023 serves as a captivating reminder of the intriguing possibilities and patterns that have the potential to shape Bitcoin's journey.
While I cannot predict the future with absolute certainty, my mission here is to empower you with my detailed market analysis and insights.
💛 If you've journeyed this far with me, why not show your support by hitting the ' boost 🚀' button and following my page? And if you're already a subscriber, feel free to share your thoughts in the comment section below.
Do you spot a correlation between these two periods, or do you anticipate a different trajectory?
Always Yours Kateryna 💙💛
😱 BITCOIN PRICE PREDICTION 2020/2021 😱 NEW PHASE ‼‼‼Here is the update on history of Bitcoin. NEW +1 Phase spotted. I find 7+1 Phases of the bitcoin from the top of 2013.
1. Descending Triangle Phase
Price in form of triangle, in 2013 this pattern last for about 398 days.
In the 2018, we can see similar triangle shape and price last here for about same period in 341 days. Next phase
2. Ascending Triangle Phase
After breakdown of the phase 1, market in 2014 moved down and in start of 2015 formed Ascending triangle shape within 186 days. Now look at 2018/2019 zone of Ascending triangle , similar shape, similar period of 155 days. Next price moved upside to next phase.
3. Flat Zone Phase
After moving upside price stuck in Flat zone for the 149 days in end 2015 and beginning of 2016. In middle of 2019 price stucked in similar Flat zone for about 162 days. Then we moving to next phase
4. Inverse Triangle Rise Phase
In this zone we see about 105 days of rise in between middle of 2016. Here is highly debatable, but looks similar in end of 2019, you can see similar rise within 107 days. What happened next is phase of sudden crash.
5. Sudden Crash Phase
So you see the 4th phase with 107 days rise, then within just few days price suddenly crashes in end of summer 2016. Same Sudden Crash happened in fears of COVID-19 in March 2020, right after Inverse Triangle Phase (4). Now move to phase 6.
6. Lack of Certainty Top
In the end of 2016 we see the small volatility movement below resistance line and before this Top zone, we see steady rise for 153 days, before the market breakout from resistance line. In the 2020 we see steady rise after Sudden Crash (5) for about 156 days. Now price approaching resistance line without big volatility . Here is the prediction starts, in 2017 after breakout we faced 7th phase.
NEW. 7. ATH Volatility Spike
In the beginning of 2017 you can see green rectangle - at that time price approached 2013 ATH ($1150) and looks like there price start to jump really fast. Price made a pullback from ATH and then tried to break it, showing false breakout and then only at third attempt it broke the ATH level and Parabic started
8. Parabolic Rush Phase
So after the breaking out from resistance line in early 2017, Bitcoin price started to grow, and after crossing previous highs market flooded with new traders and fresh money, which caused insane growth of the price for abut 357 days. Will this phase repeats after we cross 20k again? This is topic for discuss :)
👉 What price do you think we will face during end of 2020 and in 2021?
Stay tuned, have a good profits
Appreciate your likes and subscriptions
This is Artem Crypto

Next bull market starts by March 2023Hi fellow cryptopians and crypto enthusiasts. I am going to make a fairly bold claim here today.
First off we have a bitcoin hash ribbon buy signal quickly approaching us (within two weeks) which could pump us to 50k. If this does happen it should be followed by a correction that gets boring for 4 to 5 months and should spark the new bull run by march 2023 the latest.
This analysis should not be taken as financial advice as it's just for fun but lets follow and see where it leads.
Having said all that I do believe the bottom is in and we are a very strong accumulation until march or mid next year.
*
Patience is key to success*

BTC - BITCOIN LEGACY - the big dogBTC - BITCOIN LEGACY - the big dog
took a look at this beast on the monthly; going to keep an eye on this one as we go forward as a zoom out reference.
its all there on the chart, two obvious comparison periods. now check the momentum levels. tbf we have macro disasters left right and center, so these levels make sense.
maybe a good long term map here;
im thinkin if it continues to break down here it'll prob go lower than people think.. if it holds this price level approx then keep accumulating those hot alts from the bull, they'll prob bounce harder.
gl

Is Bitcoin building up for a big move?
This month, BTC teeters on the edge, poised for a breakout or breakdown. Watch key levels: resistance at 31K and support at 25K.
Crucially, the price nears the triangle apex. The closer we get, the more explosive the breakout. Stay tuned!

Bitcoins next 6 months outlookBitcoin is still clearly in the bear market and won't make it's initial big push out for 6 months most likely. This should be good news to you if you are stacker. The bears have a strong hold over price action, but as we can see on the RSI, the hold is weakening with bullish divergence forming in this underling indicator that simply determines "relative strength". If bitcoin maintains this divergence you can expect a very quick price pop up by the end of the month (seems likely) . The down trend resistance levels are color and thickness coded by strength. Each time any one is conquered, meaning a break above and stay above, our attention is then focused on the next one until all are broken and defeated.
Stronger to weaker
RED
ORANGE
GREEN
BLUE
Thanks for looking at my chart and leave a comment on what you think. My chart is educational analysis and is not to be taken as financial advice. We are all here to make money and limit our risk is the best way to do so. Contrary to the news, from what the chart is showing us... it's telling us that risk is low, the RSI has bottomed and showing signs of strength.
* Bear markets are buyers markets, Bull markets are sellers markets*
PS: The arrows are only examples
Once again... thanks,
WeAreSat0shi
Stay Blessed!

Bitcoin (BTC) is Turning Up in H4Technical Analysis:
- BTC is doing wave (3) in blue which is part of wave ((1)) in black
- When wave ((1)) is completed, we expect a ABC correction in wave ((2)) in black around at 32,500
- H1 & H4 right side is turning up
Technical Information:
- We only consider the buy opportunity in wave (4) in blue once it's completed

Bitcoin scary scenario for all of usHello Traders,
Everything is on the chart. First of all, this is not my preferred scenario, and I still believe we won't see new lows unless we experience another Black Swan in the market, and we have to be prepared for any outcome.
The bottom could be in before Bitcoin ETF acceptance and Halving.
This scenario has a 20% chance of occurring imo.
Please see my previous idea about Bitcoin, hit the boost button, and follow me for more ideas.
Thanks.

Is BITCOIN hinting at an upward rebound? Long trade #3Hello colleagues! We are continuing our new section of clear trades.
Today we'll talk about BTC. In the previous trade , we correctly identified the direction of the market. However, the market did not give us the opportunity to enter a position where we were safe:
Today, we will try to catch a short-term trade within the consolidation.
Since 15 August, the price of BTC has fallen aggressively by 14%. Since then, BTC has been trading in a narrow range of $25800-26900 . Such a weak reaction from buyers can indicate two things:
- The market is very weak and will continue to fall in the short term
- Buyers have organised a range to gain positions and the cryptocurrency market will continue to consolidate for some time.
Given that the price is now near the lower boundary of consolidation, it is quite logical to try to catch a long trade.
Why is the entry point below the liquid range?
As you can see on the chart, we believe that the strong liquid zone is in the range of $25800-25880. However, if you open the 15-minute timeframe , you can see an interesting pattern:
In addition to the fact that trading volumes are growing near the $25800-25880 range , you can see that BTC's local growth begins only after a false breakout of an important liquid zone. After a false breakout, a retest takes place, and only then does the price of bitcoin head towards the upper boundary of consolidation.
Bitcoin is a short-term trade:
Given this pattern, we expect to catch a long trade:
#BTCUSDT
2h
Enter = 25665
Stop = 25276 (- 1.5%)
TP = 26921 (+ 4.9%)
P/L ratio = 3.23
To be on the safe side, part of the position can be bought at $25665 , and the other part after the rebound and retest of the $25800 range.
What do you think of this trade and what is your vision of the bitcoin market? Write about it in the comments!

Either we end the bitcoin accumulation period as 2015 or 2018. Accumulation period as 2015 we make a double bottom or lower low with liquidity grab at 16.5-17.5K and have range at 19-21K which gets over pretty quickly (fractal in pink)
Accumulation period as 2018 we make ~84% down moment at 12-14K and have range at 14-16K which gets over pretty quickly (fractal in Blue)
My stomach says it will be 2015.

BITCOIN - NO BULL RUN TILL MARCH 2024This Bitcoin chart right here is a monthly timeframe chart. We all have been expecting this bear market to be over but it keeps deceiving us. Here is a clue on what to expect in the coming month.
Based on 2017 bear cycle that lasted for 27 months (821 days) as displayed on the chart, we see the current 2021 bear market following the same trend.
We have four phases here and the number of months each lasted for
The All Time High - All Time Low (12 Months)
The Bull Trap (6 Months)
Accumulation Phase (9 Months)
And finally the;
All Time Low to All Time High (13 Months)
Comparing the two bear market together, we have completed the first two phases and we are in the accumulation phase.
Therefore, we have till February 2024 to accumulate our favorite gems before a bull run will kickstart.
Not a financial advice🙅🏼♂️
Share your opinion in the comment section✍️
Please support this idea with a LIKE👍 if you find it useful🥳
Happy Trading💰🥳🤗

Bitcoin analysis in daily timeConsidering that extraterrestrial beings also use Bitcoin for their financial transactions, we should not be left behind...
Bitcoin will definitely have a temporary drop and then a significant rise.
We are waiting for shopping areas for spots. Two areas are considered. In the lower area, we reduce the average purchase price.
The minimum profit of this business is 40%.
We will definitely act smarter than the UFO owners.
Not financial advice

TheKing Still Bullish- Despite the silvergate mini Fud, BTC still on his consolidation trend.
- this Fud just caused a faster mini retracement but it would have happened anyway.
- Next Fud could concern Stables Coins, They are trying hard, no smoke, no fire.
- Whatever, at one point BTC will go his natural way. up!
-----------------------------------------------------------------------------------------------------------------
- For now look at the Graph :
-- BTC still evolving and bouncing on Tenkansen (Yellow Line)
-- Senkou Span is making a flat line around 32k ( Violin Line)
-- can notice a first support around 21.3K (Tenkan) ( Fibo 38.2% Retracement )
-- can notice a second support around 19.2K (trend) ( Fibo 61.8% Retracement ) (CME GAP 20.9k -19.9k)
-----------------------------------------------------------------------------------------------------------------
- imo not a time for trading for a long term investor, just watch.
- if you are a Scalper, that's fine, just use a tight SL.
- Any Fuds coming and any lower prices are fire buy at the good zones.
- i will comment this post with some older analysis so you will get the scheme more clearly.
Happy Tr4Ding !


Price Pattern Repeat! Quick #BTC chart analysis 📈Today, we're comparing the current price chart with the 2015 - 2017 cycle.
The cycle of 2015 - 2017 is highlighted in green, juxtaposed with the current cycle. Just observe how the modern price dynamics are mirroring the prices of 2015 - 2017. Our correlation coefficient? A staggering 80% plus. 😮
Without any extra strain, the resemblance in price charts is striking. In the past, price consolidation was a long game (it was a sideways trend), followed by a strong pump and liquidity collection above local maximums.
As of now, the price is also consolidating over a significant stretch of time. If the price dynamics continue to follow the fractal of 2015-2017, we're looking at a potent price movement in the very near future. Should the movement be upwards, which is the more likely scenario, our potential target rings up at $42 - $48k. However, if the movement tracks downwards, an approximate level of $22k will be the movement's target, also serving as an ideal opportunity for an advantageous buy. 👍
P.S. The bull market is still a bit undercover, but a careful glance at the chart reveals it's been on the roll for half a year already. Day by day, growth is set to accelerate, making the upcoming 1.5 years the perfect period for capital augmentation. Time to strap in for the 🚀🚀🚀 ride, folks!
All my 6 years of trading experience, knowledge, developments, and indicators I share them here in ideas for free. In return I will ask you just follow me, like this post and leave a nice comment, it will allow me to move faster and make more useful content! 💚💚💚

Bitcoin prediction in 1H time frameDefinitely, the price support of 29,500 Bitcoin is a fake support and will be broken soon.
This one-hour bullish correction is only to collect the energy of the next bearish rally at this time.
Let's not forget that Bitcoin is still bullish on the daily time frame and targets of $38,000 are available.
Not financial advice

Bitcoin is Unlikely To Outperform The Stock Market Again Above, you can see that Bitcoin is currently back to 2017 ATH levels when weighted against the S&P 500. In addition, Bitcoin has also sustained a breakdown below both long term trendlines against the index. I can't really be more generous than that. Even if stocks have already hit bottom, I think Bitcoin is unlikely to outperform again, at least for many years. If this is the case, can Bitcoin survive based on pure utility? Or is its utility also its value? This could imply that it is self-defeating.
In the summer of 2021, I still speculated that Bitcoin could have a final blow-off top. Bitcoin bounced from the first trendline and made a brief new all-time high, but did not manage to have the blow off moment many were expecting. Here is the original post, which was my first article to be featured on the front page of TradingView.
I also made a post in August, 2021 about Bitcoin's performance against different assets, noting its weakness against Tesla and relative strength against Gold. Now, Bitcoin is lingering right on the long term trend against Gold, and I would not be surprised to see that break down as well.
Even then, I was thinking Bitcoin could achieve Gold's market cap this cycle. This is why it's extremely important to be adaptive when investing. As I began noting towards the end of 2021, some warning signs started to crop up. Had I ignored these signs of weakness, I would now be staring at altcoin bags that are 50-95% down from where I sold them back in January, leaving a lot of profit on the table. Now I'm cash heavy, but what to buy? Crypto no longer seems particularly attractive to me from a medium-term standpoint. I think the speculation phase is over, and if crypto can't prove itself "necessary" for society, it can just fade away. These breaking trends tell me as much. Even Ethereum failed to make a new high against Bitcoin this cycle, essentially proving the entire altcoin market as a grand charade. The implications of these failing trends are quite awful for Crypto, unfortunately.
This is what has happened to Bitcoin since it broke down from the long term uptrend against TSLA:
This is especially concerning, considering many would also argue that TSLA itself is overvalued. This implies logically to me that Bitcoin can fade to extremely low levels, particularly if traditional markets have not yet found bottom.
You can make as much hopium TA as you like, but I think this simple observation will weigh on long term sentiment for market players as they slowly take notice. Institutions and billionaires have piled into the new asset class because it experienced some years of outperformance. This chart shows that this current period of underperformance is likely to continue.
I think this is incredibly important, because it impacts where people decide to invest, once all the dust settles. Based on the trends I noted above, I think other investments will perform better. I believe there will be plenty of time to figure this out as we experience a massive re-allocation of capital. Now is not necessarily the time to rush into any investments. There are lots of losers during this downturn, but if one managed to profit from the big run up this seems to be a good time to sit back and re-evaluate priorities. That's what I'm doing.
This is entirely my own opinion and should be used for speculative and entertainment purposes. Not financial advice.
-Victor Cobra

The Market Requires A 100%+ Move - Will Buyers Save Bitcoin? Here on the left, I've shown the BLX chart (Bitcoin index with the longest price history, plus its log curve) and the broken long term uptrend on the Litecoin chart on the right. Why Litecoin? Well, the 2017 bull market was characterized by astronomical gains for Bitcoin alternatives. At that time, it was about which functioned as the best currency. Litecoin and others were seen as faster, cheaper alternatives to Bitcoin. Litecoin supporters mark a bit of a cross-over between those who believe proof-of-work offers the most secure, stable network and those who prioritize cheaper transactions. Although Litecoin and other currency competitors did well in 2017, they underperformed in 2021, outclassed by coins associated with DeFi, memes, NFT's, the metaverse, and staking. This past bull run was characterized by which had the best "value" proposition and/or the best memes. Needless to say, much of this has already gone up in smoke.
The issue is, the "currency" coins have not held value either, retreating all the way back to levels from the 2018-2019 bear market, while Bitcoin itself barely maintains its price above the 2017 all-time-high, between $19800 and $20100. Most people did not think this was possible a few months ago. Many were still convinced that Bitcoin would hold above $28800 and maintain a bullish trend. Litecoin has broken its long term uptrend, and arguably needs to go up a whopping 4x in value quickly in order to regain the trend. Yet, a currency does not necessarily need to appreciate in value over time. We're now in the utility phase - cryptocurrencies need to prove they have some sort of necessary use-case outside of value appreciation.
Speaking of long term value - we're now at a moment where if the bottom is NOT in , there's very little historical Bitcoin trend support until nearly $9k, where I've drawn my log curve. And I've drawn it generously - I've noticed that before this crash many were drawing their curve so it cut out the COVID crash, seeing it as an anomaly. But if that was an anomaly, what is today's price action?
For many participants in the crypto market, the bottom MUST be in, or at least we must be very close to it. Bitcoin likely could not experience anything greater than another 50% decline from the most recent low ($17600) before total implosion, at least according to the log curve. Some would argue that the market has already imploded, but it seems merely that the over-leveraged players are getting consumed by those with deeper pockets. Just because the smaller, riskier lenders have fallen, does not mean the market is immune to continued systemic risk. The bigger fish need to attract more buyers ASAP, and the bounce needs to be huge - I'm talking a 100% increase at minimum.
So then, the question becomes: What is the probability that Bitcoin will double from current prices and get back above the $40k level in coming weeks? I believe the market needs to see something like this, in order to prove it has any legitimacy as an "asset class." Otherwise, I think this was the final bubble for Bitcoin and crypto. I mean that seriously. Either of these scenarios would work, to inject confidence back in the market, though of course the blue is more severe.
As I've said in my recent posts, any kind of bounce would be perfectly reasonable from these levels - buyers, you're welcome to that $20k Bitcoin at any point....a lot of people are waiting for you *evil smirk, impersonating big exchanges*. My point is that the bounce needs some SERIOUS oooomph behind it. Rising slowly to $33-34k over the course of several weeks just wouldn't do the trick, and it would provide the opportunity for longer term moving averages to solidify themselves as resistance, and could even allow the 200 week MA to flatline and roll over to the downside.
TL/DR: Bitcoin needs to show buyers have strength to take it back to $40k+ quickly, even if it's just an initial impulse, to inject some confidence and liquidity back in the market.
Now, for the warning signs, and what limits the probability of a 100%+ up move.
BROKEN TRENDS
I'll begin by posting a chart of a seemingly random altcoin - TRX.
I think this one is significant because of Justin Sun's relationship to Binance, his own algorithmic stablecoin (USDD), and its apparent refusal to break down from its distribution range. Of the coins I've followed, its the only one that has not dropped substantially, although it finally broke its own uptrend. This shows there is still significant downside risk in pockets of the market.
Something I've been watching for roughly a year now is the ratio of Bitcoin against the S&P 500 index (SPX). It has now experienced an extended decline, interrupting a decade of outperformance.
Based on the above chart, Bitcoin needs to triple soon (at minimum) to regain the trendline and show strength against traditional assets. My theory (as it stands) was that Bitcoin only outperformed because the market expected it to become mainstream one day, and be touted by billionaires and celebrities. Now that it has achieved fame, there is not much to speculate on anymore.
Bitcoin also needs to move up substantially against Gold, in order to continue capturing the "store of value" market share. Currently, it's below the 2017 all-time high, and resting on the highs from mid-2019. Gold is dropping substantially at the moment, so this provides an opportunity for Bitcoin to show some relative strength. But does it have enough fuel to get back above 18-20x and the long term trendline?
If Bitcoin's value proposition TRULY lay in its scarcity, then why did the market find the need to create thousands of other coins? Humans are greedy and expansionist in nature. Sure, having a limited supply of something and conserving it can teach humans to save and to prepare for the future. But in the end, as I've said numerous times, cryptocurrencies are not a resource. Bitcoin *could* be a commodity, but again, the market does not see it as such, which can be viewed in the simple Bitcoin Dominance metric, and implied by its decline during a period of high inflation.
I find that the Bitcoin Maximalist ethos is really about preparing for disaster. But to me, the most important things one can do to prepare for disaster are: CONNECT WITH YOUR LOCAL COMMUNITIES IN PERSON, develop a valuable skill or trade, and manage your risk.
Interpersonal trust is extremely important. This is how movements and change occur, not by building a hypothetical simulation of trust through algorithms on the Internet.
In addition, BACK TO LITECOIN - this thing has now dropped all the way back to its accumulation range from the previous bear market, showing that the last halving did nothing to increase the long term price floor for the asset. Will the same happen to Bitcoin? Litecoin appears to be in danger of heading back to somewhere below $10, should it not QUADRUPLE in the coming weeks.
What does this all mean to the buyer?
This means it's time to position oneself relative to risk tolerance. If you feel there is even a slight probability crypto will be saved by the big buyers, then now seems a decent time to allocate whatever percentage of your liquid capital to this crazy market and just hope for the best. For me at the moment, that's a little under 5%. For some, 5% might be a lot, for others, not so much. The way I see it - if I'm going to increase my exposure back to something like 10%, that's risking 10% for the potential to double my entire capital, since many altcoin projects could rebound 10x from here. That's my absurd logic, and is clearly only gambling. So, in my trading, I'm still considering putting a little bit back into the market near current levels. Yet, something holds me back - I think it's that my belief in the space has waned over the last couple years and I don't see much meaning in buying anything for the long term at this point. I'd rather focus my resources elsewhere. Nevertheless, I continue to post on here, cataloguing my ever-evolving thoughts on the market, and the fascinating history of humankind.
This article represents the opinion of the author, and is not meant as financial advice. It is meant for speculation and entertainment only. Please consult with a professional financial advisor before making significant financial decisions.
-Victor Cobra

BTC (Bitcoin) Analysis 20/03/2021it seems bullish to us yet
there are total of 3 Take profits if price doesn't break bellow 41000USD Support
3 TP is confirmed if the 2 TP triggers followed by some price correction and Retracements

The Bitcoin ETF news will not generate new highs (for now)Bitcoin has one clear level to break, which is the resistance of 30k to 32k. I'm observing that more people are starting to become bullish on Bitcoin, especially now that there is bullish news coming out, regarding the ETF of the biggest crypto today. I do believe that it is too early to celebrate.
As we can see on the chart, Bitcoin has already tried to break reisstance for the past 4 weeks. It failed to 4 times in a row and it looks like we're staring at the finaly rejection before the bigger correction.
I am still bullish on Bitcoin and i'm not trying to spread FUD. Only for the short term, I expect Bitcoin to experience a correction.
