Bitcoin 3000% grow-100K in Dec 21 2021-Big buy opportunity NOWHello everyone,
I´ve spend many days watching the Bitcoin tickers at many timeframes for many years and I realized this is the ultimate chart with important trendlines / gread & fear (based on RSI) / halvening setup which seems to be respected for many years & in my opinion from long tern perspective investing this Weekly chart is most important history based technical support for your plan.
So if you find this chart helpfull would be great if you reward my time & work by hitting like and if you want to stay updated then hitting follow is highly appriciated and makes me motivated in updating the data for you in public library.
MAJOR RESISTANCE
6.000 - 8.500 - 10.000 USD ( Need to be eaten till halvening to validate the idea)
It's amazing to think about the fact that currently 80% of all the Bitcoin that will ever exist has already been mined (and almost 25% of that current total has already been lost forever), and that almost all the rest will be mined in just the next 6 years bringing the total mined to 93.5% by 2024, leaving only 6.5% more left to be mined between the years 2025-2140.
Supply and demand + greed and fear = cycles
What is Halvening in Bitcoin and Other Cryptos
In Bitcoin, halving is when block rewards for mining are cut in half. Halving happens at regular intervals based on the Bitcoin protocol.
In other words the code underlying the network dictates that X new coins minted as mining rewards for miners adding blocks of transactions to the blockchain will be cut in half every Y blocks until the reward reaches zero and no new coins are mined.
Bitcoin halving occurs every 210,000 blocks.
Since one block is added to the Bitcoin blockchain roughly every 10 minutes, each halving is about 210,000 blocks x 10 minutes = 2,100,000 minutes = 4 years apart.
When is the next Bitcoin Halving: Assuming no major changes, the mining reward will drop from 12.5 BTC to 6.25 BTC per block in May 2020
---------------------------------------------------------
What happens when all the bitcoins are mined?
The bitcoin inflation rate steadily trends downwards. At the time of writing, more than 3 out of every 4 bitcoins that will ever exist have already been mined, and the annual inflation rate is just 4%. The block reward given to miners is made up of newly-created bitcoins plus transaction fees. As inflation goes to zero miners will obtain an income only from transaction fees which will provide an incentive to keep mining to make transactions irreversible.
Due to deep technical reasons, block space is a scarce commodity, getting a transaction mined can be seen as purchasing a portion of it. By analogy, on average every 10 minutes a fixed amount of land is created and no more, people wanting to make transactions bid for parcels of this land. The sale of this land is what supports the miners even in a zero-inflation regime. The price of this land is set by demand for transactions (because the supply is fixed and known) and the mining difficulty readjusts around this to keep the average interval at 10 minutes.
** This is attempt to predict future price movement & not a financial advice **
Bitcoinforecasting

BTCUSD - 1W Chart AnalysisAfter several failed attempts of crossing the 20 days Moving Average and changing the trend from bearish to bullish, we all remember the big drop which happened in November when the total market capitalization has significantly decrease and Bitcoin lost almost 44% from it's value.
Since then, we could see a period in which the price has been moved sideways staying in between the Resistance Level of 4403$ and the Support level of 3238$.
As we have already been accustomed to the market's evolution in the last year, we could see that this periods in which the price is moving sideways are just temporary and are also separating the ones in which the price is moving aggressively in one direction or another so maybe we shouldn't be surprised if the price will accelerate it's movements anytime soon.
From the technical perspective, the indicators are almost showing the same direction as it follows :
* The Stochastic has an "oversold" position but it's "fast" line is still below the "slow" one, meaning that there is no sign for a change in the price direction yet;
* The RSI has the level of 34 but it has been constant for more than one month, meaning that the sideways movements of the price may continue, at least for the short term;
* The MACD is still below the Signal, meaning that the price has big chances to continue it's slight decrease, despite some positive isolated evolution;
* The trading volumes are also decreasing, suggesting that the price has big chances to continue it's drop.
If we consider only the technical analysis, we can say that a reasonable target price for the short term is 3238$, or 2646$ in extension.

BTCUSD - 4h Chart AnalysisAfter a period in which the trend was considered bearish, because the price was between the lower standard deviation of the Bollinger Bands and the 20 days Moving Average, this one has crossed the latter and based on higher trading volumes it created a "break out" from the trend channel and also went through the first Resistance Level of 3463$.
From the technical perspective, the indicators are again in contradiction as it follows :
* The RSI is 66, meaning that the price is not considered "overbought" yet;
* The MACD is still above the Signal, meaning that the price has still more room to increase;
* The Stochastic has just registered a crossover, meaning that we might see the price changing it's direction anytime soon.
Although the general trend remains Bearish, it is possible to see the price reaching 3600$ in the upcoming hours before the market will continue to drop again.

BTCUSD - 1D Chart AnalysisAfter 11 days of sideways movements, the price of Bitcoin has started the year with the right foot and it had a progress of 4.97% so far.
The bullish trend has started on the 18th of December(on a 1D chart) and since then we could see 4 attempts of the price to cross back the 20 days Moving Average but all 4 were failed.
At this stage, the RSI is 51 so it can be considered "neutral", the Stochastic is close to have a crossover which will indicate a possible continuation of the uptrend, while the MACD is still above the Signal and it can be considered as a confirmation of this scenario.
Considering the trading volumes as well, we have to admit that these ones had better days in the past and any movement we are expecting it should't be to big.
Without any big fundamentals, there are big chances to see the price getting close to the Resistance Level 1 of 4283$ in the following days.

the people have spokenWe must go up first, i am aiming for 44 and maybe 51- everything is in the chart for you.

BTCUSD - 4h Chart AnalysisAfter it was dropping since the 8th of November, the price has managed to break the 20 days Moving Average for the first time in 4 days and it seems to start a slight sideways movement for the short term.
From the technical perspective the RSI has a neutral position, the Stochastic is indicating that the price may decrease while, according to the MACD, we can consider that there is still more room for a small increase.
Based on the trading volumes which seem to be slightly rising but also on the fact that after the price has crossed the 20 days Moving Average, a green candlestick was fully created we can consider a continuation of the ascending trend with a target price at 6485$.
On the other hand, if the price will go below the 20 days Moving Average, it will mean that the price attempt of changing the direction will be failed and a reasonable target price for this scenario will be 6389$

Prepare your short!Finally btc made some moves and printed a rising wedge, it's overbought on stoch and we have a TD8 on H4. We have a good RR for a short.

BITCOIN TO 61XXThe pullback to the untested level of 61xx is overdue. The chart describes pretty much everything. I see price making it up to somewhere close to the blue horizontal line I have and then a massive retreat down. With everyone turning into bulls very fast, dumpers have one more to go before the books get to bullish, and before they get bullish themselves! We don't have that many shorts to squeeze so I don't see a giant move up just yet. The drop will free the lower in the order book long liquidity after this corrective move, and then we board the Falcon Heavy. Hope this helps.
Oh- we might go a a % or two up first to free some short liq to drive down. Could be a fun opportunity to practice wick catching skillsz.
Though my ideas tend to work out don't follow this, this is not financial advice, and I would quite frankly do the opposite.
- Namnaste'
Cuz I catch wreck on any cassette deck- so ahead of my time my parents haven't met yet.

THE ONE AND ONLY BITCOIN FORECAST YOU WILL EVER NEED!!!I think this will go to $0 again.... no doubt...

BITCOIN UPDATE!Bitcoin is looking to start and already did start the wave 3 and all we should do now is wait for the pump and see where it takes us I have two targets for this pump as the market has not been clear. So in my previous chart I was saying that 7.1k is my target but now I can see that, this would then only be a 400 USD pump which is not what we expect from wave 3, so I now adjusted my targets so a sell off when we meet 7.1k and 7.3k and I think depending on which target we hit our re-entry will be different so my re-entries start from 6.8k and go to 7k if we hit 7.3k after which I expect Bitcoin to play around that interval for sometime till we start the next wave where we should hit sub 8kish area more accurately 7.8-7.9k. Checkout my other charts on Bitcoin which are linked below.
Good Luck, Traders! #moon #mooncommunity

Bitcoin another reversal possibility! Bitcoin is yet trying to make another reversal pattern, and last time I saw a reversal we were in this price area too but I was thinking the wedge is going to take us to the top of it so I predicted 10k but we got retraced to the start of the run so what I think might be going is this is might be a big bull run and we jut got wave 2 which can retrace 100% of wave 1 and wave 3 should be the biggest impulse but I personally don't think the big wave 3 will come, there will be another rally but not that big of impulse but as we are making a reversal pattern now we should first see how strong pumps will be to see where the market can take us.
With the news we have on ETF we can understand that chances of passing are not great so more fiat money entering the market to get us to new peaks does not seem realistic now however the technical probability in the last cycle when we saw similar reversal pattern and bullish signals on our indicators such as green waves coming back to the market on EWO and the market is oversold in 1d graph.
Below are linked trading ideas of altcoins which I think might be leading the next bull market. Coins to hodl long term : ADA, XLM, STRATIS, NEO, Monaco, XRP (these are my favourite alts the next run)
Good Luck, traders! #moon #mooncommunity

What is holding us down and where do we find good entries?BTC is having trouble penetrating the cloud and breaking the 100EMA. Also, in the same area is the 0.382 retrace of the move from 9990 to 5755. For swing trading we believe that this the middle of a no trade zone because of the bad RR. The 7780 – 7930 area should be treated as major resistance and the 7050 – 6850 area should be trated as major support. At these levels we will have good RR entries. If you bought the breakout of the IH&S now it could be a good time to take PARTIAL profits.

Bitcoin Today: Now with TusdPrice
BTCUSD did not manage to hold 8500.0 level yesterday and retraced downwards below the Bullish Trend Line. For now, bitcoin is trading above the 8200.0 level, the short-term price pattern looks bearish. To reconsider the bearish pattern we need to see a breakthrough of the Bearish Trend Line. Nonetheless, the take-off from the 8000.0 level, from a week ago, stays bullish. 8000.0 – 8200.0 zone should remain supportive. From the above, local Bearish Trend Line should be pierced to consider a turnaround movement.
Today forecast
Trading in the 8100.0 – 8500.0 zone.
Latest news
Binance adds TrueUSD(TUSD) today TrueUSD is basically a verified stable coin that is backed by a fixed value of the US Dollar. It is the first fully collateralized, legally enforceable and attested cryptocurrency that ensures you can redeem your US Dollars from TUSD.
TrustToken made the public announcement of its TUSD launch and Bittrex listing earlier this month and further mentioned: “The market has demonstrated that there is strong demand for a trustworthy trading pair between cryptocurrencies and US Dollars. TrueUSD’s presence on Bittrex meets that need.”
TrustToken also confirmed its registration as a Money Service Business (MSB) that will put them in a stronger position to prevent money laundering and frauds.
TrueUSD seems like an attempt to get the dollar substitute token created properly by addressing the problems Tether faces. Company spreads their message via its website that “We wanted a simple, stable coin, without the need to trust some company’s hidden bank account or special algorithm. Our legal framework enables you to exchange USD directly with an escrow account – we never touch the funds’’. TrueUSD provides stable currency with 1 to 1 parity. With all these features including financial services and exchanges, TUSD gives a tough competition to the older USDT.
To facilitate the USDT – TUSD transition process for those who wish, Bittrex listed a USDT/TUSD pair. Binance did not list USDT/TUSD quote for now.

Bitcoin Today. 8500, from here?Price
Bitcoin spent last days fluctuating around 8500.0 level. 8500.0 level lies close to the Bullish Trend Line and is considered an important support for the April – May bullish pattern. As long as the price holds above the Bullish Trend Line, the overall bias still stays bullish. Breakthrough of the Bearish Trend Line and 100-days EMA afterward would be required to confirm the return to the uptrend and testing the 10000.0 level. Dive below the Bullish Trend Line and 8000.0 support will lead the price into a deeper correction, probably to the 6000.0 levels.
Today forecast
Lateral trading in the 8200.0 – 8800.0 zone.
Latest news
Thailand Commences Cryptocurrency Regulations Today. The decree to regulate cryptocurrencies and initial coin offerings in Thailand goes into effect on Monday. The government has also revised the country’s tax code to add crypto taxation. Sellers of digital tokens will face a fine or even jail time if they fail to register with the regulator within 90 days. The Thai government’s decree to regulate cryptocurrencies and initial coin offerings (ICOs) goes into effect on Monday. The Digital Asset Management Act BE 2561 was approved by the Thai cabinet in March and has been amended since. The revision of the Revenue Code No. 19 was also announced in order to tax crypto profits at 15%, according to local media.
Zimbabwe Bans All Cryptocurrency Activity, Businesses Have 2 Month Grace Period. Zimbabwe’s central bank issued Circular to Banking Institutions No. 2/2018: Virtual Currencies, effectively banning all crypto activity in the African nation. Businesses dealing in decentralized currencies have 60 days to comply. Issued 11 May, the Reserve Bank of Zimbabwe, the country’s central bank, laid out seven points in ordering the shutter of things crypto within the southeast African nation. Referencing two previous circulars going back as far as three years ago, the notice explains “’banking institutions’ attention is once again drawn to the risks involved with virtual currencies and the need to ensure strict adherence to sound risk management. Our investigations have revealed that the major cryptocurrency exchanges facilitating the trade of virtual currencies in Zimbabwe are Bitfinance (Private) Limited (Golix) and Styx24. Golix has gone further to set up an ATM machine through which cryptocurrency transactions are facilitated.”

Bitcoin Today: Gates and Buffett against!Price
For the third day in a row BTCUSD going through a selling pressure, the pattern clearly looks like step-by-step sell-off of the currency. After the recent volume peak at 9330.0 level, the coin fell to the 9000.0 level + 100-days EMA, with low volumes, not finding a buying support. Breakthrough of the three-days Bearish Trend Line is required to consider a turnaround on the 9000.0 level. A strong support zone 9000.0 – 8800.0 stays below the price.
Today forecast
Lateral trading in the 9000.0 – 9500.0 zone.
Latest news
Bitcoin sinks after another critical comments Bill Gates and Warren Buffett. Warren Buffett commented on Monday, that “the asset itself is creating nothing” and that “when you’re buying nonproductive assets, all you’re counting on is the next person is going to pay you more because they’re even more excited about another next person coming along”.
Bill Gates states that Bitcoin as an asset class, is not producing anything and so you shouldn’t expect it to go up,” he said. “It’s kind of a pure ‘greater fool theory’ type of investment. I would short it if there was an easy way to do it.”
Bitcoin Cash vulnerability. .** On Monday, Bitcoin ABC said in a security advisory that a critical vulnerability has been found in Bitcoin ABC version 0.17.0 which has the potential to cause an unintended split in the Bitcoin Cash network. n order to exploit the vulnerability, an attacker would need to construct a malicious transaction which could be accepted into Bitcoin ABC and consequently mined into a block.
Once this block has been established, the block would then reject all other versions of Bitcoin Cash compliant implementations.
"The malicious transaction would contain the bitflag of 0x20 set in the signature hash type," the company notes.
If exploited, the security flaw could force a split of BUCash and versions of Bitcoin-ABC prior to 0.17.0 from the majority Bitcoin Cash blockchain. It is not known how other nodes may be affected.
"Bitcoin ABC will be taking several actions in order to prevent such an event from occurring again, as well as reduce the overall response time in the case of emergent issues in the future," the company added. "Additionally, Bitcoin ABC is in discussions with industry participants to establish a formal bug bounty system."
Miners using Bitcoin ABC are urged to update to Bitcoin ABC version 0.17.1 immediately to prevent the exploit of the vulnerability.
New York Stock Exchange Will Launch Physical Bitcoin Futures: Reports. That was according to the New York Times, which quoted documents and four anonymous sources “briefed” on a proposal for ICE to launch Bitcoin trading options.
If correct, ICE would become the second Wall Street giant to “go Bitcoin” this month, a week after Goldman Sachs appeared to confirm it would offer a raft of Bitcoin options. The outline broadly reflects Goldman’s initial approach, an executive hinting futures contracts would be the bank’s first offering, followed by more direct interaction with cryptocurrency later on.

Bitcoin Today: 9000.0 - false breakthrough, or stay?Price
A breakthrough above the 9000.0 level, which coincides with 100-days EMA, was accompanied by a noticeable volume jump. Today peak of volume distribution lies near to the 9250.0 price, which is halfway to the next resistance level 9500.0. The longer BTCUSD will hold above the 9000.0 level – the more confidence buyers gain to continue buying in anticipation of the 10000.0 breakthrough. Nonetheless, it is worth to remember that Friday will be the last day of the trading for April Bitcoin Futures on CME. It is believed that the approach of the closure and settlement dates on Bitcoin Futures contracts causes high volatility of Bitcoin as settlement is made in dollars, and the parties may need to sell large volumes.
Today forecast
Trading in 9000.0 – 9500.0 zone.
Latest News
Goldman Sachs Names Crypto Trader Justin Schmidt Head Of Digital Assets. Goldman Sachs Group Inc. has made its first crypto-specific appointment with Justin Schmidt, a former cryptocurrency trader, as the financial services giant aims to explore creating a bitcoin trading desk, reports said.
The bank spokeswoman Tiffany Galvin-Cohen was quoted as saying Schmidt joined the bank as a vice president and head of digital asset markets in the firm's securities division in New York on April 16.
Schmidt, who is a computer science graduate from the Massachusetts Institute of Technology, previously worked at quantitative trading firms Seven Eight Capital LLC and WorldQuant LLC.
Cboe Exchange Wants to Lower Its Bitcoin Futures Prices. The Cboe wants to change the way it prices bitcoin futures contracts, a move that comes just months after the exchange operator first debuted its inaugural cryptocurrency product.
In a newly published letter to the Commodity Futures Trading Commission (CFTC) dated April 17, CBOE Future Exchange (CFE) managing director Matthew McFarland announced a proposed rule amendment that would lower the minimum increment on its futures contracts from 10 points (worth $10) to 5 points (worth $5) sometime on or after May 1.
The move will have a "positive impact on the market in XBT futures," McFarland wrote.

Some BTC set ups to look forBTC has really struggled busting these highs. On ETH and XRP momentum was in our favor to put buy stops above and really play that upside. BTC should technically move to $8,800 but man has it been slow at breaking out. I would use caution trading BTC breaks right now.
I still prefer buying dips for SWING plays. ETH and XRP are really what's in play. But I will outline potential set ups.
1. Buy this break out for a further move up. (highest risk IMO)
2. Flipping BTC in this channel at the low $7,800 low for flips.
3. Wait for pull back and starting buying the dips how you want at these support zones. I will be playing it martingale style.
Your call on what you do!
Happy Trading,
-Sherem

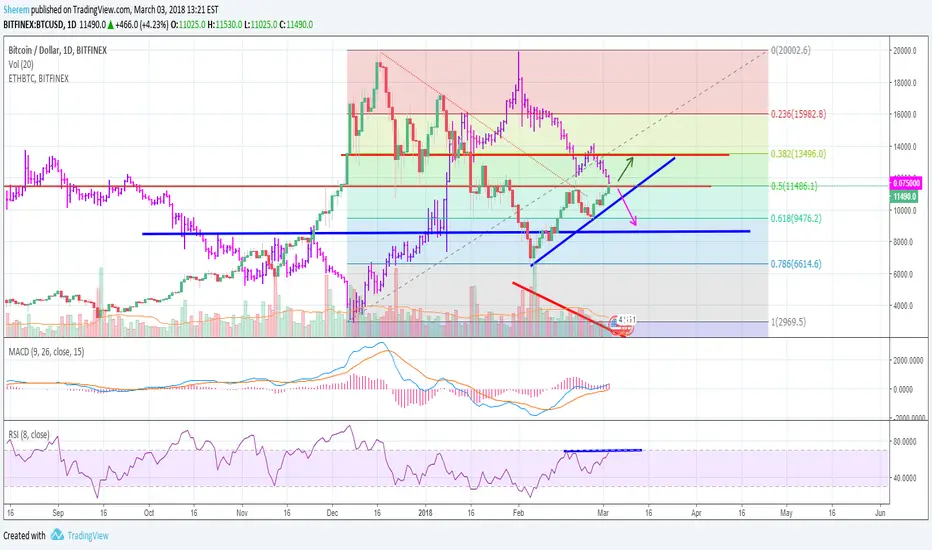
Ascend triangle on BTC, or Double top? BTC with ETH/BTC analysisIn this chart we have BTC/USD in the green and red bars, while ETH/BTC in the purple and magenta. I want to compare the two to really understand why BTC is moving up the way it is and identifiers that will help us know when it will reverse and a potential trade opportunity. This will help us know what to look when we enter and knowing why and how to be cautious.
If we look at ETH and LTC, it's clear that BTC has been dominating trading as investors are exchanging for BTC driving the price significantly higher. this has kept LTC and ETH suppressed while BTC has been driven up significantly. Before I get into specifics, let's examine a few important pieces going on with these overlays.
1.Timewise, the signifcant bottoms of ETH/BTC generally happen before BTC/USD and this time varies from a small time frame of 5 days to a much more significant time of upwards of 2 weeks.
2. The move's in ETH/BTC move much more dramatically than BTCUSD. IE: Early Jan we had ETH/BTC move up significantly while BTC/USD did not move down as much
These are important to notate as we look into why it could go up or it could reverse. It gives us a little extra insight as to whats going on and what to look for.
Signs we could keep going up:
1. BTC is forming a large ascending triangle
2. Strong MACD
3. If you zoom in on ETHBTC you will notice it's already broken it's low and looks to be heading lower. This gives it a lot of room to keep going down. I would guess it will at least go to that previous range which I have a blue support line on.
Signs we could reverse and go down:
1. Double top on BTC in conjunction with RSI double top??
2. ETHBTC is showing signs of RSI divergence on the daily chart. Are we close to bottoming there?
3. Low volume on this chart and on gdax. This is also confirmed by no USD buying power in LTC or ETH. Looks like we only been going up on shear crypto cross trading. This could be argued to be good or bad.
Here are some strategies to enter: BTC comes down to this 10,500 level and completes one more wave on this ascending triangle and then continues up. Lot of ways you can play it depending on how risky you want to be and depending on what it does from here. You can buy a potential dip, or wait for confirmation and buy the breakout. If we get confirmation that it does break out, I would look for a move to the upper end of the 12k mark, in the 12.9k range. Expect it to wander up like it has been. I would NOT go in heavy for this trade. the technical stops are either below 9.5 if you enter at 10.5k or just below the support line on the breakout.This has the potential of a reversing down hard so be careful.
A cautionary warning: We really need to wait for a confirmation to enter in a trade and watch it closely. My martingale trades early last month I felt much more confidence in and we made out great. This does show signs of reversing and we don't want to be caught with our pants down so enter with caution.
Happy Trading - Don't stress and pick your points!
-Sherem
Will BTCUSD (BitCoin) go all the way to $3,500? Here is our forecasting report on BTCUSD (BitCoins) for 2 February 2018. Based on our forecasting techniques, it would appear that USD3,500 is possible for Bitcoin. Will it happen? Let's monitor this very closely.
Good trading
NinjaSingapore
2 Feb 2018
DISCLAIMER
Our research materials are provided for information purposes only. They should not be used or considered as an offer to sell or a solicitation of an offer to buy any securities. The research materials are prepared for general circulation and general information only. They do not take into account the specific investment objectives, investment knowledge and experience and financial situation of any recipient. Investors seeking to buy or sell any securities discussed or recommended in our research materials, should seek independent financial advice relating thereto and make his/her own appraisal of the tax or other financial merits of the investment.
Any opinions expressed are subject to change without prior notice. Our research materials are based on information from various sources believed to be reliable. Although all reasonable care has been taken to ensure that such information is not misleading, we make no guarantee, representation or warranty, expressed or implied as to its accuracy, adequacy or completeness. We do not accept any liability whatsoever for any direct, indirect or incidental, special or consequential loss of any kind arising out of the use or reliance on the information in our research materials.
