Bitcoin Faces Resistance for the 7th Time—Breakout or Rejection?Bitcoin ( BINANCE:BTCUSDT ) is attacking the Resistance zone($107,300-$105,400) for the seventh time ; even in one of these attacks , it created a Bull Trap .
During the last two to three days , Bitcoin has formed an Ascending Channel(Black) and another Ascending Channel(Purple) in the 15-minute time frame .
According to the theory of Elliott waves , Bitcoin seems to be completing microwave 5 of the main wave 5 , and we can expect corrective waves at least up to the upper line of the descending channel(broken) .
I don't expect Bitcoin to succeed in breaking the Resistance zone($107,300-$105,400) in the seventh attack , although there is positive news around the crypto market , but I think we need a stronger stimulus to break this resistance zone (real news) .
Cumulative Short Liquidation Leverage: $108,218-$106,476
Cumulative Long Liquidation Leverage: $104,460-$103,911
Note: The negative point is that the upper line of the descending channel was not broken with a large volume, so we hope for the break of the Resistance zone($107,300-$105,400).
Note: If the lower line of the ascending channel(Black) is broken, we can expect further decline and filling of the CME Gap($101,525-$100,375).
Note: If Bitcoin goes over $108223, we can expect more pumps and maybe a new ATH.
Can Bitcoin break the Resistance zone($107,300-$105,400) and create a new All-Time High(ATH)!? Please share your ideas in the comments.
Please respect each other's ideas and express them politely if you agree or disagree.
Bitcoin Analyze (BTCUSDT), 15-minute time frame.
Be sure to follow the updated ideas.
Do not forget to put Stop loss for your positions (For every position you want to open).
Please follow your strategy and updates; this is just my Idea, and I will gladly see your ideas in this post.
Please do not forget the ✅' like '✅ button 🙏😊 & Share it with your friends; thanks, and Trade safe.
Bitcoinidea


Bitcoin H4 Looks Bearish"All Insights are given on Chart"
(Follow for more Valuable Updates)
Note:
Do your own Research and Trade Wisely Never rely on my opinions.
Good Luck folks

Bitcoin's Volatility Vortex: 98K to 117K or Plummet to 70K?Morning Trading Family
If Bitcoin is like a roller coaster. If it stays above 98,000, it might go up to 117,000! But if it drops below 98,000, it could go all the way down to 70,000.
Kris/Mindbloome Exchange
Trade What You See

Bitcoin Triangle Breakout! What Next?Looking at the 4h, I anticipated at least ±10% on the breakout, which still might happen although it looks less likely as time passes.
It made perfect sense to begin the week with liquidating the long positions. It would either have been the longs or the shorts - someone had to take the hit.
I cautiously played both sides and benefitted from a short sell of around 2% marked on chart.
Where next? It's either going up, down, or sideways.
I'm playing both sides . Redrew a Fib between new high and low then chose my EP, TP and SL. It's still possible to lose with this method.
The larger Fib remains in play as I'm not yet convinced price cannot reach my original ±10% despite it seeming unlikely. Once the last candle has passed the triangle I'll retire that idea.
This won't stop me looking for setups in the meantime.

Skyrexio | Scared Already? The Worst Is Coming!Hello, Skyrexians!
First of all we want you to make calm: BINANCE:BTCUSDT is still in huge bull run and $140k target is still actual. The main question, how it plans to reach this level. Now we have two scenarios and one of them you will now like.
Let's take a look at the daily time frame. The bad signal are two red dots at the top on Bullish/Bearish Reversal Bar Indicator . It could be waves 3 and 5. In this case impulse of higher degree is finished and market is entering the major correction. If our assumption about bull run continuation is right, BTC usually tends to reach 0.38 Fibonacci level. Now this level is at $80k. This is the worst scenario. After that $140k is reachable target.
We also have not so painful scenario. Price now is at the local Fibonacci level. If $96k is going to be hold we can see the extended wave 5, which will reach $140 in the nearest future.
Best regards,
Skyrexio Team
___________________________________________________________
Please, boost this article and subscribe our page if you like analysis!

Bitcoin, BTC, BearishDespite the abundance of positive news and expectations, I would say it's more probable for Bitcoin to dive down to fil the LVN area between 77K and 86K to rebalance the price offerings there and quickly return to POC level at around 97K.
The asset will always move quickly through an LVN area and only stabilize or "park" at a HVN or POC levels, but the problem with the next HVN for BTC is that it's too low, around 65K, which although not impossible yet not probable.

BITCOIN OUTLOOKPer my analysis from the support marked being tested, we should now be longing to the 120k mark

The week could start red, not not sure it'll lastWeekend triangle pattern formed the 4hr.
I expected a Monday breakout to the upside with price action triggering long positions then liquidating them on the way to the GETTEX:97K region.
The reverse could also happen. Breakout to the downside, trigger shorts, then at LSE open on Monday, price reversal, liquidating shorts while rallying towards $112k.
On the back of Trump signing crypto related executive orders, it might be assumed bullish news.
It might have no effect, trigger longs and shorts, liquidate both sides, then trade sideways for the first half of the week.
Note to self: 1) Keep your stops tight or (2) sit this one out until direction confirmed (3) run a neutral bot in the meantime.

Bitcoin is still BullishPrice of Bitcoin still expected to break 1,09000$ mark and go above and make a new ATH.

Bullish move BitcoinThere is a possible bullish move on the 1 hour timeframe.
Stop loss: 103.400
Take profit: Around 111k

Bitcoin has to decideThe Bitcoin triangle pattern in the daily time frame is in a critical time frame and it is time for it to make its own decision. The main structure is bullish, but it seems that Bitcoin needs liquidity in the area of 80,000 for the next rise, in any case, a valid failure of the decisive triangle pattern. will be
Bitcoin Sell IdeaThere is a potential bearish move on the 1 hour chart.
Stop loss: 108.04
TP: Around 96.5

Bitcoin and the US PresidentsDemocrats and Obama:
177,202,485.71%
GOP and trump 1.0:
5,192.94%
Let the plebs and paid influencers talk their way, but facts will be facts, always.
Why he wants to deregulate crypto now, we might only speculate. But Ross William Ulbricht is free, pardoned by Trump.
If the trust in cryptocurrencies is compromised, expect a deep ABC correction. ;)
It is not a political post, nor is intended to be interpreted like one. It is just market observing one.
Be safe. Protect Your money.
Cheers

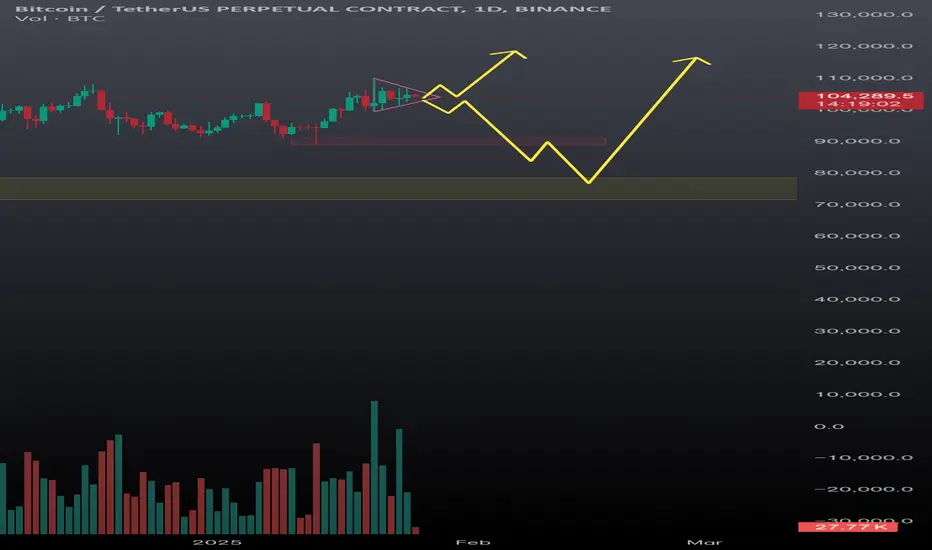
Bitcoin’s Big Move: Can It Hit $126K or Drop to $70K?Good morning, trading family!
Bitcoin (BTC) is at a key point right now. If it breaks above $107K, there’s a good chance we’ll see it climb to $117K, and if it keeps going, $118–$119K could be next. From there, it could push all the way to $126K.
But here’s the flip side—if we hit one of those levels, I’m expecting a correction. That could bring BTC back down to $80–$86K. If that doesn’t hold, we might even see it drop to $70K.
If this helped, I’d love to hear your thoughts! Feel free to like, comment, or share. Let’s trade smarter and live better!
Kris/Mindbloome Exchange
Trade What You See

Bitcoin Overshoot - Last Bullish Swing - 5th WaveMARKETSCOM:BITCOIN #trading was good to me.
I was able to predict and ride the #Bullish #Cycle like a pro.
Trade Recap
From the $17K I was actively looking for buys.
Also entered BITSTAMP:BTCUSD #Long from the GETTEX:25K mark, on the #Break-out.
At the Wave 4 Completion and 5th Wave Break-Out, I went Long again on $BTC.
At $100K Milestone I cashed it all in, I was a bit weary...
All well documented in the previous #Bitcoin Idea.
What's Next For MARKETSCOM:BITCOIN ?
I am entering the Last Long, to ride the 5th of 5th Wave.
After this #Bull #Swing I am expecting a considerable #Correction.
After the push, some wild moves will occur, and that's because of the CRYPTOCAP:BTC.D (BTC Dominance).
CRYPTOCAP:BTC.D Correction in Wave 2 will pave the way for $Altcoins (#Altcoins), thus the $Altseason (#AltSeason) to start.
Yes, MARKETSCOM:BITCOIN shall fall, while the CRYPTOCAP:OTHERS ( CRYPTOCAP:TOTAL3 ) would most likely grow in #TotalMarketCap.
* You can see the related ideas for more clearance.
BITSTAMP:BTCUSD / BINANCE:BTCUSDT - #TechnicalAnalysis
- Elliott Wave: #Impulse Confirmed (5th Wave)
- Mar '20 - Apr '21 #Fractal (orange)
- #ATH Break-Out & #Support
My Levels For Longs
- Entry @ $100K
- SL @ $85K
- TP @ $145K
* After this move, I will take a break and look for #Short set-ups.
This is because of the #Bearish #Fractal (red).

Skyrexio | Bitcoin BTC Has Cancelled The Bear Market!Hello, Skyrexians!
Last month BINANCE:BTCUSDT has clearly broken $100k. Most of people think that it's too late now to buy Bitcoin because price is too high, but our analysis tells us that it was only one half of the potential bull run.
Let's take a look at the monthly time frame. We can see the new Elliott Wave structure. Earlier we had a chance that this bull run could be the wave 5, but recently the Awesome Oscillator broke the previous high. The potential bearish divergence has been broken as well. Moreover, Fractal Trend Detector shows that this bull run is strong and no single sign of weakness now.
This is large wave 3 which has the target at least at $125k, but most likely it will hit $190k in 2025.
Best regards,
Skyrexio Team
___________________________________________________________
Please, boost this article and subscribe our page if you like analysis!

Looks like Bitcoin wants to go higherThere could be a bullish move today to 111k
Stop loss: 100.32
Take profit: Around 111

BTC Volatility Hits 6-Month High, Options Trading ExplodesImplied and realized volatility indexes hit the highest levels since August's yen carry trade unwind.
Bitcoin (BTC), the world's largest cryptocurrency by market capitalization, has always been synonymous with volatility. However, recent market activity indicates a significant surge in price fluctuations, with both implied and realized volatility indexes reaching levels not seen since August of the previous year. This spike in volatility coincides with a renewed frenzy in the Bitcoin options market, suggesting that traders are anticipating significant price swings in the near future.
Understanding Volatility
In financial markets, volatility refers to the degree of variation in the price of a trading asset over time. High volatility implies that the price of an asset can fluctuate dramatically over a short period, while low volatility suggests relatively stable price movements. Volatility can be measured in two primary ways:
1. Realized Volatility: This is a historical measure of how much an asset's price has fluctuated in the past. It is typically calculated by looking at the standard deviation of price changes over a specific period, such as 30 days.
2. Implied Volatility: This is a forward-looking measure of how much the market expects an asset's price to fluctuate in the future. It is derived from the pricing of options contracts, which give the holder the right, but not the obligation, to buy or sell an asset at a specific price on or before a certain date.
Current Market Trends
The increase in implied volatility suggests that options traders are pricing in a higher probability of significant price swings in Bitcoin. This could be due to a number of factors, including:
• Increased Institutional Participation: The growing involvement of institutional investors in the Bitcoin market has led to larger trading volumes and potentially greater price swings.
• Regulatory Uncertainty: The lack of clear regulatory frameworks for cryptocurrencies in many jurisdictions continues to create uncertainty and contribute to volatility.
• Market Sentiment: Overall market sentiment towards Bitcoin can also play a significant role in its volatility. Positive news and developments can lead to rapid price increases, while negative news can trigger sharp declines.
Options Market Frenzy
The surge in Bitcoin volatility is closely linked to a renewed frenzy in the Bitcoin options market. Options contracts provide traders with a way to bet on future price movements without having to directly buy or sell the underlying asset. The recent increase in options trading suggests that traders are actively seeking to capitalize on the expected price swings in Bitcoin.
One notable trend in the options market is the increasing demand for call options, which give the holder the right to buy Bitcoin at a specific price. This indicates that many traders are betting on further price increases in the cryptocurrency.
Potential Risks
While the current market conditions may present opportunities for some traders, it is important to be aware of the potential risks associated with high volatility. Rapid price swings can lead to significant losses for those who are not adequately prepared.
For latecomers to the Bitcoin market, the risk of immediate unrealized losses is particularly high. If the price of Bitcoin were to suddenly decline, those who recently bought in at higher prices could see their investments quickly lose value.
Conclusion
Bitcoin's recent surge in volatility, coupled with the frenzy in the options market, highlights the inherent risks and opportunities associated with this digital asset. While the potential for significant gains exists, traders must also be prepared for the possibility of substantial losses. As the Bitcoin market continues to evolve, it is crucial to stay informed and exercise caution when making investment decisions.


Bitcoin Looking for more upsideAfter revisiting a daily bullish order block with a liquidity sweep, Bitcoin demonstrated a strong upward reaction, forming a bullish breaker and a potential daily fair value gap (FVG). However, Bitcoin has not yet closed above the midpoint of the FVG. For me, it’s crucial to wait for a close at least above that level, or ideally above the shaded area. Such a move would present a solid opportunity to target the all-time high and the 113K level as a low-hanging fruit.

Pullback BitcoinThere is a potential bearish pullback on the 4 hour timeframe. Stop loss: 104.5 Take profit: 93.5
This is only a Pullback. After this pullback Bitcoin will go above 110k

Bitcoin's Path to $253,953 in 2025 – A Technical PerspectiveIdea Description:
In this analysis, I aim to present why I believe Bitcoin (BTC) could reach $253,953 in 2025. This price target is derived from a combination of historical trends and advanced technical analysis.
1️⃣ Key Resistance: The Historical Trendline
The trendline formed by the peaks of 2017 and 2021 acts as a robust resistance level. Historically, these trendlines have played a pivotal role in determining Bitcoin's price action during bull cycles.
2️⃣ Convergence with SpiderLines
The SpiderLines, established in 2019, perfectly align with the aforementioned trendline, creating a critical confluence zone. This dual-layered resistance suggests that $253,953 will be a significant psychological and technical barrier.
3️⃣ Supporting Market Cycles
Analyzing past cycles, we see that Bitcoin often revisits key trendlines in subsequent bull runs. The historical context suggests that 2025 will align with the next cycle peak, reinforcing this price prediction.
This idea highlights the importance of respecting historical levels and recognizing key confluences in market analysis. What are your thoughts on this projection? Could BTC challenge this resistance and push higher? Let’s discuss!
