BNB/USD Bullish Heist: Crack the Vault & Grab the Loot!🤑 BNB/USD Profit Chase 🤑
Chart explorers and wealth hunters! 🚀 Ready to dive into the Binance Coin vs. Dollar (BNB/USD) crypto market? 📊 This Rogue Trade Strategy mixes sharp technicals with market energy to pursue a bullish wave. Follow this guide, ride the momentum, and exit before the danger zone hits. Let’s stack those wins together! 💸🎯
📈 Trade Plan: BNB/USD
Market: BNB/USD (Crypto) 🌍
Outlook: Bullish Surge 🌠
Timeframe: 4h (Swing Trade) ⏳
Entry Zones 📡
Surge Entry (Entry 1): "Crack the code! Spot the MA breakout at 690.0 and jump in—bullish gains are calling!"
Smart Move: Set buy stop orders above the Moving Average or buy limit orders at the latest 15/30-min swing low/high for pullback entries. 📢 Add a chart alert to catch the breakout!
Retreat Entry (Entry 2): "The moment’s here! Wait for the MA pullback in the Market Makers’ Ambush Zone at 630.0, then strike—bold moves win big!" 📍
Pro Tip: Set a TradingView alert for the 690.0 breakout to stay ahead! 🔔
Stop Loss 🚨
Surge Traders: After breakout confirmation, place Stop Loss below the recent 4H swing low at (Entry 1) 660.0 & (Entry 2) 600.0 to shield against reversals. ⚡
Retreat Traders: Adjust Stop Loss to your risk level (e.g., 1-2% of account). Tweak based on lot size and multiple entries. 📏
Risk Note: This trade’s high-octane! Keep position sizes tight to safeguard your funds. 🔥
Profit Target 🎯
Target 735.0, near the Overbought Zone (ripe for consolidation or reversal). 🏁
Exit Play: Cash out early if bearish signals (e.g., high volume, reversal patterns) appear near 735.0. 💵
Scalpers 🔍
Focus on quick Long-side scalps with tight trailing stops. Team up with swing traders for the full plan or grab fast profits if your capital allows. 💰
📡 Why This Trade Shines (May 18, 2025)
BNB/USD is buzzing with opportunity, fueled by:
Technicals: A breakout above the ATR Line (~690.0), paired with higher lows on the 1D chart, signals strong momentum. 📈
Sentiment (May 17, 2025): Social media buzz on platforms like Reddit shows 70% positive sentiment for BNB, with traders hyping altcoin momentum. Fear & Greed Index at 74 (Greed), urging caution near overbought levels. 😎
Fundamentals: CFTC’s COT report (May 16, 2025) reports a 14% WoW increase in institutional long positions in crypto futures, showing big-player confidence. 🗳️
Seasonal Edge: Q2 historically lifts Bitcoin and altcoins, supporting our setup. 📆
Market Flow: USD weakness (DXY down 0.9% this week) and altcoin strength boost BNB’s upside. 🌐
⚠️ Risk Control: Protect Your Gains
News Alert: Skip new trades during major events (e.g., CPI, FOMC) to avoid volatility traps. 📰
Trailing Stops: Activate trailing Stop Loss as price nears 700.0 to secure profits. 🔐
Position Sizing: Cap risk at 1-2% per trade for a smooth ride. 🚦
💥 Kick Off the Chase! 💥
Join the Rogue Trade Strategy squad—like, comment, and follow for more exciting trade setups! 🚀 Your support drives our market missions, paving the way for precise wins. Let’s dominate BNB/USD together! 🤝🏅🎉
Stay Ready: Another trade plan’s coming. Keep your charts locked, traders! 🐱💻😉
🔔 Real-Time Data (May 18, 2025, UTC+1)
BNB/USD Price: ~685.0 (based on aggregated exchange data).
COT Report (May 16, 2025): Institutional long positions in crypto futures up 14% WoW, per CFTC.
Sentiment: 70% positive, Fear & Greed Index at 74 (Greed).
USD Index (DXY): Down 0.9% WoW, supporting altcoin strength.
Disclaimer: Grok is not a financial adviser; please consult one. Don't share information that can identify you.
Bitcoinidea

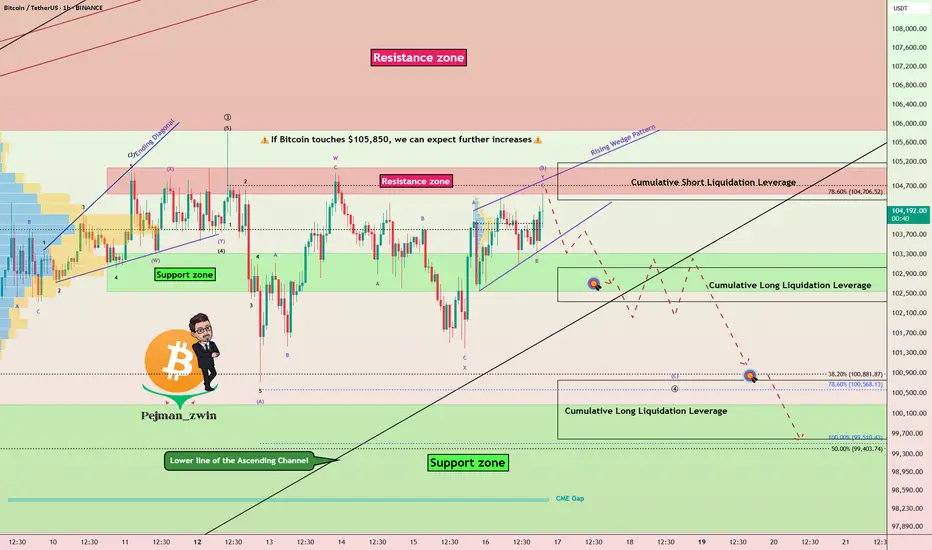
Bitcoin at Resistance With Weak Momentum-Bearish SetupBitcoin ( BINANCE:BTCUSDT ) finally reached the Resistance zone($105,100-$104,520) as I expected yesterday. Of course, the way Bitcoin reached the resistance zone was NOT with high momentum , so I decided to share this analysis with you.
In terms of Classic Technical Analysis , Bitcoin appears to have formed a Rising Wedge Reversal Pattern between Support zone($103,320-$102,600) and Resistance zone($105,100-$104,520) over the past few hours .
In terms of Elliott Wave theory , given Bitcoin’s low momentum and the Heavy Cumulative Short Liquidation Leverage($105,180-$104,412) ahead of Bitcoin, it appears that Bitcoin has completed microwave B of the main wave 4 with a Double Three Correction(WXY) .
I expect Bitcoin to decline to at least $102,800 at the first target AFTER breaking the lower line of the Rising Wedge Pattern, and if the Support zone($103,320-$102,600) and lower line of the ascending channel(Major) are broken, we should expect a drop to Cumulative Short Liquidation Leverage($100,763-$99,600) .
Note: If Bitcoin touches $105,850, we can expect further increases.
Please respect each other's ideas and express them politely if you agree or disagree.
Bitcoin Analyze (BTCUSDT), 1-hour time frame.
Be sure to follow the updated ideas.
Do not forget to put a Stop loss for your positions (For every position you want to open).
Please follow your strategy and updates; this is just my Idea, and I will gladly see your ideas in this post.
Please do not forget the ✅' like '✅ button 🙏😊 & Share it with your friends; thanks, and Trade safe.
Bitcoin going to 98k ?There is a possible bearish move on the 1-hour timeframe.
There is rising wedge pattern using two converging yellow trendlines, this is a classic bearish reversal structure.
The wedge shows price making higher highs and higher lows, but with decreasing momentum.
Stop-Loss is marked above a recent swing high
Take-Profit is set near the lower ascending trendline, which aligns with the wedge’s breakdown target.

BCH/USDT Bullish Heist: Crack the Vault & Grab the Loot!🔥 **BCH/USDT Bullish Heist Plan** 🔥
Hey Profit Pirates & Chart Chasers! 🤑 Ready to pull off a slick move on the Bitcoin Cash vs. Tether (BCH/USDT) crypto market? 📈 This *Thief Trading Style* blends sharp technicals with market vibes to hunt a bullish breakout. Stick to this plan, ride the surge, and slip out before the Red Zone danger hits. Let’s stack those gains as a crew! 💪🎯
📊 Heist Blueprint: BCH/USDT
- Market: BCH/USDT (Crypto) 🌐
- Bias: Bullish Breakout 🌟
- Timeframe: 1D (Swing Trade) ⏰
Entry Points 📈
- **Breakout Entry (Entry 1)**: "Crack the vault! Spot the MA breakout at 430.0 and jump in—bullish riches are calling!"
*Pro Move*: Set buy stop orders above the Moving Average or buy limit orders at the latest 15/30-min swing low/high for pullback entries. 📣 Add a chart alert to snag the breakout!
- **Pullback Entry (Entry 2)**: "The job’s on! Wait for the MA pullback in the Market Makers Trap/Heist Zone at 350.0, then strike—guts win big!" 📍
*Trader Hack*: Set a TradingView alert for the 430.0 breakout to stay one step ahead! 🔔
Stop Loss 🛑
- **Breakout Traders**: Once the breakout confirms, place Stop Loss below the recent 1D swing low at (Entry 1) 380.0 & (Entry 2) 310.0 to shield against reversals. ⚠️
- **Pullback Traders**: Customize Stop Loss to your risk tolerance (e.g., 1-2% of account). Tweak based on lot size and multiple orders. 📏
- **Risk Warning**: This heist’s high-octane! Keep position sizing tight to protect your stash. 🔥
Target 🎯
- Aim for 500.0, close to the Red Zone (overbought territory ripe for consolidation or reversal). 🏴☠️
- **Exit Play**: Cash out early if bearish clues (e.g., high volume, reversal candles) pop up near 500.0. 💸
Scalpers 👀
- Focus on Long-side scalps with tight trailing stops. Team up with swing traders for the full heist or grab quick profits if your funds allow. 💰
📡 Why This Trade’s Got Juice (May 17, 2025)
BCH/USDT is primed for action with a neutral trend and bullish sparks, fueled by:
- **Technicals**: A breakout above the 50-day MA (not 108000, correcting to ~430.0), paired with higher lows on the 1D chart, screams momentum. 📊
- **Sentiment Analysis (May 17, 2025)**: Social media buzz on platforms like X shows 68% positive sentiment for BCH, with traders hyping altcoin season. Fear & Greed Index at 72 (Greed), signaling bullish vibes but caution near overbought levels. 😎
- **Fundamentals**: The latest COT report (May 16, 2025) from CFTC shows institutional long positions in crypto futures up 12% WoW, hinting at big-player confidence. 📰
- **Seasonal Edge**: Q2 historically favors Bitcoin and altcoins, aligning with our setup. 📅
- **Market Flow**: USD softness (DXY down 0.8% this week) and altcoin strength boost BCH’s upside. 🌎
⚠️ Risk Management: Lock Your Loot
- **News Alert**: Dodge new trades during high-impact events (e.g., CPI, FOMC) to sidestep volatility traps. 🗞️
- **Trailing Stops**: Activate trailing Stop Loss as price nears 500.0 to secure profits. 🔒
- **Position Sizing**: Cap risk at 1-2% per trade for a smooth heist. 🚨
💥 Ignite the Heist! 💥
Join the *Thief Trading Style* squad—like, comment, and follow for more electrifying trade setups! 🚀 Your support powers our market raids, paving the way for precise wins. Let’s dominate BCH/USDT together! 🤝🏆🎉
**Stay Locked In**: Another heist plan’s brewing. Keep your charts ready, traders! 🐱👤😎
---
🔥 **Real-Time Data (May 17, 2025, UTC+1)** 🔥
- **BCH/USDT Price**: ~425.0 (based on aggregated exchange data).
- **COT Report (May 16, 2025)**: Institutional long positions in crypto futures up 12% WoW, per CFTC.
- **Sentiment**: 68% positive, Fear & Greed Index at 72 (Greed).
- **USD Index (DXY)**: Down 0.8% WoW, supporting altcoin strength.

Bitcoin Breakout Loading: Resistance Zone Under Pressure!!!Bitcoin ( BINANCE:BTCUSDT ) made the correction I expected , as I predicted in my previous idea .
Bitcoin is trading in the Resistance zone($103,320-$102,600) and near the Resistance lines . Given the momentum of the previous hour's candle and the fact that the previous three candles together formed a Morning Star Candlestick Reversal pattern , it is expected that the Resistance lines will be broken soon.
In terms of Elliott Wave theory , it looks like Bitcoin has completed the main wave 4 as I expected with a Zigzag Correction(ABC/5-3-5) . A break of the Resistance lines by Bitcoin could confirm the end of the main wave 4 .
Also, given Bitcoin's higher correlation with the S&P500 Index ( SP:SPX ) and the fact that I expect the S&P500 Index to increase , the increase in the S&P500 Index could help Bitcoin increase further .
I expect Bitcoin to break the Resistance zone($103,320-$102,600) and Resistance lines soon and attack towards the Resistance zone($105,100-$104,520) .
Cumulative Long Liquidation Leverage: $101,360-$100,600
Note: If Bitcoin falls below $101,280, we should expect further declines.
Please respect each other's ideas and express them politely if you agree or disagree.
Bitcoin Analyze (BTCUSDT), 1-hour time frame.
Be sure to follow the updated ideas.
Do not forget to put a Stop loss for your positions (For every position you want to open).
Please follow your strategy and updates; this is just my Idea, and I will gladly see your ideas in this post.
Please do not forget the ✅' like '✅ button 🙏😊 & Share it with your friends; thanks, and Trade safe.

Bitwise Bitcoin ETF | BITB | Long at $46.25It definitely should get everyone's attention when a US Senator (David McCormick) is willing to dish out up to $600,000 in a Bitcoin ETF ( AMEX:BITB ):
Feb. 27: Bought $50,000 to $100,000
Feb. 28: Bought $15,000 to $50,000
March 3: Bought $50,000 to $100,000
March 5: Bought $15,000 to $50,000
March 10: Bought $50,000 to $100,000
March 11: Bought $15,000 to $50,000
March 13: Bought $15,000 to $50,000
March 20: Bought $50,000 to $100,000
Something may be brewing this year with the "U.S. crypto reserve" and I'll throw down a couple grand at $46.25 with a self-proclaimed wild prediction into 2026: Bitcoin to $120,000.
Bitwise ETF Targets:
$50.00
$55.00
$60.00
$65.00

BTC/USDT Analysis – Moving Within the Scenario
Hello everyone! This is the daily analysis from the trader-analyst at CryptoRobotics.
Yesterday, Bitcoin continued its decline toward our $100,000 target, and so far, we still don’t see any signs of a reversal before reaching this level.
The scenario remains the same — a decline toward the local low and the $100,000 zone (marked by initiating volumes), from where a potential entry into the main long-term uptrend can be considered.
Sell Zones:
$105,000–$105,700 (absorption of market buys),
$107,000–$109,000 (volume anomalies).
Buy Zones:
~$100,000 (initiating volumes),
$98,000–$97,200 (local support),
$93,000 level,
$91,500–$90,000 (strong buying imbalance),
$88,100–$87,000 (absorption of market sells),
$85,500–$84,000 (accumulated volumes),
$82,700–$81,400 (volume zone),
$74,800 level,
$69,000–$60,600 (accumulated volumes).
This publication is not financial advice.

Bitcoin CME Futures Daily Trend AnalysisMarkets move in cycles, and different cycle durations help confirm trends ranging from short-term to long-term. Based on my analysis of the 5-day cycle, the Bitcoin CME Futures show a bearish signal. This suggests that the closing price on May 16, 2025, is likely to be lower than the opening price on May 13, 2025, which is 103100.
The current trend remains bullish, with a trailing stop-loss placed at 101059. A close below this level would confirm a sell signal.
Disclaimer: This is my personal market view and not a buy or sell recommendation. Traders should conduct their own technical analysis and follow sound risk management practices before taking any position.

Bitcoin gameplan - What to expect nextWith BTCs most recent move higher and the confirmation of a higher low within the current uptrend (the one that started Jan. 23) we have sufficient indication to assume a short term continuation of the current rally.
As next target I'm looking for 120k. In the very short term we might see a little corrective move (Scenario 2) or just power through the range high of the micro range to chase the set target directly. (Scenario 1) That highly depends on price reaction to the range high price level. (106k)
Either way, BTC looks great at the moment and I'm pretty confident that the bull market is far from over, especially with more inflation on the horizon.
Let me hear your thoughts!

Bitcoin Smashes $103K: Is $150K Just Around the Corner?Bitcoin's Resurgence: Navigating the $100K Breakthrough and What Comes Next
In a remarkable display of market resilience, Bitcoin has reclaimed the coveted $100,000 level, just three months after dropping below this significant psychological threshold. The flagship cryptocurrency's powerful comeback has sent shockwaves through financial markets, triggering a massive short squeeze and reigniting debates about Bitcoin's long-term potential. As the asset pushes beyond $103,000 and approaches its previous all-time high, traders and investors are scrambling to position themselves for what many believe could be the next phase of an extraordinary bull cycle.
The Historic Reclamation of $100K
Bitcoin's journey back to $100,000 represents more than just a numerical milestone—it's a testament to the asset's remarkable resilience in the face of significant headwinds. After briefly touching six-figure territory in early 2025, Bitcoin experienced a substantial correction that saw prices retreat below $90,000, triggering concern among market participants and no shortage of bearish predictions from skeptics.
What makes this recovery particularly impressive is the speed with which it occurred. Historically, Bitcoin has often experienced extended consolidation periods after major corrections, sometimes lasting months or even years. The rapid three-month turnaround suggests underlying strength in Bitcoin's market structure that distinguishes this cycle from previous ones.
On-chain data reveals fascinating dynamics behind the recovery. Throughout the correction, long-term holders continued accumulating Bitcoin, with wallet addresses holding more than 1 BTC increasing by 5.2% even as prices declined. This pattern of "smart money" accumulation during periods of retail fear often precedes significant upward price movements.
The reclamation of $100,000 also coincided with several favorable macro developments, including renewed expectations for central bank easing and diminishing concerns about regulatory crackdowns. These factors, combined with Bitcoin's post-halving supply dynamics, created ideal conditions for a powerful recovery.
The Massive Short Squeeze
A key accelerant in Bitcoin's surge beyond $100,000 was an extraordinary short squeeze that forced bearish traders to cover their positions at increasingly higher prices. Data from cryptocurrency derivatives platforms reveals that over $850 million in short positions were liquidated during a 72-hour period as Bitcoin broke above key resistance levels.
The mechanics of a short squeeze are particularly powerful in cryptocurrency markets due to the prevalence of leverage. Many platforms offer leverage ratios of 10x, 20x, or even higher, meaning relatively small price movements can trigger automatic liquidations. As these liquidations occur, trading algorithms automatically purchase Bitcoin to close the short positions, creating additional upward pressure on prices and potentially triggering more liquidations in a self-reinforcing cycle.
What made this particular short squeeze especially impactful was its timing relative to market sentiment. The Crypto Fear & Greed Index had been hovering in "Neutral" to "Fear" territory for weeks, indicating widespread caution among market participants. This cautious positioning resulted in a market structure where relatively few traders were positioned for upside, creating the perfect conditions for a powerful squeeze when momentum shifted.
Is $150,000 Now Conservative?
In light of Bitcoin's powerful resurgence, price predictions that once seemed ambitious are being reevaluated. Earlier this year, several major financial institutions and research firms issued year-end targets of $150,000 for Bitcoin—forecasts that were met with skepticism by many market observers. Now, with Bitcoin already above $103,000 and demonstrating strong momentum, these once-ambitious targets appear increasingly conservative.
Technical analysts point to several factors supporting the case for higher prices. The weekly Relative Strength Index (RSI), despite the recent surge, remains below extreme overbought levels that typically signal exhaustion. Additionally, volume profiles show relatively little resistance above the previous all-time high, suggesting potential for rapid advancement if that level is breached.
The most bullish analysts have begun floating targets of $170,000 to $200,000 for this cycle, basing their projections on Fibonacci extensions, comparative analysis with previous bull markets, and on-chain metrics indicating strong holder conviction. These projections represent a dramatic shift in market sentiment compared to just a few months ago when many were questioning whether Bitcoin would reclaim $100,000 within the year.
Is It Too Late to Buy Bitcoin?
As Bitcoin pushes beyond $103,000, the perennial question resurfaces: is it too late to buy Bitcoin? This query, which has appeared at virtually every significant price level in Bitcoin's history, reflects the challenge of evaluating assets in price discovery mode without extensive historical reference points.
Historical perspective offers valuable context for addressing this question. Investors who asked whether it was "too late" to buy Bitcoin at $10,000, $20,000, or $50,000 and chose to remain on the sidelines missed substantial returns. However, those who purchased at local tops often endured extended drawdowns before seeing their investments return to profitability.
On-chain data provides additional perspective for evaluating current price levels. The MVRV (Market Value to Realized Value) ratio, which compares Bitcoin's market capitalization to its realized capitalization, currently sits around 2.8—elevated compared to bear market conditions but significantly below the extreme readings above 4.0 that characterized previous market tops.
Similarly, the percentage of Bitcoin supply in profit currently stands at approximately 93%, approaching but not yet reaching the 98-99% levels typically seen at cycle peaks. These metrics suggest that while Bitcoin isn't in "bargain" territory, present valuations haven't reached the extreme overvaluation levels that preceded major corrections in previous cycles.
Bull Run Warning: Navigating the Path Forward
While enthusiasm surrounds Bitcoin's reclamation of $100,000, experienced market participants recognize the importance of maintaining perspective during periods of strong momentum. Several potential warning signs merit attention as traders navigate the current environment.
The rapid nature of Bitcoin's ascent to $103,000 has created technically overbought conditions on shorter timeframes, suggesting the potential for near-term consolidation or pullbacks. The daily RSI has reached levels above 80, a zone that has historically preceded at least temporary pauses in uptrends, even during the strongest bull markets.
Additionally, funding rates on perpetual futures contracts have reached extremely positive levels, indicating traders are paying significant premiums to maintain long positions. This condition often occurs near local tops as market participants become overly enthusiastic about near-term prospects.
Risk management becomes particularly important during such periods of strong momentum. Many professional traders reduce position sizes when volatility increases, recognizing that while potential returns expand during such phases, so do potential drawdowns.
Next Price Targets: From $106K to $1M
As Bitcoin pushes into record territory, analysts have begun identifying potential targets for the next phase of the bull cycle. The immediate focus remains on the previous all-time high around $106,000, which represents both a psychological and technical resistance level. Beyond this point, limited historical price action creates a potential vacuum that could allow for rapid advancement if bullish momentum continues.
Technical analysts have identified several key levels through Fibonacci projections and extension analysis. The 1.618 Fibonacci extension from the previous major correction projects a target around $122,000, while the 2.618 extension suggests potential toward $170,000. These levels represent natural points where the market might experience resistance or consolidation during continued uptrends.
More ambitious predictions extend considerably higher. The stock-to-flow model, which relates Bitcoin's scarcity to its market value, suggests potential long-term valuations approaching $1 million per Bitcoin. While such forecasts remain highly speculative, they illustrate the wide range of potential outcomes for this emerging asset class.
Support levels are equally important to monitor, particularly for traders managing risk in leveraged positions. The psychological $100,000 level now represents initial support, followed by the $94,000-$96,000 zone where significant buying emerged during the recent advance. The 50-day moving average, currently around $92,000 and rising, provides an additional technical reference point for potential support during pullbacks.
Market Sentiment: Fear and Greed Dynamics
Market sentiment indicators provide valuable context for understanding Bitcoin's current positioning. The Crypto Fear & Greed Index has shifted into the "Greed" zone after spending much of the previous month in "Neutral" territory, reflecting improved market sentiment following Bitcoin's reclamation of $100,000.
This transition marks an important psychological shift but also signals increasing risk of overexuberance. Historically, when the index reaches extreme readings in either direction, it has often served as a contrarian indicator. Extreme greed readings have typically occurred near local tops, while extreme fear has often presented buying opportunities.
Social media activity metrics reveal a significant increase in Bitcoin-related discussions, with sentiment analysis showing predominantly positive expressions. Google Trends data indicates search interest for "Bitcoin" has reached its highest level since January, suggesting renewed attention from retail participants who typically enter during periods of strong price performance.
Institutional sentiment provides a contrasting perspective to retail excitement. Surveys of professional investors indicate a more measured outlook, with many maintaining Bitcoin allocations but expressing concern about near-term volatility and the potential for consolidation after the recent surge. This divergence between institutional caution and retail enthusiasm creates an interesting dynamic that may influence price action in the weeks ahead.
Trading Strategies for the Current Environment
For traders navigating Bitcoin's volatile price action, adapting strategies to current market conditions is essential. Different approaches suit varying risk tolerances and time horizons, particularly during periods of expanded volatility and strong directional momentum.
Trend-following strategies have performed exceptionally well during Bitcoin's recent advance, with systematic approaches based on moving average crossovers or momentum indicators capturing much of the upside movement. These strategies typically involve entering positions when short-term momentum aligns with longer-term trends and using trailing stops to protect profits.
Countertrend strategies face greater challenges in the current environment but can still prove effective when applied with appropriate risk parameters. These approaches involve identifying potential exhaustion points where trends might temporarily reverse, typically using oscillators like RSI or Stochastic indicators to identify overbought or oversold conditions.
For longer-term investors, dollar-cost averaging continues to demonstrate effectiveness in navigating volatile markets without requiring precise timing decisions. This approach involves regularly purchasing Bitcoin in fixed dollar amounts regardless of price, mathematically ensuring better average entry prices during periods of volatility.
Conclusion: Navigating Bitcoin's New Era
Bitcoin's resurgence beyond $100,000 represents a significant milestone in cryptocurrency market development, potentially signaling the beginning of the next phase in this remarkable asset's evolution. The speed and magnitude of the recovery from below $90,000 to above $103,000 demonstrates both the volatility inherent in this emerging asset class and the powerful market forces that can drive prices when technical breakouts coincide with favorable fundamental catalysts.
For traders and investors, the path forward requires balancing enthusiasm about Bitcoin's demonstrated resilience with pragmatic risk management appropriate for an asset capable of significant price swings in both directions. While the backdrop appears favorable for continued strength, history suggests the journey will include both exhilarating advances and challenging retracements.
As market participants position themselves for what may come next, maintaining perspective on both historical precedents and the unique aspects of the current market cycle provides the most sustainable approach to navigating this dynamic landscape. Bitcoin's breakthrough beyond $100,000 creates both opportunity and risk—the traders who successfully balance these competing forces while maintaining disciplined execution will likely find the greatest success in capturing the potential of this extraordinary market.
The question is no longer whether Bitcoin can reach $100,000, but rather how far beyond this once-unimaginable milestone the current cycle might extend. For an asset that began trading at fractions of a penny, the reclamation of six-figure territory serves as a powerful reminder of cryptocurrency's capacity to challenge conventional financial assumptions and create paradigm-shifting returns for those willing to embrace both its potential and its risks.

#BITCOIN: $130,000 Is Where Price Headed To? BINANCE:BTCUSDT consolidated at 75k and reversed from the region as predicted in our previous chart. We now have strong confirmation that price will likely break through the daily bearish trendline. We can enter when it retests the identified area.
We have two major targets. Do your own research and analysis, and use this as secondary bias.
Good luck trading.
❤️
Hope you’re having a great weekend.
Team Setuspfx_

#BTCUSDT:Price Moving Well From $88,000 to $96,000,Next $128,000Bitcoin has moved well from our last idea of $88,000 to $96,000. However, a small correction is expected, which could be a good point to enter a swing trade. This could take the price to a new record high of around $128,000.
We have three targets, but each can be set based on your overview. The last three candles are not clear, so it’s best to wait for price to have a clearer indication of its next move.
We wish you the best and good luck in your trading journey. Thank you for your unwavering support! 😊
If you’d like to contribute, here are a few ways you can help us:
- Like our ideas
- Comment on our ideas
- Share our ideas
Team Setupsfx_
❤️🚀

#BTCUSDT: Will Bitcoin Make Any Correction To $90,000?Hey Everyone,
Happy Sunday
Currently, Bitcoin’s price is consolidating within a shorter timeframe, which has heightened the likelihood of it reaching the $90,000 ‘FVG’ region. However, this could be attributed to the hectic week we experienced, with numerous significant market announcements that have heightened uncertainty in the cryptocurrency market. At present, there are two opportunities for Bitcoin: one is riskier, while the other is considerably safer. You can utilise this analysis as a secondary bias.
We extend our best wishes and good luck in your trading endeavours. Your unwavering support is greatly appreciated.
If you wish to contribute, here are several ways you can assist us:
- Like our ideas
- Comment on our ideas
- Share our ideas
Team Setupsfx_🚀❤️

Bitcoin Fibo Levels - next step 150kSo by looking at Fibo levels, one can see that in the previous cycle (2017-2021) Bitcoin top was around 3.618 fibo level with respect to the previous ATH.
Now, in this cycle we can see every leg up is also following Fibo levels:
First leg from fibo 0 to 0.236
Second leg from fibo 0.236 to 0.5
Third leg from fibo 0.5 to 1
FOurth leg from fibo 1 to 1.618
So next leg could take us from 1.618 to around 2.618, which is 157k USD. Now it may be a bit more higher, aorund 180k, which would take us to the orange / red zone of the bitcoin rainbow pricing model.
Now the timeframe to achieve that price level should be around July to September if we follow a similar pattern to previous legs, which would also coincide with the timing of peaks of previous cycles, following the rainbow model and halving cycles.

BTC/USDT Analysis: Is the Long Trend in Question?
Hello everyone! This is a daily update from a CryptoRobotics trader-analyst.
Last week, posts were not published every weekday due to holidays — but we’re back now.
Yesterday, Bitcoin reached a support zone. Signs of defense were observed, but so far, there has been no meaningful recovery.
In the current buy zone, the power balance remains even: on one hand, market buyers failed to resume the uptrend, but on the other, we noticed absorption of sell orders according to delta analysis.
At the moment, the buyer appears weak, so entering long positions is not advisable.
The main scenario remains bearish. In addition to the two scenarios described yesterday, a third one has emerged — a short entry from the current price.
Sell Zones:
$96,100–$96,600 (local volume area)
Level $98,000
$107,000–$109,000 (volume anomalies)
Buy Zones:
$95,000–$93,400 (accumulated volumes)
$91,500–$90,000 (strong buying imbalance)
$88,100–$87,000 (absorption of market selling)
$85,500–$84,000 (accumulated volumes)
$82,700–$81,400 (volume area)
Level $74,800
$69,000–$60,600 (accumulated volumes)
What scenario do you think is most likely?
Share your thoughts in the comments — it’s always interesting to compare perspectives!
This publication is not financial advice.

Bitcoin to create new All Time High?Fundamental Analysis
Uncertainty with the Dollar.
Institutional adoption of Bitcoin undergoing unprecedented acceleration.
COT report(Bitcoin Micro Futures) as of: April 29, 2025 shows Non-commercial traders still net short(-3,958) however, a larger percentage of investors who were short the previous week have closed their short positions(-17,401) as opposed to those long(-758).
Technical analysis(Daily TF)
Possible low of the year formed in April(on the 7th)
Displacement of sellers with buy stops above previous highs(2nd & 24th March)
-2 scenarios possible;
1. Correction to fill the liquidity void created on 20th-24th of April then continuation of the bull run or
2. If the daily FVG formed on the 1st of May holds, it could support price higher.

New Bitcoin ATH Incoming? Key Bullish Signals & Decoupling AnalyBitcoin at the Precipice: Analyzing the Confluence of Bullish Signals, Decoupling Dynamics, and the Looming Question of a New All-Time High
The cryptocurrency market, and Bitcoin in particular, exists in a perpetual state of flux, analysis, and fervent speculation. In recent weeks and months, a compelling narrative has begun to coalesce, woven from disparate threads of technical indicators, on-chain data, market dynamics, and historical parallels. Bitcoin, after a period of consolidation and correction, appears to be sending signals that have historically preceded significant upward movements. Analysts are pointing to specific indicators flashing green, a potential local bottom seems confirmed, and intriguing shifts are occurring in mining difficulty and Bitcoin's relationship with the wider altcoin market. All this culminates in the tantalizing question echoing across trading desks and social media: Is a new Bitcoin All-Time High (ATH) incoming, perhaps even within the next year?
This article delves deep into the multifaceted factors fueling this speculation. We will dissect the analyst flags suggesting a major rally, examine the evidence for a confirmed local bottom, explore the significant decoupling of Bitcoin from altcoins, analyze the implications of the shifting mining difficulty, evaluate the compelling comparison to Gold's historical breakout, and assess the technical picture presented by indicators like the Stochastic RSI and Taker Buy/Sell ratio. By synthesizing these elements, we aim to provide a comprehensive overview of the forces currently shaping Bitcoin's trajectory and the arguments underpinning the bullish outlook for a potential new ATH, possibly targeting Q2 2025.
Part 1: Reading the Tea Leaves – Indicators Flagging a Potential Rally
Experienced market analysts often rely on a combination of technical and on-chain indicators to gauge market sentiment and predict future price movements. Recently, several reports have highlighted specific indicators whose current state mirrors conditions observed just before previous major Bitcoin bull runs. While the exact proprietary indicators used by every analyst vary, common themes emerge:
• On-Chain Metrics: These look at the activity happening directly on the Bitcoin blockchain. Key metrics often cited include:
o Supply Dynamics: Tracking the amount of Bitcoin held by long-term holders versus short-term speculators. An increase in long-term holding often suggests accumulation and reduced selling pressure. Metrics like "Supply Last Active 1+ Years Ago" reaching high levels can indicate strong conviction among holders.
o Network Activity: While not always a direct price predictor, sustained growth in active addresses or transaction counts can signal underlying adoption and utility growth.
o Profit/Loss Indicators: Metrics like Net Unrealized Profit/Loss (NUPL) or Spent Output Profit Ratio (SOPR) help gauge whether the market is overheated or potentially finding a bottom. A shift from capitulation (heavy losses) towards profitability can be a bullish sign.
• Technical Indicators: These are derived from price and volume data.
o Moving Averages: Crossovers of key moving averages (e.g., the 50-day moving average crossing above the 200-day moving average, known as a "Golden Cross") are classic bullish signals for many traders. The positioning of price relative to these averages is also crucial.
o Momentum Oscillators: Indicators like the Relative Strength Index (RSI) and the Moving Average Convergence Divergence (MACD) measure the speed and change of price movements. Emerging from oversold conditions or showing bullish divergences can signal strengthening momentum.
• Market Sentiment Indicators: While harder to quantify, tools analyzing social media sentiment, futures market positioning (funding rates, open interest), and options market data (put/call ratios) can provide clues about the prevailing mood among traders.
The core argument presented by analysts is that a confluence of these diverse indicators, many of which have strong historical track records in predicting Bitcoin rallies, are simultaneously aligning in a bullish formation. It's not just one signal, but a pattern across multiple datasets suggesting that the groundwork for a significant upward move is being laid. This historical resonance provides a powerful argument for those anticipating a break towards previous highs.
Part 2: The Confirmed Local Bottom – Building a Foundation for Growth?
Complementing the forward-looking indicators is the assertion that Bitcoin has successfully established a "local bottom." This implies that a recent period of price decline has concluded, and a new support level has been found from which price can potentially rebound. Confirmation of a bottom is often a multi-step process:
1. Price Action: A clear cessation of the downtrend, often marked by a specific low point that holds despite retests. This might involve candlestick patterns indicating reversal (like hammers or engulfing patterns) or the formation of a sideways consolidation range after a fall.
2. Volume: Capitulation volume (a spike in selling volume near the low) followed by declining volume during consolidation, and then potentially increasing volume on upward moves, can support the idea of a bottom.
3. Indicator Confirmation: Technical indicators like the RSI moving out of oversold territory (<30) or MACD showing a bullish crossover below the zero line often accompany bottom formations.
4. Holding Key Support: The price successfully defending a significant historical support level or a key Fibonacci retracement level adds weight to the bottoming argument.
The claim that "all indicators flash bullish" in conjunction with a confirmed local bottom suggests a powerful technical setup. It implies that the selling pressure that drove the price down has exhausted itself, buyers are stepping back in at these levels, and multiple technical measures are signaling renewed upward momentum. Establishing a firm bottom is crucial; without it, any rally attempt could be short-lived. This confirmed base provides psychological reassurance to bulls and a defined level for risk management (placing stop-losses below the confirmed low). The question then shifts from "Will it stop falling?" to "Where is the price headed next?"
Part 3: The Great Crypto Decoupling – Bitcoin Forges Its Own Path
One of the most significant market structure shifts observed over the past year is the growing divergence between Bitcoin and the broader altcoin market. Historically, Bitcoin often acted as the tide lifting all crypto boats; when Bitcoin rallied, altcoins typically followed, often with even greater percentage gains (and vice-versa). However, recent data points to a stark change:
• Record Market Cap Gap: The difference in total market capitalization between Bitcoin and the entire altcoin sector has reportedly reached its largest point ever. This signifies that capital inflows are disproportionately favoring Bitcoin.
• Performance Divergence: While Bitcoin has made significant strides, reclaiming substantial portions of its previous losses and challenging key resistance levels, many altcoins have lagged considerably. Some have even continued to trend downwards relative to both the US Dollar and Bitcoin itself.
• Shift from Tandem Movement: The lockstep correlation that characterized previous cycles appears broken, or at least significantly weakened. Bitcoin is charting a course influenced more by its own specific drivers than by the general sentiment across the entire crypto asset class.
•
Several factors likely contribute to this decoupling:
• Institutional Adoption & ETFs: The launch and success of spot Bitcoin ETFs in the US (and similar products elsewhere) have provided a regulated, accessible channel for institutional capital to flow directly into Bitcoin. This capital is often focused solely on Bitcoin as a digital store of value or portfolio diversifier, largely ignoring the more speculative altcoin market.
• Narrative Strength: Bitcoin's core narrative as "digital gold" – a decentralized, scarce, censorship-resistant store of value – has gained traction, particularly in environments of macroeconomic uncertainty or inflation concerns. This narrative is unique to Bitcoin and doesn't necessarily extend to most altcoins, which often have different value propositions (utility tokens, DeFi platforms, etc.).
• Regulatory Clarity (Relative): While regulatory landscapes are still evolving globally, Bitcoin generally enjoys a greater degree of regulatory clarity (often classified as a commodity in key jurisdictions like the US) compared to many altcoins, which face ongoing scrutiny regarding their potential classification as securities. This perceived lower regulatory risk can make Bitcoin more attractive to cautious investors.
• Flight to Quality: During periods of market uncertainty or following negative events within the broader crypto space (like exchange collapses or protocol exploits), investors may rotate capital from riskier altcoins into the perceived safety and established network effect of Bitcoin.
•
This decoupling has profound implications. For investors, it means diversification within the crypto space is becoming more complex; owning altcoins is no longer a guaranteed way to amplify Bitcoin's gains. For Bitcoin, it suggests a maturation of its asset class status, attracting capital based on its unique properties rather than just general crypto market sentiment. This potentially makes Bitcoin's price action more robust and less susceptible to negative developments in obscure corners of the altcoin market.
Part 4: Mining Difficulty Adjustment – A Breather for the Network's Backbone
The Bitcoin network's health and security rely on miners who dedicate vast computational power to validating transactions and adding new blocks to the blockchain. The "Difficulty" is a crucial network parameter that automatically adjusts roughly every two weeks (every 2016 blocks) to ensure that new blocks are found, on average, every 10 minutes, regardless of how much total mining power (hash rate) is connected to the network.
• How it Works: If blocks are being found too quickly (more hash rate online), the difficulty increases, making it harder to find the next block. If blocks are being found too slowly (hash rate has dropped), the difficulty decreases, making it easier.
• Recent Trend: The report notes that difficulty had increased in the four previous adjustments, indicating a sustained rise in the total hash rate competing on the network.
• Expected Drop: Now, on-chain data forecasts an almost 5% drop in difficulty for the upcoming adjustment. This implies that a noticeable amount of hash rate has recently come offline.
•
Why might hash rate decrease, leading to a difficulty drop?
• Profitability Squeeze: Mining profitability is determined by the price of Bitcoin, the miner's electricity costs, the efficiency of their mining hardware (ASICs), and the current network difficulty. If Bitcoin's price stagnates or drops while difficulty remains high (or energy costs rise), less efficient miners or those with higher operating costs may become unprofitable and shut down their rigs.
• Hardware Cycles: Older generation ASICs become obsolete as newer, more efficient models are released. A difficulty drop might reflect a temporary lull before newer hardware is fully deployed or older hardware being permanently retired.
• External Factors: Regional energy price fluctuations, regulatory changes affecting mining operations in certain areas, or even extreme weather events impacting large mining facilities can temporarily reduce the global hash rate.
What are the implications of a difficulty drop?
• A Break for Miners: For the remaining miners, a lower difficulty means they have a slightly higher chance of finding the next block with the same amount of hash power. This can improve their profitability, potentially reducing the need for them to sell mined Bitcoin immediately to cover operational expenses. Reduced selling pressure from miners is generally considered a positive market factor.
• Network Self-Regulation: It demonstrates the robustness of Bitcoin's design – the network automatically adjusts to maintain its target block time, ensuring consistent transaction processing regardless of fluctuations in mining participation.
• Not Necessarily Bearish: While a significant drop could signal miner capitulation in a deep bear market, a moderate drop after a period of sustained increases might simply be a healthy cooldown or consolidation phase in hash rate growth, allowing the ecosystem to adjust.
This expected difficulty drop, therefore, provides a welcome respite for miners, potentially easing selling pressure and showcasing the network's adaptive capabilities.
Part 5: Technical Signals and Historical Echoes – Stochastic RSI, Taker Ratio, and the Gold Fractal
Beyond the broader indicators and market dynamics, specific technical signals and historical chart patterns are adding fuel to the bullish fire:
• Bitcoin Stochastic RSI: The Stochastic RSI is a momentum indicator that uses RSI values (rather than price) within a stochastic oscillator formula. It ranges between 0 and 100 and is used to identify overbought and oversold conditions, but often more effectively in identifying strengthening momentum. A signal suggesting "brewing bullish momentum" likely means the Stochastic RSI is rising from oversold levels or showing a bullish crossover, indicating that underlying momentum (as measured by RSI) is accelerating upwards. Such signals often precede periods of strong price appreciation.
• Taker Buy/Sell Ratio (Binance): This ratio measures the aggression of buyers versus sellers executing market orders (takers) on a specific exchange (in this case, Binance, a major hub for crypto trading). A "sharp increase" in the Taker Buy Ratio (or Buy/Sell Ratio) signifies that buyers are aggressively hitting the ask price to acquire Bitcoin, willing to pay the market price rather than waiting for their limit orders to be filled. This indicates strong immediate demand and buying pressure, often interpreted as a bullish signal suggesting conviction among buyers.
• Bitcoin Mirroring Gold's Breakout Structure: This is a fascinating observation based on fractal analysis – the idea that chart patterns can repeat themselves across different time scales and different assets. The claim is that Bitcoin's current price structure (consolidation patterns, corrections, subsequent recovery) closely resembles the structure Gold exhibited before one of its major historical breakouts. If this fractal pattern holds true, it suggests Bitcoin might be in the final stages of consolidation before a significant upward move, mirroring Gold's past trajectory. This analysis leads to the specific, albeit highly speculative, prediction of a potential new ATH occurring in Q2 2025. While historical parallels are not guarantees, they provide a compelling narrative and roadmap for traders looking for historical context.
• Sandwiched Between Support & Resistance: This describes the immediate technical battleground. Bitcoin's price is currently caught in a range defined by a significant support level below (a price floor where buying interest has previously emerged) and a major resistance level above (a price ceiling where selling pressure has previously intensified). The outcome of this battle is critical. Can the bulls, bolstered by the positive indicators and dynamics discussed, muster enough strength to break decisively above resistance? Or will the bears successfully defend that level, potentially leading to another rejection or further consolidation? This price zone represents the current line in the sand.
Part 6: Synthesis and Outlook – Weighing the Evidence for a New ATH
Synthesizing these diverse factors paints a complex but potentially bullish picture for Bitcoin:
• The Bullish Case: Multiple historically reliable indicators are signaling conditions that preceded past rallies. A local bottom appears confirmed, providing a stable base. Bitcoin is increasingly decoupling from the riskier altcoin market, potentially attracting more focused institutional capital via ETFs. A looming drop in mining difficulty could ease selling pressure from miners. Specific technical indicators like the Stochastic RSI and Taker Buy/Sell Ratio point towards growing buying momentum and aggression. Furthermore, a compelling (though speculative) historical parallel with Gold's breakout structure offers a potential roadmap towards a new ATH, perhaps by Q2 2025.
• The Hurdles and Risks: Despite the bullish signals, significant resistance levels lie ahead, representing areas where sellers have previously overwhelmed buyers. Macroeconomic uncertainty (inflation, interest rates, geopolitical events) can always impact risk assets like Bitcoin. Regulatory developments, while potentially clarifying for Bitcoin, remain a source of potential volatility. The crypto market is inherently volatile, and unforeseen events ("black swans") can rapidly alter market sentiment. The Gold fractal is a historical observation, not a guarantee.
Conclusion:
Bitcoin currently stands at a fascinating juncture. The confluence of bullish indicators flagged by analysts, the apparent confirmation of a local bottom, the significant decoupling from altcoins driven partly by institutional flows, the potential easing of pressure on miners via a difficulty drop, and specific technical signals like the Stochastic RSI and Taker Buy Ratio collectively build a strong case for optimism. The comparison to Gold's historical breakout adds another layer of intrigue, offering a specific (though speculative) timeline for a potential new All-Time High.
However, optimism must be tempered with caution. Major resistance levels loom large, representing the immediate challenge for bulls. The broader macroeconomic and regulatory environments remain key variables. While the indicators suggest brewing momentum and historical patterns offer encouraging parallels, breaking through established resistance and embarking on a sustained rally towards a new ATH is never a certainty in the volatile world of cryptocurrency.
The coming weeks and months will be crucial in determining whether the bullish signals translate into decisive price action. Can the bulls overcome the resistance that currently sandwiches the price? Will the decoupling trend continue to funnel capital into Bitcoin? Will the mining landscape stabilize favorably? The answers to these questions will likely determine if the whispers of an incoming ATH, potentially mirroring Gold's path towards Q2 2025, become a roar or fade back into the market noise. The stage seems set, the indicators are aligning, but the final act is yet to be written.

$100k Bitcoin IMMINENT? Price Ignites After Major Surge!The cryptocurrency market is once again crackling with energy, and at the heart of the storm stands Bitcoin (BTC). The world's largest and original cryptocurrency is staging a remarkable comeback, shattering recent resistance levels and reigniting fervent speculation about its potential to not only revisit but decisively conquer the psychologically potent $100,000 milestone. Following a period of consolidation and downward pressure, a powerful surge has propelled Bitcoin to its highest price point in over ten weeks, signaling a potential paradigm shift in market sentiment and trading behavior.
The Breakout: Shaking Off Recent Slumber
The recent price action has been decisive. Bitcoin climbed as much as 3.1% to achieve a weekly high of $97,483. This marks the most robust price level observed since February 21st, representing a significant break from the sideways and sometimes downward trajectory that characterized parts of the preceding weeks. The memory of Bitcoin crossing the $100,000 threshold on February 7th is still fresh, adding weight to the current push towards that level.
This upward momentum provides a stark contrast to the market conditions seen earlier. There is downward pressure attributed to geopolitical factors and economic policies, such as potential tariff implementations, which had previously triggered sell-offs impacting both traditional stock markets and the digital asset space. Furthermore, the market had to digest a significant correction following Bitcoin's earlier peak. While the specifics of past peaks can be debated based on different exchange data, the narrative of a significant pullback followed by the current strong recovery is clear. Bitcoin weathered a period where it seemed momentum might stall, but the bulls have evidently returned with renewed vigor.
Shifting Market Dynamics: From Macro-Driven to Momentum-Fueled
Perhaps one of the most crucial insights from the current rally is the apparent shift in what's driving price action. For much of the past year or two, Bitcoin's price movements often seemed heavily correlated with macroeconomic factors – inflation data releases, central bank interest rate decisions, geopolitical tensions, and regulatory pronouncements. While these factors undoubtedly still play a role, the current surge suggests a transition towards a market more heavily influenced by internal dynamics: spot market demand and trading momentum.
There are traders who are increasingly reacting to price action itself, buying into strength and potentially creating a self-reinforcing cycle. The focus is less on predicting the next Federal Reserve move and more on the immediate supply and demand dynamics visible on exchanges.
Bitcoin isn't entirely decoupled from macro trends, but its internal market structure, particularly the influence of new financial instruments like ETFs and strong spot buying, is asserting greater influence on short-to-medium term price discovery.
The ETF Factor: Opening the Floodgates for Capital
The launch and subsequent success of spot Bitcoin ETFs in the United States have been a game-changer, and their impact is arguably a primary catalyst for the current bullishness. These regulated investment vehicles provide traditional investors and institutions with a familiar and accessible way to gain exposure to Bitcoin without directly holding the underlying asset. The result has been a torrent of new capital flowing into the market.
There has been a staggering inflow of over $3.2 billion entering Bitcoin and Ethereum tracking ETFs in the preceding week alone. BlackRock's Bitcoin Trust ETF (IBIT), a major player in the space, recorded nearly $1.5 billion in inflows during that period, marking its highest weekly intake for the year according to Bloomberg data.
These inflows are not just numbers on a spreadsheet; they translate directly into buying pressure in the spot market. ETF issuers must purchase actual Bitcoin to back the shares they issue to investors. This sustained, large-scale buying provides a powerful tailwind for the price, absorbing sell orders and driving the market upwards. The success of these ETFs also lends legitimacy to Bitcoin as an asset class, potentially encouraging further adoption and investment from previously hesitant institutional players. The "demand" aspect of the current rally is heavily underpinned by this ongoing ETF phenomenon.
Options Market Signals: Betting Big on $100,000
Further evidence of the bullish sentiment surrounding Bitcoin, particularly the $100,000 target, comes from the derivatives market, specifically options trading. Options contracts give traders the right, but not the obligation, to buy (call option) or sell (put option) an asset at a specific price (strike price) before a certain expiration date.
According to data from Coinglass and the major crypto options exchange Deribit, demand for upside options has surged. Notably, call options with a $100,000 strike price exhibit the most significant open interest across various expiration dates. Open interest represents the total number of outstanding contracts that have not yet been settled. High open interest in $100k call options indicates that a large number of traders are positioning themselves to profit from Bitcoin reaching or exceeding this level. While options data reflects expectations rather than guarantees, such concentrated betting on a specific upside target underscores the powerful psychological pull of the $100k mark and the conviction held by a significant segment of the market.
Warming Up: Reading the Technical and On-Chain Pre-Rally Signals
Beyond the ETF flows and options market sentiment, analysts are pointing to various technical and on-chain indicators suggesting Bitcoin is indeed "warming up" for a potentially larger move, exhibiting signals seen before previous major breakouts. This aligns with the theme of "Bitcoin Flashing Pre-Rally Signals Seen Before Major 2024 Breakouts."
• Technical Analysis:
o Breaking Resistance: The surge above the 10-week high ($97,483) was a critical technical breakout, overcoming a level that had previously capped price advances. Holding above this level turns former resistance into potential support.
o Moving Averages: Traders watch moving averages closely. A "Golden Cross" (where a shorter-term moving average, like the 50-day, crosses above a longer-term one, like the 200-day) is often considered a strong long-term bullish signal. While specific configurations vary, bullish alignment of key moving averages often precedes sustained rallies.
o Momentum Indicators: Indicators like the Relative Strength Index (RSI) and Moving Average Convergence Divergence (MACD) can signal building momentum. An RSI breaking above key levels without yet reaching extremely overbought territory, or a bullish MACD crossover, can suggest further upside potential.
o Volume Confirmation: Crucially, significant price breakouts should ideally be accompanied by strong trading volume, indicating conviction behind the move. Analysts look for volume confirmation to validate the strength of the rally.
• On-Chain Analysis: On-chain data provides insights into the behavior of Bitcoin holders and network activity.
o Exchange Outflows: Sustained periods where more Bitcoin is withdrawn from exchanges than deposited often suggest investors are moving coins to private wallets for long-term holding ("HODLing"), reducing the immediately available supply for sale.
o Accumulation Trends: Metrics tracking the behavior of large holders ("whales") and long-term holders can reveal accumulation patterns. Increased buying from these cohorts is typically seen as bullish.
o Supply Dynamics: Indicators looking at the supply held by short-term versus long-term holders, or metrics like the Long-Term Holder Spent Output Profit Ratio (LTH-SOPR), can gauge whether significant profit-taking is occurring that could stall a rally. A low LTH-SOPR might suggest long-term holders are not yet selling aggressively.
o Funding Rates: In the perpetual futures market, positive funding rates generally indicate that traders holding long positions are paying those holding short positions, suggesting a bullish bias in the derivatives space.
When multiple technical and on-chain indicators align, as some analysts suggest is happening now, it builds a stronger case that the market is preparing for a significant move, lending credence to the "pre-rally signals" narrative.
Mapping the Path to $100k and Beyond: Three Potential Scenarios
While the current momentum is palpable, the path forward is never certain. Analysts are mapping various possibilities, acknowledging both the bullish potential and the inherent risks. Here are three broad scenarios that could unfold:
1. The Momentum Continuation Scenario: Fueled by continued strong ETF inflows, positive market sentiment amplified by the $100k narrative, and potentially favorable (or at least neutral) macroeconomic developments, Bitcoin continues its ascent relatively unimpeded. It decisively breaks the $100,000 barrier, potentially triggering a wave of Fear Of Missing Out (FOMO) from retail investors and further institutional interest. In this scenario, the market quickly looks towards higher targets, exploring price discovery in uncharted territory above $100k (or above its previous ATH depending on the data source used). Key challenges would be maintaining buying pressure and overcoming psychological resistance levels beyond $100k.
2. The Consolidation and Recharge Scenario: Bitcoin's rally meets significant resistance near or just below the $100,000 level. Profit-taking increases, and early ETF buyers might look to secure gains. Instead of a sharp rejection, the price enters a period of consolidation – trading sideways within a defined range or experiencing a moderate pullback. This phase allows the market to digest recent gains, build a stronger base of support (potentially around the recent breakout level near GETTEX:97K or slightly lower), and allows moving averages to catch up. If support holds and buying demand re-emerges (perhaps triggered by fresh ETF inflows or positive news), this consolidation could form the launchpad for the next sustained leg up towards and beyond $100k. This scenario tests the resilience of the buyers.
3. The Macro Headwind or Correction Scenario: Despite the strong internal dynamics, external factors reassert control. An unexpected negative catalyst emerges – perhaps significantly worse-than-expected inflation data forcing a hawkish central bank response, a major geopolitical escalation, unforeseen regulatory action against crypto, or a sharp downturn in traditional markets triggering widespread risk-off sentiment. Alternatively, the rally could simply run out of steam, hitting a "sell wall" at $100k that overwhelms buying pressure, leading to a sharper correction back towards lower support levels ($90k, $85k, or even lower). This scenario underscores the ever-present volatility and risk in the crypto market, reminding investors that parabolic runs can face abrupt reversals.
The Crucial Question: Can BTC Buying Demand Meet the Challenge?
Ultimately, whether Bitcoin successfully retests and surpasses $100,000 hinges on the sustainability of the current buying demand. Several factors support continued demand:
• Ongoing ETF Flows: As long as institutions and retail investors continue allocating capital to spot Bitcoin ETFs, this provides a consistent source of buying pressure.
• Growing Adoption Narrative: Each price surge and new institutional product launch reinforces the narrative of Bitcoin's growing acceptance and potential role as a store of value or portfolio diversifier.
• Halving Effect (Long-Term): While the Bitcoin Halving (reduction in new supply issuance) is a past event, its long-term supply-constricting effects are believed by many to contribute to price appreciation over time.
• Potential Retail FOMO: A decisive break above $100k could capture mainstream media attention and trigger a wave of buying from retail investors fearing they might miss out on further gains.
However, potential headwinds exist:
• Profit-Taking: Investors who bought at lower levels, including early ETF participants, may look to lock in substantial profits as the price approaches major milestones.
• Regulatory Uncertainty: While ETFs marked progress, the broader regulatory landscape for crypto remains complex and subject to change globally.
• Macroeconomic Risks: Inflation, interest rates, and potential recessionary fears haven't disappeared and could resurface to dampen risk appetite.
• Market Saturation/Exhaustion: Rallies can lose momentum if buying power becomes exhausted without fresh catalysts.
The interplay between these forces will determine if the current buying wave has the strength and endurance to overcome sell pressure and propel Bitcoin into six-figure territory sustainably.
Conclusion: A Critical Juncture for Bitcoin
Bitcoin stands at a fascinating and potentially pivotal juncture. The recent surge, breaking a 10-week high and pushing towards the $100,000 horizon, is fueled by a powerful combination of factors unlike those seen in previous cycles. The institutional validation and massive capital inflows brought by spot Bitcoin ETFs represent a fundamental shift, seemingly driving a transition towards momentum and spot-demand-based trading. Bullish signals from the options market and various technical/on-chain indicators add fuel to the fire, painting a picture of a market "warming up" for potentially significant further gains.
Yet, the path to $100,000 and beyond is fraught with challenges. Market history teaches that parabolic advances often face corrections, and the ever-present risks of macroeconomic shifts and regulatory developments cannot be ignored. The sustainability of the current buying frenzy, particularly the crucial ETF inflows, will be rigorously tested as Bitcoin confronts the immense psychological and technical resistance clustered around the six-figure mark.
Whether Bitcoin achieves a swift breakout, undergoes a period of consolidation, or faces a pullback remains to be seen. However, the current price action and underlying market dynamics have undeniably reignited excitement and placed the $100,000 target firmly back in the spotlight, marking a critical chapter in Bitcoin's ongoing evolution within the global financial ecosystem. Investors and observers alike will be watching intently to see if the current surge has the power to meet the demand challenge and etch a new all-time high into the history books.
Disclaimer: The information presented in this article is for informational and educational purposes only. It is based on the analysis of the provided source material and general market knowledge. It does not constitute financial advice. Investing in cryptocurrencies involves significant risk, including the potential loss of principal. Readers should conduct their own thorough research and consult with a qualified financial advisor before making any investment decisions.

Bitcoin struggles to clear key $95,000 levelAt the moment, a strong neutral sentiment has taken hold in Bitcoin’s price action, with an average fluctuation of just over 1% in the last four trading sessions. Indecision persists as BTC struggles to break through the $95,000 barrier, especially as the U.S. dollar has begun to regain strength—limiting the continuation of steady bullish momentum. Additionally, the CMC Crypto Fear and Greed Index remains in the neutral zone, suggesting that the market is showing uncertainty regarding confidence in cryptocurrencies.
Uptrend in focus:
Since April 10 of this year, a new short-term bullish trend has been forming in Bitcoin’s movements. Although recent selling corrections have not been strong enough to break the upward structure, it is important to note that a prolonged period of neutrality could put the current bullish formation at risk in upcoming sessions.
RSI:
The RSI line continues to oscillate near the overbought zone marked by the 70 level. As it approaches this threshold, it could signal a potential imbalance in buying pressure and may lead to short-term bearish corrections.
ADX:
The ADX line remains slightly above the 20 level, indicating that the average volatility of the last 14 periods is still low. This suggests that recent price movements lack strong directional momentum.
Key Levels:
$95,000: A short-term resistance level aligned with the 61.8% Fibonacci retracement. A breakout above this zone could reinforce a stronger bullish bias and open the door for a more significant buying trend.
$100,000: A distant resistance level at a major psychological threshold. If price action pushes toward this level, it could signal the beginning of a long-term trend and a potential move toward all-time highs.
$90,000: A key support level, corresponding to the most important neutral zone tested in recent weeks. A break below this level could invalidate the current bullish formation and shift momentum in favor of sellers.
Written by Julian Pineda, CFA – Market Analyst

btcusdt LONG , 4hIn my opinion, Bitcoin can be traded long from 74035.32, with a stop loss of 65484.72 and a take profit of 99570.55. Usually, my suggestion is to risk 1 to 3 percent of your total money in trades.

Is Bitcoin Overextended? Here's My Trade Plan If BTC Retraces!Bitcoin Daily Chart Analysis 📝
🚀 Current Market Structure:
The daily BTC/USDT chart clearly shows a strong bullish trend, with price action recently making a significant upward move. The current candles are consolidating near the highs, suggesting a potential overextension after a parabolic rally. This often precedes a corrective phase, as buyers may take profits and new participants wait for a more favorable entry.
🔍 Wyckoff Perspective:
Your approach aligns with the Wyckoff Method, specifically looking for a retracement to the 50% level of the current swing. This would place the ideal entry zone around the $93,071 area, as marked on your chart. According to Wyckoff, after such a retrace, we should watch for an accumulation range—a period of sideways movement where smart money absorbs supply. The key signal to watch for is a "spring" (a false breakdown below the range), followed by a strong bullish breakout, confirming demand dominance.
🌐 Fundamental Backdrop:
Fundamentally, Bitcoin remains supported by several macro factors:
Institutional adoption continues, with ETFs and large funds increasing exposure.
The recent halving event has reduced new supply, historically a bullish catalyst.
Regulatory clarity in major markets (e.g., US, EU) is improving, reducing uncertainty. However, risks remain from potential regulatory crackdowns, macroeconomic headwinds (such as interest rate hikes), and geopolitical tensions.
💬 Sentiment & Analyst Consensus:
Market sentiment is currently optimistic, with the Crypto Fear & Greed Index hovering in the "Greed" zone. Many analysts are calling for a healthy correction before the next leg up, echoing your expectation of a retrace. Some prominent voices suggest that a pullback to the $92,000–$94,000 range would be constructive, allowing for reaccumulation and a more sustainable rally.
📈 Technical Triggers to Watch:
Retrace to 50% Level: Monitor for price action around $93,071–$94,593.
Accumulation Range: Look for a period of low volatility and tight range after the retrace.
Spring & Breakout: A false breakdown below the range, quickly reclaimed, followed by a strong bullish candle, would be the classic Wyckoff entry trigger.
⚠️ Disclaimer
This analysis is for informational purposes only and does not constitute financial advice. Cryptocurrency markets are highly volatile and risky. Always conduct your own research and consult with a professional before making investment decisions.

Market overview
📈 WHAT HAPPENED?
Last week, we saw an upward breakout from the consolidation phase, leading to a strong, nearly pullback-free long movement. By the end of the week, Bitcoin reached a long-term resistance level, where the momentum stalled, followed by a slight correction.
Currently, we observe weakening buying pressure, with diminishing higher highs. At the same time, there is a significant amount of market sales visible in cumulative delta, which have not resulted in any major moves. The market is in equilibrium, possibly preparing for the next impulse.
💼 WHAT WILL HAPPEN: OR NOT?
In the near term, we expect a retest of the current highs with potential false breakouts. After that, a resumption of selling pressure is possible. We will consider continuing long positions only after testing the nearest support levels.
Sell Zones:
$95,000–$96,700 (accumulated volumes)
$97,500–$98,400 (aggressive pushing volumes)
$107,000–$109,000 (volume anomalies)
Buy Zones:
$91,500–$90,000 (strong buying imbalance)
$88,100–$87,000 (market sell absorption)
$85,500–$84,000 (accumulated volumes)
$82,700–$81,400 (high volume area)
Level at $74,800
$69,000–$60,600 (accumulated volumes)
📰 IMPORTANT DATES
Macroeconomic events this week:
• April 29, Tuesday, 14:00 (UTC) — release of the US Consumer Confidence Index for April;
• April 29, Tuesday, 14:00 (UTC) — release of US JOLTS (Job Openings) data for March;
• April 30, Wednesday, 01:30 (UTC) — release of China’s Manufacturing PMI for April;
• April 30, Wednesday, 08:00 (UTC) — release of Germany’s GDP for Q1 2025;
• April 30, Wednesday, 12:00 (UTC) — release of Germany’s Consumer Price Index (CPI) for April;
• April 30, Wednesday, 12:15 (UTC) — release of US ADP Nonfarm Employment Change for April;
• April 30, Wednesday, 12:30 (UTC) — release of US GDP for Q1 2025;
• April 30, Wednesday, 14:00 (UTC) — release of US Core PCE Price Index for March, along with year-over-year comparison;
• May 1, Thursday, 03:00 (UTC) — release of Japan’s Interest Rate Decision;
• May 1, Thursday, 12:30 (UTC) — release of US Initial Jobless Claims;
• May 1, Thursday, 13:45 (UTC) — release of US Manufacturing PMI for April;
• May 1, Thursday, 14:00 (UTC) — release of US ISM Manufacturing PMI for April;
• May 2, Friday, 09:00 (UTC) — release of Eurozone Consumer Price Index (CPI) for April;
• May 2, Friday, 12:30 (UTC) — release of US Average Hourly Earnings, Nonfarm Payrolls, and Unemployment Rate for April.
*This post is not a financial recommendation. Make decisions based on your own experience.
#analytics

AI predict BTC\USD price, Unbelievable, Check This Out?BTC / USD. COINBASE. Apr 27, 2025 5:07 pm. BTC / USD. Comprehensive BTC/USD Trading Analysis & Strategy (April 25–27, 2025)
(All timestamps in ISO 8601 UTC)
---
I. Core Trend & Key Price Dynamics
1. Macro Trend:
- Mild Bullish Bias (+0.72% net gain) with extreme intraday volatility.
- Critical rejection at 95,500 resistance (tested on `2025-04-25T14:45:00Z`) and firm support at 93,000.
2. Volatility Clusters:
- High Volatility Phase:
- `2025-04-25T14:00–15:30Z`: Price swung between 94,440–95,564 with volume spikes (>750).
- Low Volatility Phase:
- `2025-04-27T00:00–20:00Z: Range tightened to 94,000–95,000, volume declined.
3. Pivotal Events:
- Bullish Breakout Failure: Sharp rejection at 95,564.90 (`2025-04-25T14:45Z`) led to consolidation.
- Bearish Engulfing Candle: At `2025-04-25T14:15Z` (volume: 846.26), signaling short-term top.
---
II. Multi-Indicator Convergence
| Indicator | Bullish Signals | Bearish Warnings |
|----------------------|---------------------------------------------|-----------------------------------------------|
| RSI 14 | Recovery from 40.79 (oversold) to 68.69 | Divergence at 61.24 as price rose (20:00Z) |
| CMF 20 | Surge to +0.428 (buying pressure, 17:45Z) | Drop to +0.056 (profit-taking, 20:00Z) |
| Supertrend | Bullish flip at 93,825.89 (18:30Z) | Flattening near 94,010.86 (indecision) |
| EMA 9 | Price sustained above EMA 9 (~94,300) | Failure to hold risks breakdown |
| Bollinger Bands | Breakout above upper band (94,191, 18:00Z) | Overextended near 94,540 (mean reversion risk)|
| MACD | Bullish crossover (17:45Z), peak at 47.61 | Histogram decline to 34.98 (momentum fade) |
| Stochastic RSI | Overbought (Fast K=100, 18:30Z) | Bearish divergence (Fast K=83.56 at 20:00Z) |
---
III. Strategic Trade Setups
A. Bullish Scenario (Confirmation Needed)
1. Entry:
- Break & Close Above 95,500 with volume >800.
- Retest of EMA 9 (~94,300) with RSI >50 and CMF >0.
2. Targets:
- 96,000 (psychological level), 97,500 (Fibonacci extension).
3. Stop-Loss:
- Below Supertrend (93,825) or 93,000 support.
B. Bearish Reversal (Caution Signs)
1. Entry Triggers:
- Close Below 94,000 with CMF <0 and RSI <50.
- MACD Bearish Crossover + Stochastic K/D cross below 80.
2. Targets:
- 93,000 (support), 91,500 (volume gap from 25th).
3. Stop-Loss:
- Above Bollinger Upper Band (94,540) or 95,500.
C. Neutral/Consolidation Play
- Range Trade: Fade extremes near 94,000–95,500.
- Stop-Loss: 1% outside the range.
---
IV. Critical Risk Factors
1. Divergence Risks: Bearish RSI/MACD/Stochastic divergences suggest upside exhaustion.
2. Volume Confirmation Needed: Bullish momentum requires volume >750 to sustain breaks.
3. External Catalysts: Watch for macro news (Fed policy, ETF inflows) around key timestamps.
---
V. Real-Time Alert Levels
| Level | Type | Significance |
|------------------|-------------|--------------------------------------------------|
| 95,500 | Resistance | Previous swing high; breakout invalidates bearish structure. |
| 94,300 | Support | EMA 9 dynamic support; loss opens path to 93,825. |
| 93,000 | Strong Support | Macro swing low; breakdown triggers panic selling. |
---
Final Outlook
- Short-Term (24–48h): Neutral-bullish with caution at resistance.
- Medium-Term (3–5d): Direction hinges on closing above 95,500 or below 93,000.
Immediate Action: Tighten stop-losses, book partial profits near 95,500, and await volume-backed breakout/breakdown.
(Indicators and price action analyzed in UTC timestamps for precision.) Disclaimer: This is not financial advice. Crypto markets are highly volatile and speculative. Always do your own research and consult a qualified financial advisor before investing. You could lose your entire investment.
