Bitcoinidea

Bitcoin: Navigating Market Volatility and Future PredictionsBitcoin, the pioneering cryptocurrency, continues to dominate headlines with its characteristic volatility and the ever-present speculation surrounding its future trajectory. Recent market activity and expert analyses paint a complex picture, one where potential for significant growth is tempered by inherent risks and external economic factors. Several key themes emerge from recent news and analysis, offering a glimpse into the current state of Bitcoin and the factors influencing its price.
The Potential for a US Crypto Reserve and its Impact
One of the most significant potential catalysts for Bitcoin's price is the possibility of the United States government establishing a strategic cryptocurrency reserve. This concept, championed by figures like MicroStrategy founder Michael Saylor and gaining traction within political circles, could have a profound impact on the market.
Saylor has publicly suggested that the US government should acquire one million Bitcoin for its strategic reserves. He argues that this would legitimize Bitcoin as "digital property" and instill greater confidence in the cryptocurrency. Saylor pointed out that MicroStrategy already holds approximately 500,000 Bitcoins, which accounts for about 2.4% of the worldwide supply. He also suggested that the government could finance such a large crypto reserve through a deliberate, multi-year timeline, referencing a "six-month process" set out by a recent executive order.
There is research that supports this view, estimating that a US crypto reserve could boost Bitcoin's market capitalization by roughly 25%, or approximately $460 billion. This potential surge is attributed to Bitcoin's limited liquid supply, meaning that large inflows from a government purchase could trigger upward price shocks. Furthermore, such a move could incentivize institutional investors and other countries' governments to allocate funds to Bitcoin, creating a positive feedback loop.
While the idea has gained traction, particularly with endorsements from figures like Donald Trump, the path to establishing a national crypto reserve is not without its hurdles. Confusing messaging, legal challenges, and uneven progress across different states contribute to market uncertainty. The market currently views the probability of a national Bitcoin stockpile as relatively low due to challenges like confusing messaging and legal hurdles.
Market Sentiment and Price Predictions
Despite the potential for significant growth, market sentiment surrounding Bitcoin remains cautious. The Crypto Fear & Greed Index, a measure of overall market sentiment, consistently hovers in "Extreme Fear," even amidst price spikes. This suggests that while investors are drawn to potential gains, underlying anxieties about volatility and external economic pressures persist.
Predicting Bitcoin's price with certainty remains an elusive task, but analysts offer varying perspectives. Master Ananda, for example, believes that Bitcoin's price bottom is in, following a recent dip below $80,000.
However, other analysts urge caution. The recent rebound of Bitcoin to over $90,000 was short-lived, with the price retreating due to concerns about a potential recession, geopolitical tensions in Ukraine, and uncertainty surrounding the US crypto reserve. This highlights the sensitivity of Bitcoin to broader economic factors and geopolitical events.
Technical Analysis and Market Dynamics
Technical analysis of Bitcoin's price charts provides further insights into its current state. The recent formation of back-to-back weekly "hammer candles," a pattern seen only a handful of times in Bitcoin's history, suggests potential bullish momentum. However, the failure of a recent price rebound to break through key resistance levels indicates that the path to higher prices may not be straightforward.
The relationship between Bitcoin and traditional financial markets, particularly the S&P 500, also plays a crucial role. Historically, Bitcoin has struggled during periods of high volatility in the S&P 500, as measured by the VIX. This correlation suggests that broader economic anxieties can negatively impact Bitcoin's price.
The Influence of Global Liquidity and External Factors
Beyond specific events and technical indicators, broader macroeconomic factors influence Bitcoin's trajectory. Analyses suggest that global liquidity trends favor crypto and risk assets. The global money supply is expected to reach new all-time highs, potentially boosting Bitcoin's price. A dropping US Dollar Index (DXY) also signals a shift in favor of crypto.
The upcoming US Crypto Summit, organized by the Trump administration, is anticipated to be a key event that could provide clarity and potentially influence Bitcoin's future trajectory. Market participants are eagerly awaiting the summit's outcomes, as they could provide crucial insights into the regulatory landscape and government's stance on cryptocurrencies.
Conclusion
Bitcoin's current landscape is a complex interplay of potential catalysts, market sentiment, technical indicators, and macroeconomic forces. The possibility of a US crypto reserve offers a significant upside potential, but market anxieties and external economic pressures create a degree of uncertainty. While some analysts predict a rapid surge in price, others emphasize the need for caution and highlight the importance of monitoring broader market dynamics. As Bitcoin continues to evolve, its price will likely remain sensitive to both internal developments within the cryptocurrency ecosystem and external factors shaping the global economy. The upcoming US Crypto Summit and future policy decisions will be critical in shaping Bitcoin's future direction.

BTC/USD LONG SET UPEntry Price 1: $78,500
Entry Price 2: $73,500
Stop Loss: $68,500
Take Profit 1: $85,000
Take Profit 2: $95,000
Take Profit 3: $105,000
Take Profit 4: $115,000
Status: ACTIVE

Bitcoin Holds Strong Above 200MA – Is the Next Rally Incoming?Bitcoin has successfully defended the $84K-$86K support zone, with the CME gap now fully closed. On the daily timeframe, BTC remains above the 200MA, signaling strong bullish momentum. With macroeconomic factors aligning in favor of crypto, this could be the start of another leg higher.
Technical Analysis:
• Support Zone: $84K - $86K held firm, preventing further downside.
• CME Gap Closure: The retracement completed the necessary gap-fill, eliminating inefficiencies.
• Trend Reversal Signal: BTC has reclaimed the 200MA on the daily chart, reinforcing bullish sentiment.
• Breakout Watch: Price is approaching a descending trendline, a breakout above could trigger a strong move toward the $110K target.
Fundamental Analysis:
• Bitcoin ETF Impact: Institutional demand continues to grow with ETF adoption.
• Macroeconomic Tailwinds: The Fed’s expected slowdown in rate hikes is a net positive for risk assets like BTC.
• Geopolitical Factors: Increased demand for BTC as a hedge against economic instability and inflation.
• Regulatory Developments: A more constructive approach from regulators supports long-term adoption.
With bullish momentum building, Bitcoin is at a key inflection point. Will it break out and push towards new highs? Stay tuned and trade wisely!
Note: Please remember to adjust this trade idea according to your individual trading conditions, including position size, broker-specific price variations, and any relevant external factors. Every trader’s situation is unique, so it’s crucial to tailor your approach to your own risk tolerance and market environment.

[Update BTC] (1-2-3-4-5)+(WXY) x 2This model is in line with my previous work.
I'm expecting between 77k and 110k (less probable).
This is 2017 but accelerated.
It's going twice the speed but we will see decreasing returns.
Alts-->Higher

Bitcoin Longif you want to trade Bitcoin here's my trade:
entry price: 88000
stoploss: 78000
target profit 138k or 200k or higher

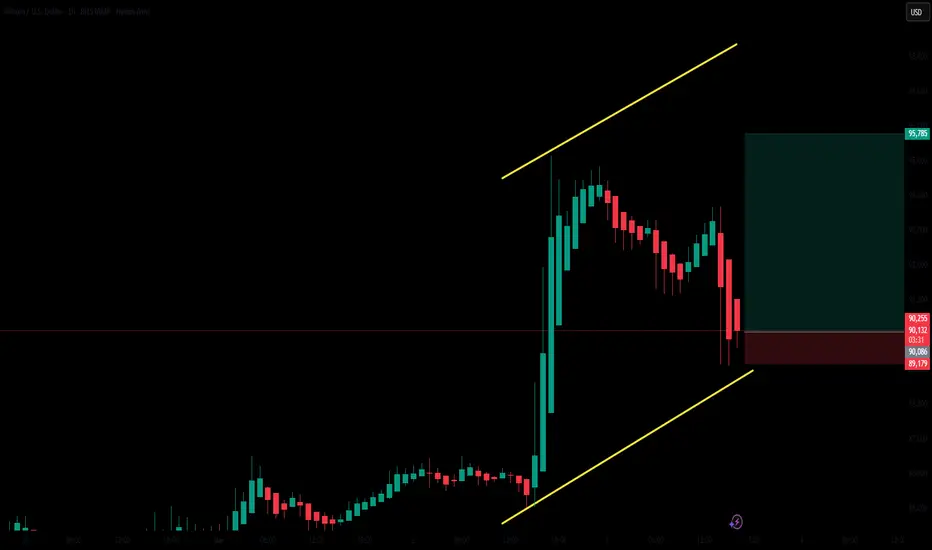
Bullish move on the 1 hour chart?There might be a possible bullish move on the 1 hour chart before a deep fall.
Stop loss: 89k
My FINAL Bitcoin chart and Idea (forever)Everyone is too busy focusing on the wrong Technicals. Fear and Greed, RSI, MACD, Stock Markets, etc. All of these are good tools but we have to remember a few things:
1. Zoom out (Bitcoin follows the same 4-year cycle every time... this time is NOT different)
2. Keep it Simple (I'm tired of messy charts, only put what you need for the current timeframe)
3. Avoid Leverage (These areas are too risky and much too volatile... liquidity is getting grabbed at almost every level) Stay safe.
I expect Bitcoin to retrace to $57k and then bounce back up... clear skies ahead if we can break out of this pattern I have drawn up. (If not we keep ranging as follows until we break significantly above the previous ATH)
Peace out! It's been fun... I may return to crypto one day (if ykyk)

Long Story short for BTCHistory hasn't failed yet, so the four-year cycle is still intact until it isn't. I have stretched this chart out for the next couple of years so that you can get a good idea of where the potential bottom will be during the next bear market. I plan to accumulate as much as possible the closer it gets to 66k. If we do reach a 150-250k top this cycle then I will expect a bear market bottom between 66-76k. Watch my levels and use them as a guideline. Historically Bitcoin has NEVER returned to the price its low during the US election week:
2012 Election Week Low - $10
2016 Election Week Low - $700
2020 Election Week Low - $13,200
2024 Election Week Low - $66,800
that brings us to now... if this doesn't indicate the current market sentiment then I don't know what will. There's a reason why many genius economists are speculating a 1 million dollar bitcoin in the next 8 years.

From $110K to $66K? The Political Game Behind BitcoinBitcoin's surge from $73,000 to $110,000 was purely driven by political factors and Trump's statements. However, after Trump took office, the market was waiting for a stimulus to continue its bullish rally. With Trump's silence and the start of a trade war, sellers took control, leading to a 30% correction from the all-time high.
🚨 Key question: What happens next? 🚨
📉 If Bitcoin doesn’t receive further political support from Trump, we could see a drop below $73,000, possibly even $66,000!
Is this a buying opportunity or a warning sign? Let me know your thoughts! 👇💬🚀

Bitcoin BTC Is Ready To Take Off!Hello, Skyrexians!
Yesterday we pointed out that 0.5 Fibonacci has been reached at $80k and this dump will not continue. Today we have a great bounce above $85 and the great chart to be sure that our previous scenario is right.
Let's take a look at the daily time frame. As usual we have the 5 Elliott wave cycle which has been started at GETTEX:49K and finished at $110k. Then the current correction has been started. Yesterday this ABC zigzag has reached the 0.5 Fibonacci retracement and bounced back. The great thing is the green dot on the Bullish/Bearish Reversal Bar Indicator inside the target zone. This gives us 90% probability that price has found the bottom and ready for the next huge wave to the upside.
Best regards,
Skyrexio Team
___________________________________________________________
Please, boost this article and subscribe our page if you like analysis!

BITCOIN Final update !!! We're about to BOOM!!!According to bigger picture, we're still in bull market, 5th of macro and ending 4th of micro elliott wave.
Good news is, that we're about to get back into bullish mega green candles soon!!
BTC's major CME gap has been filled and this was also the region where FVG is also available and also corrective pattern (double three) Y ends in this region in combining with expanded flat's C. we may most probably by will of GOD almighty will see green days in coming weeks. Targets of wave 5 are up to 120-130K region.

BITCOIN Strong Bearish Breakout!
HI,Traders !
BITCOIN is trading in a
Downtrend and
Broke the key horizontal
Level of 92425.6 and the
Breakout is confirmed
Which reinforces our
Bearish bias and makes
Us expect a further
Bearish continuation !
Comment and subscribe to help us grow !

Bitcoin Dropped Below $80k: Will This Nightmare Will Be Stopped?Hello, Skyrexians!
Despite the extreme fear tonight BITSTAMP:BTCUSD continues going down and finally broke $80k. Investors are panic selling right now and don't know what to do. But we pointed out earlier that the most impulsive part of bull run ahead and current dump is just the correction.
Let's take a look at the weekly time frame. Here we can see that the potentially strongest reversal signal has been broken. We are talking about divergence with AO. That is the reason why we marked that waves 1 and 2 like you see on the chart. According to this counting we can see that wave's 3 targets are at the $140k and $190k. At the same time we wanna tell you that the strong resistance is located at 1 Fibonacci level at $110k and we have seen it already.
Current dump is wave 2 inside wave 3. It has the target between 0.5 and 0.61. The first one has been already reached. We expect reversal from here. Moreover Fractal Trend Detector is showing us bull run support with the green zone and now we see its retest.
Best regards,
Skyrexio Team
___________________________________________________________
Please, boost this article and subscribe our page if you like analysis!

BTC at a Make-or-Break Level Bitcoin is at a tipping point. If it stays under GETTEX:87K , we could see a drop to $80,806, and if that doesn’t hold, $75K is on the table. But if BTC breaks through GETTEX:87K , momentum could push it to $88,800, and a move past $92,121 would signal the correction is over and the uptrend is back. This is a key moment—let’s see where it goes.
Kris/Mindbloome Exchange
Trade Smarter Live Better

BITCOIN trading plan 25/2/20251. Bitcoin (BTC) is currently showing signs of a potential sell opportunity, with a target set at $82,000.
2. Traders should closely monitor market trends and resistance levels before executing any sell orders.
3. If Bitcoin approaches the $82,000 mark, it may face profit-taking pressure, leading to a price correction.
4. Technical indicators, such as RSI and moving averages, can provide additional confirmation for the sell strategy.
5. Market sentiment and external factors, including regulatory updates and macroeconomic trends, should also be considered.
6. A disciplined approach with proper risk management will help traders maximize profits while minimizing potential losses.
7. It is crucial to set stop-loss levels to protect against unexpected market reversals.
8. Historical patterns suggest that after reaching new highs, Bitcoin often experiences temporary pullbacks.
9. Traders should stay informed about institutional activities, as large sell-offs by major holders can impact price movements.
10. While Bitcoin remains a strong long-term asset, short-term traders can capitalize on volatility by strategically selling at key resistance levels.

It's Time for Bitcoin's Future Trend!As I mentioned in my post yesterday, there was a possibility of the price dropping to the 0.5 Fibonacci zone, from which I expected active buying followed by a trend reversal for Bitcoin and the entire crypto market.
The price of Bitcoin has dropped to the 0.5 Fibonacci level, and this was enough to trigger a reaction. We’ve already seen a +2,000 price bounce, and there may still be some volatility with price movements up and down, but a drop below 82k is unlikely. I’m waiting for the daily candle to close, after which I will consider my strategy for opening a position.

Bitcoin Breaks Major Support: Time to Enter Short Positions...?Bitcoin has recently broken through a crucial support level of $92000 on the daily timeframe, following almost three months of consolidation. It may be prudent to hold off on entering a short position until a retest of the $92000 level occurs. The next significant support area to consider is approximately $73000, which could serve as a target for any potential short positions.

Bitcoin Maxis: Your Delusion Is About to Get Liquidated!Oh look, Bitcoin maxis are back at it again—screaming "NEW ALL-TIME HIGH SOON! 🚀" while conveniently ignoring every single warning sign flashing like a Christmas tree on fire. 🔥🎄
Shall we take a quick reality check? Let's talk about that chart—the one showing a huge bearish divergence on the RSI . Yeah, that thing maxis pretend doesn't exist because, apparently, TA is for "normies." Price is pushing up, but momentum? Looking about as exhausted as a degenerate who just YOLO'd their life savings into a dog coin. This is not a bullish sign.
Last time we saw this pattern? Oh right—November 2021, right before Bitcoin went from $69K to $15K in record time. But hey, I’m sure "this time is different," right? 😂
Then there’s the rising wedge , which is basically a giant neon sign saying, "Hey, we’re about to dump!" But maxis, bless their little diamond hands, will call it "accumulation" while their portfolios get sliced like a Thanksgiving turkey. 🍗
Now, let’s talk targets. 20K? Very possible. 15K? Wouldn’t be shocking. The big green arrows in the chart? Yeah, they’re not pointing up. But don’t worry, you’ll still hear "BUY THE DIP!" echoing through the wreckage as another cycle of hopium plays out in real time.
At the end of the day, Bitcoin maxis don’t need technical analysis—they need therapy. Because no matter how many times the market smacks them in the face, they’ll still be here, shouting " Number go up !" while ignoring every single warning sign. 😆
Tick. Tock. The market doesn’t care about your laser eyes. 🕰️

BITCOIN WILL EXPECTED TO 125000!!!As you can see now bitcoin make 4th cycle of elliot wave, and today we're gonna wait for price hit to minor support, the minimum takeprofit will be at 98000.

Bitcoin Plummets: ETF Exodus, Liquidations, and Global Jitters
Bitcoin's recent plunge below the $90,000 threshold, a level unseen since November 2024, has sent ripples of concern through the cryptocurrency market. This sharp correction is attributed to a confluence of factors, including persistent ETF outflows, a surge in leveraged liquidations, and mounting geopolitical tensions, creating a volatile environment that has shaken investor confidence.
The most immediate catalyst for Bitcoin's decline has been the sustained outflows from US-listed Bitcoin ETFs. These exchange-traded funds, which had previously fueled Bitcoin's ascent by providing institutional investors with easy access to the cryptocurrency, have recently witnessed a reversal in sentiment. Investors, possibly reacting to broader market anxieties and profit-taking, have begun withdrawing funds, putting downward pressure on Bitcoin's price. This outflow signals a shift in institutional appetite, raising questions about the sustainability of the previous bullish momentum.
Adding fuel to the fire, the crypto market has experienced a significant wave of liquidations. Over $1.3 billion in leveraged positions were wiped out as Bitcoin's price plummeted. These liquidations, which occur when traders using borrowed funds are unable to meet margin requirements, exacerbate price volatility by triggering cascading sell orders. The sheer volume of liquidations underscores the high degree of leverage prevalent in the crypto market, highlighting the inherent risks associated with such trading strategies.
Furthermore, macroeconomic uncertainties are contributing to the risk-off sentiment permeating financial markets. The recent strengthening of the Japanese yen, often seen as a safe-haven asset, reflects investor concerns about global economic stability. Similarly, the dip in Nasdaq futures suggests a broader aversion to risk in traditional equity markets, which often spills over into the crypto space. The re-emergence of US-China trade tensions adds another layer of uncertainty, as any escalation could have far-reaching economic consequences, impacting investor sentiment and asset valuations.
The technical outlook for Bitcoin remains precarious. Analysts are closely monitoring the $85,000 support level, which, if breached, could trigger a further sell-off. The potential for over $1 billion in long liquidations below this level suggests that a significant drop is possible. Some analysts are even warning of a potential free fall to $81,000 if the $85,000 support fails to hold, indicating a severe test of market resilience.
Moreover, a more dire prediction posits that Bitcoin could potentially drop below $70,000, erasing gains made since the US election. This scenario, while alarming, highlights the vulnerability of Bitcoin to macroeconomic factors and investor sentiment. The prospect of a significant correction raises concerns about the stability of the crypto market and its ability to withstand external shocks.
The current market conditions serve as a stark reminder of the inherent volatility of cryptocurrencies. While Bitcoin has demonstrated remarkable resilience in the past, its price remains susceptible to a wide range of factors, including ETF flows, leveraged trading, and global economic conditions. Investors must remain vigilant and exercise caution in navigating this turbulent landscape.
The recent downturn underscores the importance of risk management in cryptocurrency trading. Leveraged positions, while offering the potential for amplified gains, also carry the risk of substantial losses. The high degree of leverage prevalent in the market can exacerbate price swings, leading to rapid liquidations and further downward pressure.
Furthermore, the growing correlation between traditional financial markets and the crypto space highlights the need for investors to consider broader macroeconomic factors. Changes in interest rates, inflation, and geopolitical tensions can all impact investor sentiment and asset valuations.
In conclusion, Bitcoin's recent tumble below $90,000 reflects a confluence of factors, including ETF outflows, leveraged liquidations, and global economic uncertainties. The market remains highly volatile, and further price swings are possible. Investors should exercise caution and prioritize risk management in navigating this challenging environment. The ability of Bitcoin to recover from this downturn will depend on a variety of factors, including the resumption of ETF inflows, a reduction in leveraged trading, and a stabilization of global economic conditions. The coming weeks will be critical in determining whether Bitcoin can regain its footing or succumb to further downward pressure.

Important Bitcoin levels. The game of expectations.Today, it is important for Bitcoin to close below 88,000. There is a high probability that today the price will drop to the 0.5 Fibonacci level, thereby partially closing the gap on the daily chart, and the RSI will consolidate below 30 even with a closing price below 88,000. All these factors combined will be sufficient to trigger strong accumulation with a breakdown of the structure, leading to a new all-time high within the next 2-3 weeks.
However, the market doesn’t always play out perfectly. There remains a possibility of a prolonged scenario. In this case, from the current price block (88k - 86k), the price may form a local bounce with a full ABC cycle in the coming days and test the key resistance level (106,200). After that, the price will likely return to the 0.5 Fibonacci level and possibly retest this important level.
A similar scenario occurred last year during a similar phase of prolonged correction, where the price eventually reached the 0.5 Fibonacci level, though not immediately.

What's next can we expect from Bitcoin???Bitcoin after making All-time-high is being trading in a long range. According to range trading rule, btc is currently trading under the range low.
Now, if we see range low reclaim, then we can see btc making new ATH (green line).
If btc doesn't holds it's support, then we may probably see btc tapping into it's fvg and from there we can expect great reversal (blue line).
bad case scenario if btc dumps below 80K (major CME gap region) (yellow line).
