Bitcoin AnalysisIf the $61,000 support is broken, there is a fair value gap down to $42.00. All traders should be cautious as volatility may reach maximum levels in this gap. This is also a sign that the double top pattern is working. The $61,000 support is very important.
Bitcoinlong

BTC rebound imminentMixed trading signals are anticipated for the next 24 hours in the crypto market. Bitcoin is experiencing tropical conditions, pointing to strong buy signals and a rebound from these levels.
Bitcoin fell below $66,000 on Monday morning, extending last week's decline due to new U.S. economic data. After nearing all-time highs above $71,000 earlier this month, Bitcoin and the broader crypto market have cooled, with Bitcoin briefly dipping below $65,000 over the weekend.
Follow us for more crypto weather reports!

Elliott Wave Analysis on Bitcoin (BTCUSD)Elliott Wave Analysis on Bitcoin (BTCUSD)
Wave (I) and Wave (II) on Weekly Time Frame
Starting from the beginning of the Bitcoin chart, the first significant move up in price has been labeled as Supercycle wave (I). This wave represented the initial major bull run in Bitcoin's history, culminating in a peak, followed by a corrective phase, labeled as Supercycle wave (II). This corrective wave ended at the low observed in November 2022.
- Supercycle Wave (I): This wave exhibited impulsive characteristics with five clear subdivisions (waves 1, 2, 3, 4, and 5).
- Supercycle Wave (II): This was a corrective wave, taking the form of an ABC correction, and concluded in November 2022.
Wave (III) on Weekly Time Frame
Since the low of November 2022, Bitcoin has been unfolding Supercycle wave (III). This wave is expected to be a major bullish phase, often characterized by strong upward momentum and significant price increases. Wave (III) typically shows the following characteristics:
- Strength and Momentum: Wave (III) is usually the longest and most powerful wave in a five-wave cycle.
- High Volume: Accompanied by increased trading volume, indicating strong market interest.
- Impulsive Nature: This wave should subdivide into five smaller waves on a lower time frame, confirming its impulsive nature.
Subdivisions of Wave (III) on Daily Time Frame
Within the context of Wave (III) on the weekly time frame, we are currently analyzing the subdivisions on the daily time frame. The current structure suggests the following:
- Wave ((1)) of Wave (III): This wave is unfolding and subdividing into five smaller waves.
- Wave (1), (2), and (3) of ((1)): These waves have been completed.
- Wave (4) of ((1)): Recently completed around April 2024.
- Wave (5) of ((1)): Expected to breach the all-time high to confirm the start.
Current Status and Invalidation
- Current Status: Bitcoin is potentially in Wave (5) of ((1)) of Wave (III), which needs to breach the all-time high for confirmation.
- Invalidation Point: If the low of April 2024 (where Wave (4) finished) is breached, this would invalidate the current count. It would suggest that Wave (4) is still unfolding, possibly as a double correction.
Characteristics and Structure of Wave (III)
1. Wave ((1)): Typically the smallest wave but should be identifiable as a five-wave move.
2. Wave ((2)): A corrective wave, usually retracing between 50% to 61.8% of Wave ((1)).
3. Wave ((3)): Often the largest and most powerful wave, usually extends to 161.8% of Wave ((1)).
4. Wave ((4)): Another corrective wave, typically shallow, often retracing 23.6% to 38.2% of Wave ((3)).
5. Wave ((5)): Completes the impulse sequence, may extend or truncate but should be a five-wave move.
Conclusion
The Elliott Wave analysis on Bitcoin (BTCUSD) indicates a bullish market ahead, driven by the development of Supercycle wave (III). This analysis is based on the assumption that the low of April 2024 will hold, confirming the end of Wave (4) of ((1)) and the start of Wave (5) of ((1)). If this low is breached, the market might still be in Wave (4), unfolding as a double correction.
I am not Sebi registered analyst.
My studies are for educational purpose only.
Please Consult your financial advisor before trading or investing.
I am not responsible for any kinds of your profits and your losses.
Most investors treat trading as a hobby because they have a full-time job doing something else.
However, If you treat trading like a business, it will pay you like a business.
If you treat like a hobby, hobbies don't pay, they cost you...!
Hope this post is helpful to community
Thanks
RK💕
Disclaimer and Risk Warning.
The analysis and discussion provided on in.tradingview.com is intended for educational purposes only and should not be relied upon for trading decisions. RK_Charts is not an investment adviser and the information provided here should not be taken as professional investment advice. Before buying or selling any investments, securities, or precious metals, it is recommended that you conduct your own due diligence. RK_Charts does not share in your profits and will not take responsibility for any losses you may incur. So Please Consult your financial advisor before trading or investing.

USDT.D Logarithmic Trend Compared to Bitcoin TrendIn the long term, USDT dominance is in an uptrend. Within this trend, it often rises slowly, suppressing Bitcoin and altcoins, sometimes sideways, sometimes causing price declines. Then, with the sudden drops that follow, it puts Bitcoin and altcoins into a very sharp bull season. Right now, USDT is in an uptrend. I think that Bitcoin will enter a sideways channel as long as USDT remains in an uptrend. After this channel, a drop in USDT will put Bitcoin back into the bull season.

BTC's next moveIf BTC doesn't reach $66k, then this scenario will most likely play out. However, this isn't a bear trend; it's just complex sideways movement.

Don't miss it! DOGE analysis UPDATEEverything will pump soon and everything is still cheap today
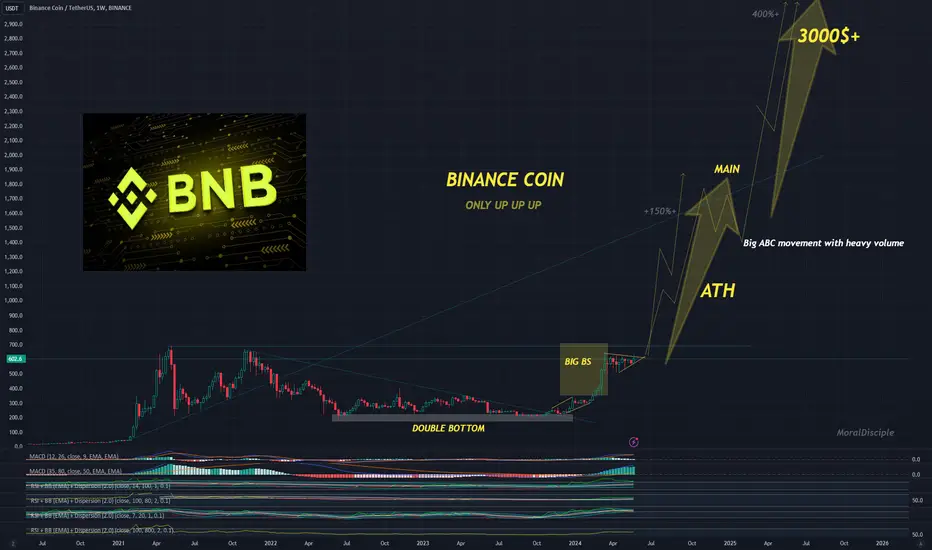
BTC has reached BS or 70k and many other important factors are only good.
Only up
MoralDisciple

A powerful crypto exchange that just started. UPDATEEverything is pumping and rising soon, US500, EURUSD, GOLD, BITCOIN ETC
It is a coin of a major crypto exchange and definitely a good choice. The crypto industry is in its infancy
Only up!
Bitcoin is going to shoot up to $112k+ in June / JulyAll details are drawn on the chart.
Basically BTC is in a huge bull market with a clear imbalance of demand and supply. There was 3-month long reaccumulation period at all time high of $69500 with all outstanding supply bought up. Price is gonna shoot up to $112k at minimum very swiftly.

100k for this summer! Always greenBitcoin is designed to grow forever and works like the US500 but only with higher volume.
BTC volume is incredible and I won't be surprised if we see 100k++ within 3 months or summer.
3-17 June 2w closes in green!!
More details on the MD channel or in future updates.
I wish you success and see you at the top! MD

BTCUSD BITCOIN USDTHELLO dear its easy just like how i pattern
target 72000$ second T 83000$
thanks.
it is not buy signal
it is my thoughts do your analysis and after that trade!

BTCUSD: High chance to see 75k+ soon. Here's why!Please see previous btc ideas for more context
☝️Do not act based on my analysis, do your own research!!
The main purpose of my resources is free, actionable education for anyone who wants to learn trading and improve mental and technical trading skills. Learn from hundreds of videos and the real story of a particular trader, with all the mistakes and pain on the way to consistency. I'm always glad to discuss and answer questions. 🙌
☝️ALL ideas and videos here are for sharing my experience purposes only, not financial advice, NOT A SIGNAL. YOUR TRADES ARE YOUR COMPLETE RESPONSIBILITY. Everything here should be treated as a simulated, educational environment. Important disclaimer - this idea is just a possibility and my extremely subjective opinion. Do not act based on my analysis, do your own research!!

Bitcoin looks good for a 20% upmove from current levelsKUCOIN:BTCUSDT has been hovering around and below 70k+ levels for few months now and looks prime to make an upmove after breaking this zone.
If we draw a trendline using the highest close values then we have got a marginal close above the trendline this week and today, #BTC is again trying to push past it. If it manages to convincingly breakout above this trendline, we might see a 20% upmove from current levels.
Keep an eye!

Bitcoin on track As you can see Bitcoin is trying to bounce from the support area i drawed yesterday. Nothing new for us, and i want to see a lower low as a confirmation of a possible reversal pattern. I am entering long now with a tight stop just below local bottom targeting the 70K area. Will keep updated

BTCUSDT#BTC #Bitcoin Chart Update: We've reached an important support level and are poised to move upwards from here. There's no reason to panic sell at a loss. When looking at Bitcoin liquidations over 3-day, 7-day, and 1-month periods, we see significant amounts of liquidity, amounting to billions of dollars, accumulating around the 71k level. Almost all indicators and data point to an upward trend. We can position ourselves accordingly.

77k is on the horizonThe formation of a rising pattern is about to end, it could be a flag, which could take us to 77K , if its not a flag we can go lower but at the end bull trend is intact.

BTCUSD BUY (80k soon!!)Hi fellow traders, BTCUSD will be ready to make a move higher from the blue box after it completes the flat correction. Target the 79219.46 level. Good luck and trade safe!


Bitcoin's Stalled Breakout: A Test of Bullish Resolve
Bitcoin (BTC) ended last week with a whimper, failing to decisively break out of a bullish technical pattern and overcome key resistance levels. This has left many investors questioning the short-term trajectory of the world's leading cryptocurrency. After a price drop on Friday and a lackluster weekend, what can we expect from Bitcoin in the coming days and weeks?
The Failed Breakout and Bullish Doubts
The recent price action centered around a prominent technical pattern known as a bull flag. This pattern typically precedes a bullish continuation, with a price consolidation period following an uptrend. However, Bitcoin's attempt to break above the flag's resistance level at the end of the week proved unsuccessful. This failed breakout has cast doubt on the immediate bullish momentum and raised concerns about a potential reversal.
Technical Indicators: A Mixed Bag
Adding to the uncertainty are technical indicators that paint a conflicting picture. Some, like the Relative Strength Index (RSI), are hovering around neutral territory, suggesting neither overbought nor oversold conditions. This could be interpreted as a sign of potential buying pressure waiting to be unleashed.
However, other indicators like the "death cross" – formed when the 50-day moving average dips below the 200-day moving average – have emerged, historically hinting at a possible short-term price decline.
The ETF Inflow vs. Hedge Fund Shorting Tug-of-War
Beyond technicals, a fascinating dynamic is playing out between two opposing forces in the market: inflows into Bitcoin Exchange-Traded Funds (ETFs) and short positions taken by hedge funds.
On the bullish side, significant inflows into Bitcoin ETFs have been observed. This suggests institutional interest in the cryptocurrency remains strong, potentially providing a buying force that could propel the price upwards.
However, this optimism is countered by reports of hedge funds taking large short positions on Bitcoin. These bets essentially profit if the price falls. This shorting activity could act as a headwind, potentially hindering any significant price gains.
Short-Term Bounce vs. Long-Term Trend
While a short-term bounce from current levels seems likely, predicting the long-term direction of Bitcoin remains a challenge. The failed breakout and bearish technical indicators raise concerns about a potential downward correction. However, the underlying fundamentals, including strong institutional interest and Bitcoin's limited supply, suggest long-term bullish potential.
The Bottom Line: Patience and a Multifaceted Approach
For investors, the current situation necessitates a patient and multifaceted approach. Monitoring both technical indicators and on-chain data to gauge investor sentiment can provide valuable insights. Additionally, staying informed about regulatory developments and broader market trends is crucial, as these external factors can significantly influence Bitcoin's price.
Ultimately, while the immediate future of Bitcoin is uncertain, one thing remains clear: the battle between bulls and bears is far from over. The coming weeks will be telling, revealing whether Bitcoin can gather enough strength to overcome the recent setbacks and continue its upward trajectory.

Breaking $72,000 as a Catalyst for a Surge to $180,000+As we closely monitor Bitcoin's price movements, a critical resistance level at $72,000 stands out. If Bitcoin successfully breaks through this barrier, it could signal the beginning of a significant upward trajectory. The implications of surpassing $72,000 are substantial, potentially driving momentum that propels Bitcoin to new all-time highs.
Reflecting on historical trends and market cycles, it's evident that Bitcoin is on the verge of entering a new bull market phase. Analyzing the patterns and growth from previous years, there are compelling indicators suggesting that Bitcoin's next peak is on the horizon. I anticipate that we will see Bitcoin's value soar between April and September of 2025, reaching levels above $180,000.
Several factors support this bullish outlook. The increasing institutional adoption, growing acceptance as a store of value, and technological advancements within the blockchain space all contribute to the potential for significant price appreciation. Moreover, the macroeconomic environment, characterized by inflation concerns and a search for alternative assets, further bolsters the case for Bitcoin's continued growth.
In conclusion, breaking the $72,000 mark is more than just a price milestone; it could be the trigger for a substantial bullish run. With the potential peak projected between April and September 2025, reaching above $180,000, Bitcoin's future looks exceptionally promising. Investors and enthusiasts alike should keep a close eye on these key levels and prepare for the opportunities that lie ahead in this dynamic and evolving market.

Altcoin/Bitcoin AnalysisAs I always say, when I look at the ALT/BTC parity, not the Bitcoin price, I see a downward break in the 40th week of 2019. This breakdown may happen again, it is possible. After this breakout, I expect to see a scenario in which Bitcoin becomes in a channel. (70 - 50k) This scenario would also not be contrary to the macro perspective of the markets globally. Another chart that supports this scenario is the USDT dominance chart. We can think that this chart will reduce the price of Bitcoin as it rejects the uptrend and rises to decide the continuation of the trend. Seeing the rise of Bitcoin dominance in this process signals to me that some altcoins in particular will be hit hard. Therefore, there will be great bleeding in the altcoin market, except for the solid altcoins. However, the altcoins that survive this process will make ATH much more performant as Bitcoin reaches its 100k target.

Bitcoin 4-Year Market Cycle Visualization ChartI created this chart mostly out of boredom.
I'm not sure that it has any value or that we can learn anything from it.
Each 4-year period starts at the previous bear market low.
You can see that the first market cycle is abbreviated, so there is a large overlap of the first 4-year period into the second 4-year period.
The overlap continues to shrink in the following cycles.
This chart also shows how long it took to surpass the previous all-time high after a bear market low.
The time it took to surpass the previous all-time high during the second and third market cycles are similar at around 2 years.
But the time it took to surpass the 2021 all-time high during this current market cycle only took 16 months.
This timing is similar to the first market cycle which took 15 months to surpass the previous all-time high.
Whether or not this is an indication that this current market cycle may more closely resemble the first market cycle rather than cycles 2 and 3 remains to be seen.
Another similarity between the second and third market cycles is when they both peaked. Both peaked just short of the three year mark.
But looking at the first cycle we can see that it peaked at almost exactly the two year mark.
If this current market cycle is mimicking the first market cycle then I would expect a peak around November of this year.
But if the pattern of the previous two market cycles continues this market cycle then I wouldn't expect a peak until late 2025.
There is no way to predict with any certainty how this market cycle will play out.
All we can do is strap in and go along for the ride.
I think that is what makes this asset class so exciting, we have our own ideas about what is coming but we really never know just how crazy it will be.

A Bitcoin Compression patternBitcoin appears to be compressing near all-time highs in what looks like an ascending triangle. Previously, Bitcoin would pierce the ascending triangle to the downside and the result would be the liquidation of all of the leverage in the system, then the price of Bitcoin would proceed to chop around more before eventually moving higher. Essentially, the ascending triangle pattern would be extended by double the amount of time, give or take. I have found this example in many uptrends in crypto and specifically in Bitcoin.
While this scenario could certainly play out again, I lean more toward a sooner breakout before this type of scenario happens. Why? Quite simply - ETFs and big money have entered the market. A lot of these players are accumulating bitcoin for the long term in spot. The brokers will have a new fear to face besides waiting to liquidate people, what if they can't? It will force them to cover and the price could start driving higher sooner. This fact alone could lead Bitcoin to not follow its "usual" path of a breakdown first and an extension of its compression pattern and instead break to the upside and continue its journey further north.
For now, we wait and see what happens.
Cheers,
TCD

Bitcoin Poised for Surge Towards $85,000?Bitcoin (BTC) bulls are back in the driving seat, predicting a potential surge towards $85,000 in the coming months. This bullish forecast comes amidst heightened anticipation surrounding key U.S. economic data that could significantly influence investor sentiment towards the Federal Reserve's (Fed) monetary policy trajectory.
Technical analysts are pointing to a trendline formed by connecting several price points on Bitcoin's chart, suggesting a potential trajectory towards the coveted $85,000 mark. This technical analysis hinges on the assumption that the price will continue to follow the established trendline.
Factors Fueling Bitcoin's Optimism
Several factors are contributing to the renewed optimism surrounding Bitcoin:
• Potential Fed Rate Cuts: The upcoming release of key U.S. economic data, such as inflation figures and employment numbers, is keenly awaited by investors. If this data indicates a softening of the U.S. economy, it could bolster expectations of a rate cut by the Fed. A dovish pivot by the Fed, potentially lowering interest rates, is generally considered positive for riskier assets like Bitcoin, as it increases liquidity in the market.
• Institutional Adoption: The continual rise in institutional adoption of Bitcoin is another tailwind for the cryptocurrency. Major financial institutions are increasingly offering Bitcoin-related products and services to their clients, signifying growing acceptance and legitimacy within the traditional financial landscape. This broader institutional participation lends further credence to Bitcoin as a viable asset class.
• Scarcity: With a capped supply of 21 million Bitcoins, scarcity is a fundamental property baked into Bitcoin's design. This inherent scarcity, coupled with rising demand, could theoretically drive up the price of Bitcoin in the long term.
• Store of Value Narrative: Bitcoin proponents tout the cryptocurrency as a digital store of value, similar to gold. In times of economic uncertainty or inflation, investors often seek refuge in assets perceived as hedges against inflation. Bitcoin's limited supply and decentralized nature position it as a potential candidate for this role.
Technical Analysis: A Bullish Case
Technical analysts utilize price charts and mathematical indicators to predict future price movements. In the case of Bitcoin, some analysts are pointing towards a trendline established by connecting several significant price points on the chart. This trendline suggests a potential bullish trajectory for Bitcoin, with a target price of $85,000.
It's important to remember that technical analysis is not an infallible science. Past performance does not necessarily indicate future results, and unexpected market events can disrupt even the most meticulously drawn trendlines.
Challenges and Considerations
While the outlook for Bitcoin appears promising, there are still challenges to consider:
• Regulation: Regulatory uncertainty surrounding cryptocurrency continues to be a hurdle for wider adoption. Governments around the world are still grappling with how to regulate this nascent asset class. Stringent regulations could dampen investor enthusiasm.
• Volatility: Bitcoin is notorious for its price volatility. This volatility can deter risk-averse investors.
• Environmental Concerns: The energy consumption associated with Bitcoin mining has drawn criticism. If sustainable solutions aren't implemented, this could continue to be a black mark against Bitcoin.
Conclusion
Bitcoin's potential surge towards $85,000 hinges on a confluence of factors, including the upcoming U.S. economic data, continued institutional adoption, and Bitcoin's inherent properties as a scarce, digital store of value. Technical analysis also suggests a bullish trend. However, investors should be aware of the challenges posed by regulation, volatility, and environmental concerns.
