Bitcoin Supply Shock Is No Longer a Theory, But a Reality
In the intricate and often frenetic world of digital assets, the market is constantly sending signals. Some are loud, ephemeral flashes of volatility that capture headlines for a day. Others are quiet, seismic shifts that build slowly beneath the surface, unnoticed by the masses until they erupt with earth-shattering force. Today, the Bitcoin network is broadcasting one of these profound, underlying signals. It speaks of a disappearance, a vanishing act on a scale never before seen, pointing toward a supply shock so significant that it threatens to redefine the very concept of price discovery for the world’s premier cryptocurrency.
The paradox currently facing market observers is the disconnect between Bitcoin’s somewhat range-bound price, which has struggled to decisively conquer the territory above $120,000, and the tectonic movements occurring in its fundamental market structure. While the price action might suggest a market in equilibrium, a state of indecisive calm, the data tells a story of immense and growing tension. It is a story of a collision course between two unprecedented forces: a relentless, programmatic wave of institutional demand and a rapidly dwindling, fiercely guarded supply.
The central piece of evidence, the smoking gun for this impending crisis, is the state of Bitcoin reserves on cryptocurrency exchanges. These platforms, the bustling marketplaces where buyers and sellers meet, have seen their Bitcoin inventories plummet to a seven-year low. Less than 15% of the total circulating Bitcoin supply now resides on these exchanges, a figure that is as statistically stark as it is historically significant. This isn’t merely a data point; it is a profound statement of intent from the global cohort of Bitcoin holders. It signifies a monumental shift from short-term speculation to long-term conviction, a collective decision to withdraw assets from the realm of immediate liquidity and into the deep, fortified vaults of cold storage. This great disappearance is the quiet prelude to a very loud event, and to understand its implications, one must dissect the powerful forces of both supply and demand that are pulling the market to its breaking point.
The Vanishing Act: Where Has All the Bitcoin Gone?
To grasp the gravity of the dwindling exchange reserves, one must first understand the role of an exchange in the life cycle of a Bitcoin. An exchange is a trading floor. Assets held there are, by their very nature, liquid and available for sale. A holder who moves their Bitcoin onto an exchange is signaling an intent to trade or sell, either immediately or in the near future. Conversely, moving Bitcoin off an exchange and into a personal, self-custodied wallet—often called cold storage—is a deliberate act of preservation. It is a declaration that the owner has no immediate intention of selling. They are choosing to become a long-term holder, a saver, effectively removing their coins from the active, tradeable supply.
For years, the flow of Bitcoin onto and off of exchanges has served as a reliable barometer of market sentiment. During the euphoric peaks of past bull markets, a predictable pattern emerged: as prices soared, a flood of Bitcoin would move onto exchanges as long-term holders finally decided to take profits. This influx of supply would help to satisfy the frenzied buying demand, eventually capping the rally and leading to a market correction.
This cycle, however, is fundamentally different. The opposite is happening. Despite prices reaching new all-time highs, the flow has been overwhelmingly outward. Coins are leaving exchanges at a historic pace, creating a supply-side vacuum. This exodus is not a new phenomenon, but the acceleration over the past 18 months has been breathtaking. It reflects a maturing market and a hardened investor base that has learned the lessons of previous cycles. They have witnessed Bitcoin’s resilience, its ability to weather brutal bear markets and emerge stronger each time. They are no longer content with selling for a 5x or 10x profit, only to watch the asset climb another tenfold in the subsequent years. They have transitioned from treating Bitcoin as a speculative trade to embracing it as a long-term savings technology, a digital store of value in an increasingly uncertain macroeconomic world. The coins are not lost; they have simply gone home, locked away by owners who have no interest in selling at today’s prices.
The Wall Street Leviathan: A New and Insatiable Source of Demand
While the available supply of Bitcoin has been quietly disappearing into private wallets, a new and powerful predator has entered the ecosystem, armed with an insatiable appetite. The launch of spot Bitcoin Exchange-Traded Funds (ETFs) in the United States marked the single most significant structural change in the history of the Bitcoin market. These regulated financial products, offered by the largest asset managers in the world, have constructed a permanent, one-way bridge connecting the traditional financial system to the digital asset space.
This bridge is not for casual tourism; it is a superhighway for capital. The ETFs, led by BlackRock’s behemoth iShares Bitcoin Trust (IBIT), have unleashed a torrent of institutional and retail money that is systematically draining the remaining available supply. The mechanics of these ETFs are crucial to understand. Unlike futures-based products, a spot ETF must acquire and hold the underlying asset—in this case, real Bitcoin—to back the shares it issues to investors. This means that for every dollar that flows into an ETF like IBIT, its managers must go into the open market and buy a corresponding amount of Bitcoin.
The scale of this operation is staggering. In a stunning testament to the demand for this new product, BlackRock’s Bitcoin ETF has, in its short 18-month existence, begun to generate more revenue from annual fees than its long-established and immensely popular S&P 500 fund. This is not a niche product for crypto enthusiasts; it is a mainstream financial blockbuster, attracting billions from investors seeking a simple, regulated way to gain exposure to Bitcoin.
This creates a relentless, programmatic buying pressure that the market has never before had to absorb. Every single trading day, the ETFs collectively purchase a significant amount of Bitcoin. This demand is constant and largely price-agnostic. It is driven by asset allocation decisions, not short-term market timing. This programmatic buying acts like a giant hydraulic pump, sucking up any loose supply available on exchanges. The daily demand from these Wall Street giants often outstrips the new supply of Bitcoin created by miners, creating a structural deficit that can only be filled by one source: the existing coins held by others. And as we’ve seen, those holders are increasingly unwilling to part with their assets.
The Diamond-Handed Super-Majority: A Trillion-Dollar Standoff
The collision between the insatiable demand of the ETFs and the shrinking available supply raises a critical question: why aren't the existing holders selling? With so much new money flooding into the market, basic economics would suggest that the rising price should entice current owners to sell and realize their gains. Yet, the data reveals a fascinating psychological standoff.
According to research from the on-chain analytics firm Glassnode, a "super-majority" of Bitcoin holders are currently sitting on a colossal $1.2 trillion in unrealized profits. This means that a vast portion of the network acquired their coins at prices far below the current level and are deep in the green. In any other market, such a massive overhang of profit would be seen as a significant risk, a powder keg of potential sell pressure waiting to be ignited.
But in the world of Bitcoin, it has become a fortress of conviction. Glassnode’s analysis concludes that the current price, even in the six-figure range, "is not compelling enough for investors to continue selling." This is a revolutionary insight into the mindset of the modern Bitcoin investor. Their price targets have shifted dramatically. They are not looking to sell at $120,000 or even $140,000. For many, these levels are seen as mere stepping stones on the path to a much higher valuation, one that properly reflects Bitcoin’s role as a global, non-sovereign store of value.
Further research into profit-taking behavior confirms this trend. The amount of realized profit—that is, coins being sold at a gain—in the current cycle has yet to match the levels seen during the peak of the 2024 rally. This suggests that the holders who were willing to sell at those prices have already done so. The remaining cohort is composed of the most steadfast believers, the "diamond hands," who are holding out for a much more significant repricing. Some analyses suggest that the Bitcoin price would notionally need to rise another 30%, toward the $140,000 mark, just to reach a point where this cohort even begins to feel tempted to part with their holdings in a meaningful way. This creates a powerful reflexive loop: the less they sell, the less supply is available, and the more explosive the potential price move when demand continues to pour in.
The Macroeconomic Perfect Storm
The conviction of Bitcoin holders and the flood of institutional capital are not occurring in a vacuum. They are a direct response to a global macroeconomic environment that is creating a perfect storm for a hard, scarce asset. The primary driver of this is the unprecedented expansion of the global money supply. The M2 money supply—a broad measure of currency that includes cash, checking and savings deposits, and money market funds—has reached a record high.
Governments and central banks around the world have engaged in years of quantitative easing and fiscal stimulus, effectively printing trillions of dollars to prop up their economies. While often necessary in the short term, this relentless monetary expansion has a corrosive long-term effect: it debases the value of fiat currencies. As the supply of dollars, euros, and yen increases, the purchasing power of each individual unit decreases.
In this environment, rational economic actors begin to search for a safe harbor, a place to protect their wealth from the slow-motion erosion of inflation. Historically, this role was filled by assets like gold. Today, a growing number of individuals, corporations, and even nation-states are turning to Bitcoin. Its mathematically enforced scarcity—a hard cap of 21 million coins that can never be altered—stands in stark contrast to the infinite printability of government-issued money.
This narrative has been supercharged by the recent performance of the US dollar itself. The world’s reserve currency experienced a dramatic 10.8% drop in its worst first-half performance since 1973, signaling a potential shift in global currency dynamics. As the dollar weakens, assets priced in dollars become cheaper for foreign investors, and the appeal of a non-sovereign alternative like Bitcoin grows. This macroeconomic backdrop provides the fundamental "why" behind the Bitcoin trade. It is no longer just a technological curiosity or a speculative bet; it is increasingly viewed as an essential component of a diversified portfolio, a hedge against the very real risks of monetary debasement and geopolitical instability. It is this understanding that underpins bullish price targets that sit around $170,000 and beyond.
Navigating the Uncomfortable Calm
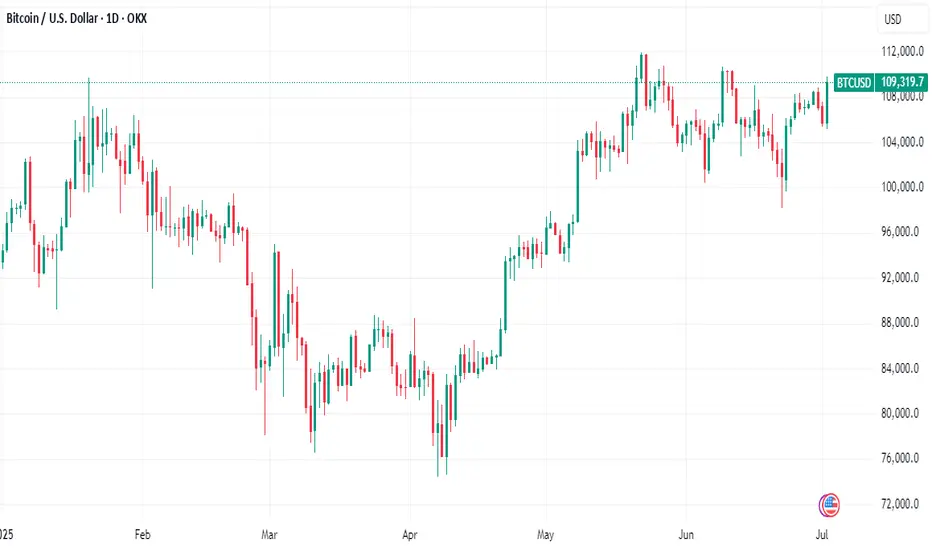
With such a powerfully bullish confluence of factors, the question remains: why has Bitcoin been seemingly stuck in a consolidation pattern, unable to break out and sustain a move into the higher price ranges? Why did the market see a wobble that brought the price down to $105,000, causing anxiety among newer entrants?
The answer lies in the nature of market equilibrium. Even in the most ferocious bull market, there are always sellers. Miners, who must sell some of their newly minted Bitcoin to cover their operational costs, represent a constant source of supply. Early investors may take some profits to diversify their wealth. Short-term traders will try to play the ranges, and even some of the capital in the ETFs will inevitably be redeemed, forcing the funds to sell a corresponding amount of Bitcoin.
The current price range below $120,000 represents the battleground where the relentless, programmatic buying from the ETF leviathan is meeting and absorbing this natural, daily sell pressure. The market is in a state of accumulation and consolidation, building a strong base of support before its next major move. The fact that crypto market sentiment has held steady, even during price dips and the start of the third quarter—a period historically known for its weak seasonality—is a testament to the market's newfound maturity. The "weak hands," or investors with low conviction, have likely been shaken out, leaving a stronger, more resilient base of holders.
This period of sideways price action is likely to be deceptive. The historical seasonality of Bitcoin suggests that summer can often be a period of lackluster performance, lulling market participants into a state of complacency. The idea that Summer 2025 will "catch everyone off guard" stems from this dynamic. While the price chart may look boring, the underlying supply and demand forces are becoming ever more tightly coiled. The pressure is building, and the longer the market consolidates, the more violent the eventual breakout is likely to be.
The Inevitable Collision
The story of Bitcoin in 2025 is the story of an inevitable collision. On one side, you have the most powerful force of demand the asset has ever known: a fleet of Wall Street ETFs, led by the world's largest asset manager, programmatically buying Bitcoin every single day. This demand is structural, relentless, and here to stay.
On the other side, you have the most convicted group of holders in Bitcoin’s history. They are a super-majority, sitting on over a trillion dollars in profit, who have explicitly signaled through their actions and on-chain data that they have no intention of selling at these prices. They are withdrawing their coins from the market at a historic rate, creating a supply desert.
The dwindling reserve of Bitcoin on exchanges is the ticking clock in this grand drama. It is the visible measure of the supply shock in progress. Each day, the ETFs arrive in the market to fill their orders, only to find the shelves are increasingly bare. The deficit they create must be filled by prying coins from the diamond hands of long-term holders. But those holders have made their price clear, and it is not $120,000.
Therefore, the current market is not in a state of calm, but in a state of profound tension. It is the quiet moment before the lightning strike. The forces of an institutional-grade demand shock and a historic holder-induced supply squeeze are on a direct and unavoidable collision course. The question is no longer if this tension will resolve, but when and with what magnitude. The great disappearance of Bitcoin from the open market is the final signal that the supply problem is no longer a distant forecast. It is here, and it is about to change everything.
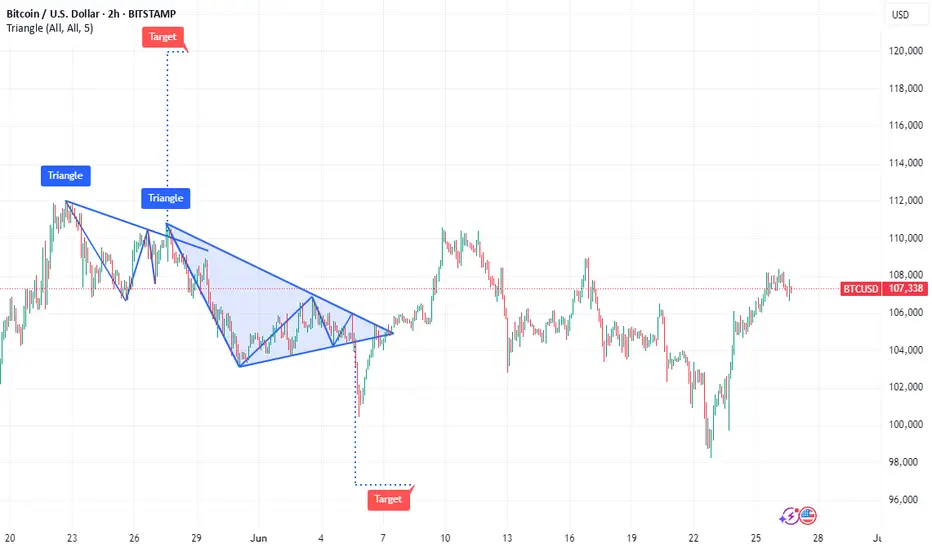
Bitcoinlong
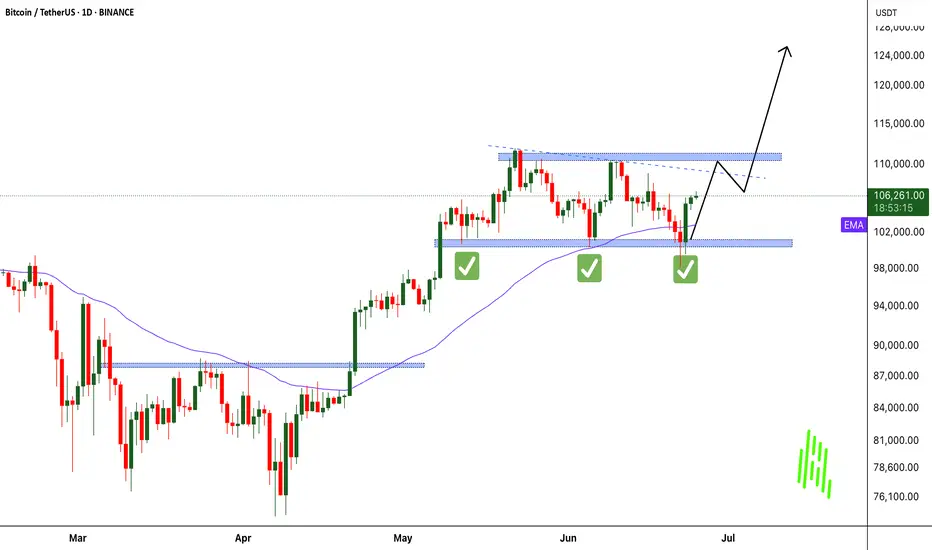
Bitcoin Set to Break All-Time High: Market Consensus Is BullishAs we enter the second half of 2025, Bitcoin (BTC) is on the verge of breaking its all-time high (ATH), with analysts, institutional investors, and market data all pointing toward an imminent surge. The convergence of technical strength, robust institutional inflows, and favorable macro trends is fueling widespread optimism that BTC will soon surpass its previous records.
Key Drivers Behind Bitcoin’s Imminent ATH Breakout
Institutional Investment & ETF Approvals:
The surge in institutional interest, highlighted by record inflows into Bitcoin ETFs and major asset managers ramping up exposure, is a pivotal force behind BTC’s upward momentum. Recent ETF approvals and growing allocations by corporate treasuries are reshaping the liquidity landscape and boosting confidence in Bitcoin as a mainstream asset.
Technical Indicators & Market Structure:
Bitcoin’s price action is consolidating near critical resistance levels ($107,000–$109,000), with technical analysts identifying bullish formations such as the inverted head-and-shoulders pattern. A decisive move above $109,000 is expected to trigger a rapid ascent to new highs, with targets ranging from $112,000 in the short term to as high as $135,000–$200,000 by year-end, according to leading forecasters.
Historical Cycles & Macro Trends:
Unlike previous halving cycles, where corrections followed price spikes, this cycle is marked by sustained demand from ETFs and corporate buyers. Standard Chartered and other major institutions now project BTC to reach $135,000 in Q3 and potentially $200,000 by late 2025, citing a fundamental shift in market dynamics
BUT...A drop to 90k is considered possible before the rally.
#crypto #bitcoin #portfolio #analysis

Crypto Stocks to the moon?NASDAQ:MSTR , along with numerous other publicly traded companies with significant cryptocurrency exposure, experienced a remarkable rally during the previous crypto bull market. There are indications that a similar dynamic could be emerging once again.
#bitcoin #crypto #stocks #stockmarket #portfolio

LEVERUSDT Forming Falling WedgeLEVERUSDT is showing a highly promising setup that’s generating buzz among traders and investors alike. The crypto pair is forming a classic Falling Wedge Pattern, which is widely recognized as a bullish reversal signal in technical analysis. This pattern often indicates that selling pressure is weakening and a breakout to the upside could be imminent. With volume picking up steadily, there is growing optimism that LEVERUSDT could deliver a significant price surge once it confirms a clean breakout above the wedge’s resistance line.
Many traders are particularly excited about LEVERUSDT because the expected gain for this setup is an impressive 160% to 170%+. This projection, combined with the clear technical pattern and rising investor interest, suggests that LEVERUSDT may soon become one of the standout performers in the altcoin market. The recent accumulation phase, reflected in steady volume inflows, hints that savvy traders are positioning themselves early ahead of a larger move.
Another important factor supporting this bullish outlook is the broader sentiment in the crypto market. As traders look for undervalued opportunities with high breakout potential, coins like LEVERUSDT that show strong bullish patterns and healthy trading activity become attractive bets. If the breakout confirms on the daily or 4H timeframe with sustained volume, it could trigger momentum-driven buying and push prices towards the projected targets.
For traders looking to diversify their crypto portfolio with high-potential setups, keeping a close watch on LEVERUSDT is definitely worthwhile. Remember to wait for a clear breakout confirmation before entering and manage your risk accordingly to make the most of this potential reversal.
✅ Show your support by hitting the like button and
✅ Leaving a comment below! (What is You opinion about this Coin)
Your feedback and engagement keep me inspired to share more insightful market analysis with you!

PYTHUSDT Forming Falling WedgePYTHUSDT is setting up for what could be a powerful bullish move, as it has recently formed a classic falling wedge pattern on the chart. This is widely recognized among crypto traders as a strong reversal pattern, often appearing near the end of a downtrend when selling pressure starts to lose momentum. As price action tightens within this wedge, it creates an ideal scenario for a breakout to the upside, especially with good volume providing solid confirmation of buyer interest.
The current volume levels on PYTHUSDT look promising and indicate growing accumulation among investors. When a falling wedge is accompanied by increasing volume near its breakout point, it significantly strengthens the likelihood of a sustained upward trend. Many traders will be looking for a decisive close above the wedge’s resistance line, which could open the door for a rally aiming for gains in the 90% to 100%+ range. This makes PYTHUSDT an attractive option for swing traders and mid-term holders seeking high-potential setups in the crypto market.
What adds to the bullish thesis is the rising interest from investors who are keeping a close eye on PYTHUSDT. As broader market sentiment begins to lean bullish, projects like PYTH that combine a reliable technical structure with growing investor confidence often become top picks. This creates the potential for not just technical buying but also FOMO-driven momentum, which can accelerate price targets once the breakout gains traction.
With all these factors aligning — a well-formed falling wedge pattern, supportive volume, and increased investor attention — PYTHUSDT could be one of the standout altcoins in the coming weeks. Keep watch for confirmation of the breakout and manage your risk wisely to capture the best possible move this pattern has to offer.
✅ Show your support by hitting the like button and
✅ Leaving a comment below! (What is You opinion about this Coin)
Your feedback and engagement keep me inspired to share more insightful market analysis with you!

Whales Dump on Wall Street, Fueling Bitcoin's 'Inevitable' SurgeIn the high-stakes world of cryptocurrency, where fortunes are made and lost in the blink of an eye, a new narrative is taking shape. With Bitcoin's price hypothetically hovering around a robust $107,000, a significant portion of market analysis now suggests that a new all-time high is not just a possibility, but an inevitability. This confidence stems from a complex interplay of technical strength, unprecedented institutional demand, and a massive, yet healthy, transfer of wealth from early adopters to the new titans of finance.
The market is currently witnessing a fascinating dynamic: while the price consolidates above the monumental $100,000 psychological barrier, long-term holders, often referred to as "OG whales," are systematically selling their holdings. This activity, which could be misconstrued as bearish, is being interpreted by many as a necessary and constructive phase. Instead of suppressing the price, this distribution is meeting a voracious appetite from Wall Street, primarily through the mechanism of spot Bitcoin Exchange-Traded Funds (ETFs). This creates a state of equilibrium, a period of sideways consolidation where the market digests enormous gains and builds a foundation for its next explosive move. The target on the horizon is a liquidity cluster around $109,000, a key level that, if decisively flipped to support, could unlock a path to uncharted territory.
This article will delve into the multifaceted dynamics of this hypothetical market scenario. It will explore the significance of consolidating above $100,000, dissect the "great transfer" of Bitcoin from early believers to institutional giants, and analyze the technical and on-chain metrics pointing toward an imminent breakout. Finally, it will consider the potential risks and counterarguments that could challenge the prevailing bullish thesis, providing a comprehensive overview of a market at a pivotal crossroads.
Part 1: The New Paradigm - Consolidating Above $100,000
The act of breaking and holding a price level as significant as $100,000 represents more than just a numerical achievement; it is a profound psychological and structural shift for Bitcoin. In this hypothetical scenario, the market is not just visiting this level but is actively building a base above it, a process known as consolidation. This phase is crucial, characterized by sideways price movement within a defined range, often accompanied by decreasing trading volume, as the market takes a collective breath and establishes a new sense of fair value.
The Psychology of a Six-Figure Asset
For years, $100,000 was a distant, almost mythical target for Bitcoin. Surpassing and, more importantly, sustaining this level transforms market perception. It solidifies Bitcoin's status as a mature, global macro asset, moving it further away from its speculative past. This psychological victory attracts a new wave of capital from more conservative investors, wealth funds, and corporations who may have been hesitant to enter before such a milestone was reached. The consolidation phase above this level acts as a proof of stability, demonstrating that the asset can absorb significant profit-taking without collapsing, thereby building trust and confidence for the next wave of adoption.
Market Structure and Institutional Support
This period of stability is not happening in a vacuum. It is underpinned by a fundamental change in market structure, primarily the advent and overwhelming success of spot Bitcoin ETFs. These regulated financial products have provided a seamless bridge for Wall Street to pour billions of dollars into Bitcoin, creating a formidable wall of buy-side demand. In this scenario, where Bitcoin oscillates between $102,000 and $110,000, spot ETFs would be consistently recording massive net inflows, absorbing the supply being offered by sellers.
This dynamic is a textbook example of healthy consolidation. It is a tug-of-war where the immense selling pressure from profit-takers is effectively matched by the persistent buying pressure from new institutional entrants. This prevents a sharp price decline and allows the market to methodically transfer coins from one cohort to another without inducing panic. Technically, this phase often forms recognizable patterns like sideways ranges, bullish flags, or ascending triangles, all of which suggest that pressure is building for an eventual breakout to the upside. The decreasing volume during this time indicates that the market is reaching an equilibrium before the next major directional move.
Historical Precedent in a New Era
Bitcoin has experienced consolidation phases after breaking previous major milestones, such as $1,000 and $20,000. However, the current hypothetical consolidation above $100,000 is fundamentally different in both scale and participants. Previous cycles were largely driven by retail investors and a smaller group of early adopters. The current cycle is defined by the heavyweight presence of institutional players who bring not only massive capital but also a long-term strategic investment horizon.
The amount of capital required to absorb selling pressure at a six-figure price point is orders of magnitude greater than in any previous cycle. The fact that the market can achieve this stability highlights the depth and maturity it has developed. While past consolidations were precursors to further retail-driven mania, the current phase is about the systematic absorption of early investor supply by the largest financial institutions in the world, setting the stage for a rally built on a much stronger and more diverse foundation. This isn't just a pause; it's the construction of a launchpad for the next chapter in Bitcoin's story.
Part 2: The "Great Transfer" - Long-Term Holders vs. Wall Street
At the heart of the market's current dynamic is a historic transfer of wealth. This is the moment where the earliest and most steadfast believers in Bitcoin, the "OG Whales" or Long-Term Holders (LTHs), are realizing their life-changing gains by selling to the new behemoths of the financial world: Wall Street institutions. This process is not the bearish signal it might imply, but rather a critical market function that fuels the bull run's continuation.
Defining the Players: "OG Whales" and Long-Term Holders
Long-Term Holders (LTHs) are typically defined in on-chain analysis as addresses that have held their Bitcoin for more than 155 days (approximately five months). These are investors who have weathered significant volatility and have a deep conviction in the asset. "OG Whales" are a subset of this group, representing individuals or entities who accumulated vast amounts of Bitcoin in its nascent stages, often at prices of three figures or less. For them, selling at over $100,000 represents astronomical returns on their initial investment.
Their motivation to sell is rational and expected. It is a common market pattern for patient bottom buyers to take profits as the market approaches and surpasses new all-time highs. They understand that the euphoria surrounding these record prices is what attracts the necessary buy-side demand to absorb their large sell orders. This selling, or "distribution," is a hallmark of every Bitcoin bull market peak. The key question is whether the demand is strong enough to absorb this supply without crashing the price.
Deconstructing the "Dumping on Wall Street" Narrative
The essence of this transfer is that since the launch of spot Bitcoin ETFs, LTHs have been the primary source of selling pressure. They are, in effect, providing the liquidity that the newly launched ETFs require to meet the relentless demand from their clients.
This dynamic is precisely why the price has been able to stabilize at such high levels. The institutional buying frenzy is absorbing the supply unloaded by LTHs. This is not a malicious act of suppression but a symbiotic relationship: LTHs need massive buyers to sell to, and Wall Street needs massive sellers to source coins from. This is simply the natural ebb and flow of a market cycle where supply and demand are meeting at a new, higher equilibrium.
On-Chain Evidence of a Healthy Distribution
Several on-chain metrics provide a clear window into this phenomenon, confirming that the current selling is a sign of a healthy bull market, not an impending top.
• Spent Output Profit Ratio (SOPR): This metric shows the degree of realized profit for all coins moved on-chain. In this scenario, the LTH-SOPR would be extremely high, indicating that the coins being sold were acquired at a much lower cost basis and are now being sold for massive profits. While this signals profit-taking, it is typical of a bull market and, on its own, does not signal a top.
• Realized Profit: On-chain data would show a massive spike in realized profits, confirming that sellers are locking in gains. The market's ability to absorb these profits and continue consolidating is a sign of immense strength.
• Coin Days Destroyed (CDD) / Value Days Destroyed (VDD): These metrics measure the activity of older coins. A spike in VDD is synonymous with the LTH cohort spending their coins. This typically peaks shortly after breaking all-time highs because sellers need the liquidity that new buyers bring. The fact that this selling is being met with such strong institutional demand prevents it from turning into a bear market trigger.
• Long-Term Holder Supply: While some LTHs are selling, the overall supply held by this cohort may still be growing or stabilizing. This is because investors who bought six months prior are continuously "aging" into LTH status. This indicates that while the oldest hands are selling, a new generation of convicted holders is forming, providing a solid foundation for the market.
In essence, the "great transfer" is a feature, not a bug, of the current bull market. It is a sign of Bitcoin's maturation, where the asset is moving from the strong hands of early pioneers to the deep pockets of the global financial system. This process allows the market to de-risk, shed its over-leveraged players, and build a stronger base for what many believe is the inevitable next leg up.
Part 3: The Path to $109K and Beyond - Technical and Liquidity Analysis
With the market having established a strong foundation above $100,000, all eyes turn to the next key resistance levels. Technical and on-chain analysis points to a significant cluster of liquidity around the $109,000 mark, which is viewed as the final hurdle before Bitcoin can enter a new phase of price discovery. The argument for the "inevitability" of a new all-time high rests on a confluence of bullish technical patterns, resetting momentum indicators, and the overwhelming force of market liquidity.
Understanding Liquidity at $109,000
In financial markets, liquidity refers to the ease with which an asset can be bought or sold without causing a significant price change. On a price chart, liquidity is concentrated at levels with a high density of buy and sell orders. The area around $109,000 to $111,000 represents a major liquidity cluster. This is composed of:
• Sell Orders (Asks): A large number of investors who bought at lower prices have placed take-profit orders at this psychological and technical level.
• Short Position Liquidations: Traders who are betting against Bitcoin have placed their stop-losses above this resistance. If the price breaks through, these short positions are automatically closed with a buy order, creating a "short squeeze" that adds explosive fuel to the rally.
Analysis of order book data shows significant liquidation levels stacked just above this zone. Successfully breaking through and absorbing this sell-side liquidity would remove a significant barrier, clearing the path for a rapid move higher. A decisive flip of the $109,000 level from resistance to support is what bulls are watching for as the ultimate confirmation of upward momentum.
Bullish Technical Indicators
The consolidation phase has allowed Bitcoin's technical indicators to cool off and prepare for the next advance.
• Chart Patterns: On higher timeframes, the price action is forming classic bullish continuation patterns. There is potential for formations like an inverted head-and-shoulders pattern or a bullish engulfing candlestick, both of which have historically high success rates in predicting upward moves. A bullish engulfing pattern on the daily chart, for instance, has shown a high probability of leading to new local highs when appearing in a broader uptrend.
• Momentum Oscillators: Indicators like the Relative Strength Index (RSI) and the MACD (Moving Average Convergence Divergence) have likely reset from "overbought" conditions during the consolidation. This reset is healthy and necessary, allowing momentum to build again from a neutral base rather than an overheated one. It signals that the market has shed its speculative froth and is ready for a more sustainable trend.
• Moving Averages: Throughout the consolidation period, the price would find strong support at key moving averages, such as the 21-week exponential moving average (EMA) or the 50-day simple moving average (SMA). These levels act as dynamic support, with dip buyers consistently stepping in, reinforcing the strength of the underlying trend.
•
The "Inevitability" Thesis Synthesized
The argument that a new all-time high is "inevitable" is built on the convergence of these powerful forces:
1. Unprecedented Demand: The constant, price-agnostic inflows from spot Bitcoin ETFs provide a demand floor that the market has never experienced before.
2. Supply Absorption: The selling pressure from long-term holders, which would have crushed the market in previous cycles, is being successfully absorbed by this new institutional demand.
3. Healthy Reset: The market has undergone a healthy consolidation, allowing technicals to cool off, leverage to be flushed out, and a strong support base to be built.
4. Psychological Breakthrough: The conquest of the $100,000 level has fundamentally altered market perception and opened the door to price discovery, with the next logical target being the liquidity pool at $109,000.
While no outcome in financial markets is ever truly guaranteed, the confluence of persistent institutional buying, constructive on-chain dynamics, and bullish technical setups creates a powerful case that Bitcoin is coiling for a significant breakout. The move through $109,000 is seen not as a question of "if," but "when."
Part 4: Risks and Counterarguments
Despite the overwhelmingly bullish sentiment in this hypothetical scenario, a prudent analysis requires examining the potential risks and counterarguments that could challenge or delay the ascent to new all-time highs. The cryptocurrency market remains susceptible to a variety of internal and external shocks, and overconfidence can be a precursor to sharp corrections.
Macroeconomic Headwinds
Bitcoin's increasing integration into the global financial system means it is more sensitive to macroeconomic conditions than ever before. A sudden and severe global recession, an unexpected spike in inflation leading to aggressive monetary tightening by central banks, or major geopolitical conflicts could trigger a "risk-off" event across all asset classes, including Bitcoin. Investors might flee to the perceived safety of cash or government bonds, causing even the strong institutional demand for Bitcoin to waver. It is often noted that traders wait for clarity on key macroeconomic data and policy updates before committing to a trend, and any negative surprises could trigger a sell-off.
Overwhelming Profit-Taking
The thesis of a new all-time high hinges on the ability of institutional demand to absorb the selling from long-term holders. However, there is a risk that this supply could become too overwhelming. The profits held by early investors are immense, and there may be a price point—perhaps on the approach to $110,000 or just beyond—where profit-taking accelerates to a pace that even the ETFs cannot sustain. If a large cohort of whales decides to sell in unison, it could create a supply shock that temporarily breaks the market structure and forces a deeper correction.
Market Exhaustion and Valuation Metrics
While consolidation is healthy, a prolonged sideways period can sometimes signal exhaustion rather than accumulation. On-chain metrics that compare Bitcoin's market value to its realized value are crucial for gauging how overheated the market is. These tools help identify periods of extreme overvaluation. If such metrics were to enter their highest zones, it would suggest that the market is reaching peak froth, making it vulnerable to a sharp reversal, regardless of the positive narrative. It is understood that while Bitcoin's price has a strong correlation to global liquidity, internal market dynamics can cause it to decouple, especially during periods of extreme valuation.
Regulatory and Black Swan Risks
The risk of unforeseen "black swan" events always looms over the market. This could include a sudden and harsh regulatory crackdown in a major jurisdiction, the collapse of a major crypto exchange or institution, or the discovery of a critical flaw in the Bitcoin protocol itself. Furthermore, the concentration of Bitcoin within a few large ETF products, while providing demand, also introduces a new vector of risk. If these institutions were to face regulatory pressure or decide to offload their holdings for strategic reasons, the resulting sell pressure could be catastrophic.
In conclusion, while the path to a new all-time high appears clear and well-supported by current dynamics, it is by no means guaranteed. A combination of adverse macroeconomic shifts, overwhelming selling pressure, extreme valuations, or an unexpected black swan event could easily derail the bullish momentum. Investors and analysts must remain vigilant, balancing the optimistic on-chain and technical data with a realistic appreciation of the inherent risks in this volatile asset class.
Conclusion
The hypothetical scenario of Bitcoin consolidating above $100,000 while eyeing a breakout to $109,000 and beyond represents a pivotal moment in the asset's history. It paints a picture of a market that has achieved a new level of maturity, driven by a paradigm shift in its investor base. The central thesis—that a new all-time high is now "inevitable"—is not born from baseless hype, but from a powerful confluence of observable market forces.
The successful establishment of the six-figure price level as a support floor, rather than a speculative peak, is the first pillar of this argument. This consolidation is made possible by the voracious and sustained demand from Wall Street institutions, which are using spot Bitcoin ETFs to absorb the immense selling pressure from early adopters. This dynamic, the "great transfer" of Bitcoin from OG whales to institutional treasuries, is not a sign of a market top but a healthy and necessary distribution that de-risks the market and fuels the next leg of the bull run.
The on-chain analysis provides a framework for understanding this phase not as stagnation, but as a constructive consolidation where the market builds energy for a parabolic advance. This narrative is supported by bullish technical patterns, resetting momentum indicators, and a clear liquidity target at $109,000, which, once breached, could trigger a powerful short squeeze and propel Bitcoin into a new phase of price discovery.
However, this bullish outlook must be tempered with an awareness of the significant risks that remain. Macroeconomic instability, the sheer scale of potential profit-taking, and the ever-present threat of regulatory or black swan events could challenge the prevailing trend.
Ultimately, this analysis reveals a Bitcoin that is at a crossroads, but one where the path forward appears more clearly defined and well-supported than ever before. The interplay between the old guard of crypto and the new titans of finance is forging a stronger, more resilient market. While no outcome is certain, the evidence strongly suggests that Bitcoin is not at the end of its run, but is merely pausing to build a higher launchpad for its journey into the financial mainstream.

ARUSDT Forming Descending ChannelARUSDT is showing a promising setup as it begins to break out of a clear descending channel pattern on the daily timeframe. The current chart indicates strong potential for a bullish reversal, with price action approaching key breakout levels supported by healthy trading volume. This technical formation suggests that buyers are starting to regain control after an extended correction, making ARUSDT one to watch closely for the next big move.
With a projected gain of around 90% to 100%+, the risk-to-reward ratio for ARUSDT looks highly favorable. This setup aligns well with broader market sentiment, where investors are rotating back into altcoins that show strong recovery potential. As ARUSDT pushes against the upper trendline of its channel, confirmation of a breakout could lead to a powerful rally that targets previous highs, giving traders a clear upside objective.
In addition to the technical pattern, the volume profile for ARUSDT remains supportive, indicating growing investor interest and participation. This surge in trading activity often precedes sustained moves, as more market participants add to positions once key resistance levels flip to support. The combination of strong volume and a bullish channel breakout is a classic setup for momentum traders.
Overall, ARUSDT stands out as a well-positioned crypto pair for traders looking to capture a mid-term trend reversal. Keeping an eye on breakout confirmation and subsequent retests will be key for maximizing profit potential. With momentum building, this pair could deliver significant returns in the coming weeks if market conditions stay supportive.
✅ Show your support by hitting the like button and
✅ Leaving a comment below! (What is You opinion about this Coin)
Your feedback and engagement keep me inspired to share more insightful market analysis with you!

LEVERUSDT Forming Strong Falling WedgeLEVERUSDT is currently showing a strong Falling Wedge Pattern, a bullish reversal formation that often precedes sharp upward movements. The recent price structure suggests consolidation is ending, and buyers are preparing for a breakout. This setup, coupled with increasing volume, indicates accumulation at the lower end of the wedge and points toward a potential gain of 140% to 150%+ if the breakout confirms and momentum sustains.
LeverFi (LEVER) has gained traction among DeFi enthusiasts due to its innovative decentralized leverage trading platform. As more investors look to decentralized finance solutions, LEVER’s real-world utility is driving both user interest and investor confidence. This rise in engagement is reflected in recent price action, where bullish divergence and buying interest are becoming more evident on the charts.
The current chart pattern suggests the pair has formed a solid base, with decreasing selling pressure and a tightening range, which often leads to explosive moves once a breakout occurs. Traders will be watching key resistance levels above the wedge for breakout confirmation, and once surpassed, LEVERUSDT could trigger a rapid bullish continuation, attracting swing and momentum traders alike.
With strong fundamentals, rising community engagement, and a technically bullish chart, LEVERUSDT stands out as a potential outperformer in the current market phase. It's an ideal time for crypto traders to keep a close watch on this breakout opportunity.
✅ Show your support by hitting the like button and
✅ Leaving a comment below! (What is You opinion about this Coin)
Your feedback and engagement keep me inspired to share more insightful market analysis with you!

DATAUSDT Forming Strong Bullish Breakout outDATAUSDT is showing strong bullish potential after breaking out from a falling wedge pattern—a classic technical indicator often followed by significant upward momentum. The breakout from this compression zone suggests that bullish pressure is returning to the market, and a rally may be in play. With the recent surge in price action, traders are eyeing an expected gain of 80% to 90%, especially as volume supports the breakout confirmation.
The Streamr project, which underpins DATA, is gaining traction for its real-time decentralized data-sharing protocol. As interest in Web3 and decentralized data ecosystems grows, investors are beginning to recognize the long-term utility of DATA. The recent pattern breakout reflects increasing investor confidence and accumulation at lower levels, setting the stage for potential explosive moves.
The technical structure is clean, with a well-defined wedge breakout, a strong impulsive move, and a retest of previous resistance as support. This setup is ideal for swing traders and mid-term investors looking for high-probability entries. If momentum sustains, price could quickly push toward the upper targets, making this one of the stronger bullish setups currently on the radar.
With market sentiment leaning towards recovery and altcoins beginning to attract capital flows, DATAUSDT is well-positioned to benefit from broader bullish trends in the crypto space. Keeping an eye on volume and continuation patterns will be key in managing this trade effectively.
✅ Show your support by hitting the like button and
✅ Leaving a comment below! (What is You opinion about this Coin)
Your feedback and engagement keep me inspired to share more insightful market analysis with you!

Bitcoin's Podium-Ready 'Bull Flag' Hints at Price Boom to $120KBitcoin's Podium-Ready 'Bull Flag' Hints at Price Boom to $120K
Bitcoin, the pioneering cryptocurrency that has redefined the financial landscape, continues to spark intense debate and fervent speculation about its future price trajectory. Amidst the sea of technical analyses and market predictions, a compelling pattern has emerged on Bitcoin's price chart: the 'bull flag.' This bullish continuation pattern, often seen as a precursor to significant upward price movements, has ignited excitement among Bitcoin proponents, fueling predictions of a potential surge to $120,000.
This article delves into the intricacies of the bull flag pattern, exploring its formation, characteristics, and implications for Bitcoin's price. We will analyze the current market conditions, considering the recent retreat from $108,000 and the overall sentiment of Bitcoin bulls. Furthermore, we will examine the factors that could either validate or invalidate the bull flag pattern, providing a nuanced perspective on the potential for Bitcoin to reach $120,000. By synthesizing these insights, we aim to offer a comprehensive overview of the technical and fundamental factors that could shape Bitcoin's price trajectory in the coming months.
Understanding the Bull Flag Pattern
The bull flag is a technical analysis pattern that signals a continuation of an existing uptrend. It is characterized by two distinct phases:
1. The Flagpole: This represents the initial strong upward movement in price. It is a sharp, almost vertical rally that establishes the overall bullish trend.
2. The Flag: This is a period of consolidation that follows the flagpole. The price moves sideways or slightly downwards, forming a rectangular or parallelogram-shaped pattern that resembles a flag. This consolidation phase allows the market to digest the initial rally and prepare for the next leg up.
The bull flag pattern is considered a bullish signal because it suggests that the initial uptrend is likely to resume after the consolidation phase. Traders often look for a breakout above the upper trendline of the flag as a confirmation signal to enter a long position.
Bitcoin's Bull Flag Formation
Bitcoin's price chart has exhibited a pattern that closely resembles a bull flag. The flagpole can be identified by the significant upward movement that occurred in the months leading up to June 2025. This rally propelled Bitcoin to a high of $108,000, establishing a strong bullish trend.
Following this rally, Bitcoin entered a period of consolidation, with the price moving sideways and slightly downwards. This consolidation phase has formed a flag-like pattern on the chart, characterized by two parallel trendlines that slope gently downwards.
The formation of this bull flag pattern has led many analysts to believe that Bitcoin is poised for another significant upward movement. The target price for this potential breakout is often calculated by measuring the length of the flagpole and adding it to the breakout point on the upper trendline of the flag. In Bitcoin's case, this calculation suggests a potential target price of around $120,000.
Factors Supporting the Bull Flag Pattern
Several factors support the validity of the bull flag pattern and the potential for Bitcoin to reach $120,000:
• Strong Underlying Bullish Trend: The bull flag is a continuation pattern, meaning that it relies on an existing uptrend to be valid. Bitcoin's price has been in a strong uptrend for several years, driven by increasing institutional adoption, growing mainstream adoption, and limited supply.
• Positive Market Sentiment: The overall sentiment among Bitcoin investors remains positive, despite the recent retreat from $108,000. Many analysts believe that Bitcoin is still in the early stages of its adoption curve and that its long-term potential remains significant.
• Increasing Institutional Adoption: Institutional investors, such as hedge funds, pension funds, and corporations, are increasingly allocating capital to Bitcoin. This increased institutional adoption can drive up the price of Bitcoin and provide a more stable foundation for its long-term growth.
• Growing Mainstream Adoption: Bitcoin is becoming increasingly accepted as a form of payment and a store of value by mainstream consumers and businesses. This growing mainstream adoption can increase demand for Bitcoin and drive up its price.
• Limited Supply: Bitcoin has a fixed supply of 21 million coins. This limited supply makes Bitcoin a scarce asset, which can increase its value over time as demand grows.
• Halving Events: Bitcoin's halving events, which occur approximately every four years, reduce the rate at which new Bitcoins are created. These halving events can reduce the supply of Bitcoin and drive up its price. The next halving event is expected to occur in 2028.
• Macroeconomic Factors: Macroeconomic factors, such as inflation, currency devaluation, and geopolitical instability, can increase demand for Bitcoin as a safe haven asset.
Factors Invalidating the Bull Flag Pattern
While the bull flag pattern is a bullish signal, it is not foolproof. Several factors could invalidate the pattern and prevent Bitcoin from reaching $120,000:
• Breakdown Below the Flag: If the price breaks down below the lower trendline of the flag, the bull flag pattern is invalidated. This would suggest that the consolidation phase is not a temporary pause before another rally, but rather a sign of weakening momentum.
• Negative News and Events: Negative news and events, such as regulatory crackdowns, security breaches, or macroeconomic shocks, could dampen investor sentiment and trigger a sell-off in Bitcoin.
• Weakening Market Fundamentals: If Bitcoin's adoption rate slows down, network activity declines, or transaction volume decreases, it could indicate that the underlying fundamentals are weakening, which could invalidate the bull flag pattern.
• Profit-Taking: After a significant rally, some investors may choose to take profits, which could put downward pressure on the price of Bitcoin and prevent it from breaking out of the flag.
• Alternative Investments: The emergence of compelling alternative investments could divert capital away from Bitcoin, reducing demand and potentially invalidating the bull flag.
Bitcoin Retreats From $108K: A Temporary Setback?
As of June 26, 2025, Bitcoin has retreated from its recent high of $108,000. This pullback has sparked concerns among some investors, but Bitcoin bulls remain optimistic about the long-term prospects of the cryptocurrency.
The recent retreat could be attributed to a number of factors, including profit-taking after a significant rally, regulatory concerns, or macroeconomic headwinds. However, it is important to note that Bitcoin has experienced numerous pullbacks throughout its history, and these pullbacks have often been followed by even stronger rallies.
The key question is whether this pullback is a temporary setback within the bull flag pattern or a sign that the pattern is about to be invalidated. If the price can hold above the lower trendline of the flag and eventually break out above the upper trendline, it would confirm the validity of the pattern and increase the likelihood of Bitcoin reaching $120,000.
Trading the Bull Flag Pattern
Traders who are looking to capitalize on the bull flag pattern can consider the following strategies:
• Entry Point: Wait for a confirmed breakout above the upper trendline of the flag before entering a long position. This helps to avoid false breakouts and increases the probability of a successful trade.
• Stop-Loss Order: Place a stop-loss order below the lower trendline of the flag to limit potential losses if the pattern is invalidated.
• Target Price: Calculate the target price by measuring the length of the flagpole and adding it to the breakout point on the upper trendline of the flag.
• Risk Management: Always use proper risk management techniques, such as limiting the amount of capital you risk on any single trade.
Conclusion
Bitcoin's price chart is currently exhibiting a bull flag pattern, which suggests that the cryptocurrency could be poised for another significant upward movement. The potential target price for this breakout is around $120,000.
However, it is important to note that the bull flag pattern is not foolproof, and several factors could invalidate it. Investors should carefully monitor the price action, market sentiment, and underlying fundamentals to assess the likelihood of Bitcoin reaching $120,000.
The recent retreat from $108,000 is a reminder that Bitcoin is a volatile asset and that pullbacks are a normal part of the market cycle. Whether this pullback is a temporary setback within the bull flag pattern or a sign that the pattern is about to be invalidated remains to be seen.
Ultimately, the future of Bitcoin's price will depend on a complex interplay of technical factors, market sentiment, and fundamental developments. By staying informed and using proper risk management techniques, investors can position themselves to potentially profit from Bitcoin's continued growth and success. As always, remember to consult with a qualified financial advisor before making any investment decisions. The bull flag offers a tantalizing glimpse of potential gains, but prudent analysis and risk mitigation are essential for navigating the volatile world of cryptocurrency.
BTCUSDT – Spring + S&R Rejection | 15min Power EntryBTCUSDT – Spring + S&R Rejection | 15min Power Entry
📅 June 26, 2025
Price swept support and printed a clean spring pattern on the 15-minute —
Rejection off key structure + volume surge confirms buyers are back in control.
✅ Demand stepped in hard
✅ Strong wick below consolidation
✅ Protected by the rising 200 EMA
✅ Entry aligns with a Fibonacci 1.618 projection target
I’m long to 109,290.56 — nothing less.
Stop is clean, invalidation obvious.
BTC just tapped the spring — I’m in.

BSWUSDT Forming Falling WedgeBSWUSDT is currently showcasing a classic falling wedge pattern, a bullish reversal signal often associated with a sharp move to the upside once the pattern resolves. This technical structure forms when price action consolidates with lower highs and lower lows, while volume typically decreases — setting the stage for a breakout. In BSWUSDT’s case, the falling wedge has matured, and bullish interest is beginning to surface with improving volume levels, suggesting that accumulation is underway.
The technical breakout from this pattern could unlock strong upside potential, and current projections indicate a possible 90% to 100% gain in the coming sessions. This aligns well with historical performance of similar wedge formations in the crypto market, where the price often surges after breaking the upper resistance trendline. Traders are closely monitoring key resistance zones for confirmation and volume spikes that can validate the trend shift.
Investor sentiment toward the (BSW) ecosystem is growing steadily due to its utility in DeFi services and low trading fees. The increase in volume also indicates that smart money could be positioning ahead of a major move. Coupled with market-wide bullishness, BSWUSDT may soon experience a strong rally, driven by both technical and fundamental catalysts.
This setup offers a high-reward opportunity for swing traders and technical analysts who are focused on breakout trades and pattern-based strategies. The falling wedge combined with rising investor engagement makes BSWUSDT a potential breakout star to watch closely.
✅ Show your support by hitting the like button and
✅ Leaving a comment below! (What is You opinion about this Coin)
Your feedback and engagement keep me inspired to share more insightful market analysis with you!

Very quick and simple BITCOIN DAILY UPDATEPA is approaching TOP OF RANGE again
It it get rejected, it is another LOWER HIGH that may lead to another LOWER LOW
If we break through, we may watch a higher high but we need to see if we get a Higher Low afterwards to confirm change of Trend
The Falling channel has a number of boundaries.
PA has the ability to move higher.
This appears to be a Bullish move for now.
So we need to wait till month end.
Again, I am hoping for a small RED candle for the month
A small Green candle could lead to many options that would be Fragile and unfounded

1 Year of Bitcoin Bull Run Remaining? In the chart above, we’re analyzing Bitcoin’s historical cycles to see if the current cycle follows a similar pattern.
Bear Run (1 Year): In each of the last three cycles, Bitcoin experienced a bear market lasting exactly 1 year from the all-time high (ATH). This phase saw a significant drop in price as the market corrected.
Bull Run from Bottom (1,064 Days): In the last two cycles, once the bottom was established, Bitcoin entered a consistent bull market that lasted approximately 1,064 days. During this period, the price gradually climbed, eventually reaching new highs.
Current Bitcoin Cycle:
So far, the current cycle appears to be following the same pattern as previous cycles. We’ve already experienced a 1-year bear market after reaching the previous all-time high (ATH).
Currently, we have completed 2 years of a bull run from the bottom, aligning with the 1,064-day bull run observed in past cycles. Based on this historical pattern, we may have 1 year of bull run remaining, which could potentially push Bitcoin to new highs by late 2025.
If this trend continues, it suggests a strong opportunity for growth over the next year, mirroring the end phase of past cycles.
BINANCE:BTCUSDT BITSTAMP:BTCUSD CRYPTOCAP:BTC
Regards
Hexa

FORMUSDT Forming Bullish WaveFORMUSDT is currently shaping a bullish wave pattern, signaling a potential upward continuation in price. This technical structure is typically characterized by impulsive moves followed by brief consolidations, suggesting growing investor confidence. The pair has recently shown strength with higher lows and steady volume increases, confirming that accumulation may be underway. Traders watching this pattern should note the supportive technical foundation forming at current price levels.
The projected gain for FORMUSDT ranges from 40% to 50%, supported by positive volume dynamics and increased market interest. The breakout potential from this bullish wave setup is significant, especially as the market begins to rotate capital back into promising low-cap altcoins. With momentum indicators trending upward and no immediate resistance overhead, this setup offers a strong opportunity for medium-term growth.
Investor sentiment around FORM is improving as the project gains visibility within the DeFi and Web3 sectors. The team behind FORM has been steadily building infrastructure that supports yield generation, DAO participation, and cross-chain functionality—all of which align with broader crypto market trends. These factors are drawing attention from both retail and strategic investors looking for next-wave DeFi plays.
As FORMUSDT builds this bullish structure, market participants should keep a close eye on price action and volume for continuation signals. A clean breakout backed by rising volume could validate the projected gains and initiate the next leg higher in this bullish cycle.
✅ Show your support by hitting the like button and
✅ Leaving a comment below! (What is You opinion about this Coin)
Your feedback and engagement keep me inspired to share more insightful market analysis with you!

A Disciplined Approach to BTC/USDT - Wait for the Right Set Up!Right now, I’m closely monitoring BTC/USDT — and what immediately jumps out is how aggressively this rally has pushed upward 🚀. We’ve seen price climb into a key external range high, taking out liquidity that was likely sitting just above those prior highs 💧.
This kind of move is often where institutional players step in to offload positions, as the liquidity makes it easier to find counterparts for previous accumulation phases 🏦. The way this price action is unfolding, I wouldn't be surprised to see a correction or retracement soon.
With the market this stretched, I’m not looking to get long here — especially not while BTC is trading at such a clear premium 🎯. No edge in chasing the highs.
Instead, I’ll be sitting back, waiting for a healthy pullback and a confirmed bullish structure shift before considering any entries 🔄📊. There’s no need to force trades in these conditions. Patience protects capital 🛡️.
⚠️ As always, this is not financial advice — just my current market perspective.

Bitcoin Reclaims Momentum: War Fears Fading, Bulls Eye $125K! MARKETSCOM:BITCOIN just delivered a powerful bounce right off the critical $100K level. A key psychological and technical support zone tested multiple times in recent sessions. This time, the bounce came with strong volume confirmation, signaling renewed buyer interest. As geopolitical tensions in the Middle East begin to ease, market confidence is returning, fueling bullish sentiment across the board.
CRYPTOCAP:BTC now looks poised to retest the $110K resistance zone, where some short-term rejection could occur. However, a decisive breakout above $110K opens the gates for a potential rally toward the next major target at $125K. Stay sharp, always manage your risk, and don’t forget to set a proper stop loss. The trend is strong, and momentum is building!
Follow Our Tradingview Account for More Technical Analysis Updates, | Like, Share and Comment Your thoughts
Bitcoin are heading to 114k or 92k A quick little analysis on BTC, we can either push up higher to 114k levels breaking new highs is a must for price action to validate bill swing. However if we break a couple lows be prepared for 92k run down
Kris/ Mindbloome Exchange
Trade Smarter Live Better

Bitcoin Targets $105K as Portfolio Share Soars But...
The year 2025 is proving to be a watershed moment for Bitcoin. The world's premier cryptocurrency has solidified its position as the bedrock of digital asset portfolios, now accounting for nearly one-third of all holdings, a testament to its growing acceptance as a legitimate macro-asset. Yet, this rising dominance belies a fractured and complex market landscape. While institutional giants and sovereign wealth funds systematically increase their Bitcoin allocations, a counter-current is flowing through the retail sector, where investors are rotating into high-potential altcoins, spurred on by the promise of new investment vehicles. This bifurcation is unfolding against a backdrop of dramatic price swings, conflicting technical forecasts, and a potent mix of macroeconomic and geopolitical catalysts, painting a picture of a market at a pivotal crossroads.
The headline statistic is striking: as of mid-2025, Bitcoin's share in investor crypto portfolios has climbed to nearly 31%, a significant increase from the previous year. This growth has persisted through months of volatility, including harrowing dips below the psychological $100,000 mark and powerful rallies reclaiming levels above $105,000. The market is being pulled in opposing directions. On one hand, bullish tailwinds are gathering force. A ceasefire in the Middle East has calmed geopolitical jitters, restoring appetite for risk assets. Simultaneously, hints from the U.S. Federal Reserve of a potential July interest rate cut have investors anticipating a surge of liquidity into the market.
However, a sense of unease permeates the technical charts. Some analysts warn of a "final crash" still to come, drawing parallels to the market structure of 2021. On-chain analysis has identified the $97,000 to $98,000 range as a critical market pivot, a line in the sand that could determine the next major trend. Meanwhile, other models, like the Elliott Wave count, predict a corrective crash to as low as $94,000 before any new highs can be sustainably achieved.
This is the story of Bitcoin in 2025: a maturing asset cementing its institutional role while navigating the turbulent waters of retail speculation, macroeconomic shifts, and its own volatile price cycles. The journey toward becoming a third of all crypto holdings has not been a straight line, but a dramatic tug-of-war that will define the future of the digital asset class.
Part 1: The 31% Benchmark - Bitcoin's Ascendant Portfolio Dominance
The steady climb of Bitcoin to nearly 31% of investor portfolios is the defining trend of 2025. This figure, a cornerstone of market analysis this year, underscores a profound shift in investor conviction. Through a period marked by six-figure price tags and gut-wrenching volatility, the average investor has not been scared away but has instead deepened their commitment to the original cryptocurrency. This suggests a maturing "buy the dip" mentality, where price corrections are increasingly viewed not as a crisis, but as an opportunity to accumulate a long-term store of value.
The primary engine behind this trend is unmistakable: institutional adoption. The floodgates, first opened by the launch of spot Bitcoin ETFs, have become a torrent of institutional capital in 2025. Sovereign wealth funds, major financial institutions, and public companies are now systematically accumulating Bitcoin, treating it as a core component of their treasury and investment strategies. Observations of institutional trading desks indicate this buying pressure from large-scale investors intensified in the first half of the year, even as retail activity showed signs of slowing. This institutional stamp of approval is reflected in the growing number of Bitcoins held in various corporate treasuries and exchange-traded funds.
This institutional embrace of Bitcoin has been fueled by several factors. First, an increasingly innovation-friendly regulatory environment in the United States has provided the clarity that large, compliance-focused firms require. Second, Bitcoin’s performance has been undeniable. Following recent shifts in the political landscape, Bitcoin has outperformed many major global assets, including stocks, treasuries, and precious metals, solidifying its reputation as a powerful portfolio diversifier.
This "flight to quality" within the crypto space has also created a distinct rotation story. As institutions fortify their Bitcoin positions, they appear to be de-risking by moving away from more speculative assets that were darlings of the previous cycle. The most notable casualty of this shift has been Solana. Once a high-flyer, Solana's narrative has "cooled" in 2025. Its portfolio weight among investors has seen a sharp decline since late 2024, as institutional capital pivots toward assets with perceived staying power and clearer narratives. While some analysts see this cooling phase as a potential accumulation opportunity before a new leg up, the dominant trend has been a rotation out of Solana and into the perceived safety of Bitcoin.
Part 2: The Great Divide - A Tale of Two Investors
The crypto market of 2025 is characterized by a stark divergence in strategy between its two main cohorts: institutional players and retail investors. While their actions collectively push Bitcoin's portfolio share higher, their underlying motivations and asset choices paint a picture of two different worlds.
The Institutional Playbook: Slow, Steady, and Strategic
For institutions, Bitcoin has become the undisputed king. Their approach is methodical and long-term, driven by a desire for a non-sovereign, inflation-resistant asset that acts as a hedge against macroeconomic instability. The attributes of scarcity, immutability, and portability are paramount in their decision-making. The advent of regulated products like spot ETFs has been a game-changer, providing a familiar and secure access ramp for deploying significant capital.
These large players are not chasing the explosive 100x gains that define crypto lore. Instead, they seek sustained, risk-adjusted returns from an asset that is increasingly uncorrelated with traditional markets during times of stress. Their strategy is one of accumulation, and their exit from more volatile altcoins like Solana is a clear signal of a de-risking mandate. They are building foundational positions in the asset they view as "digital gold," positioning themselves for a future where Bitcoin is a standard component of diversified global portfolios.
The Retail Rebellion: Chasing the Next Big Narrative
In stark contrast, retail investors appear to be reducing their direct Bitcoin holdings. This is not necessarily a rejection of Bitcoin's value, but rather a strategic reallocation of capital toward what they perceive as the next frontier of high growth. Having witnessed Bitcoin's journey to a multi-trillion-dollar asset, many retail participants are now hunting for "the next Bitcoin"—assets with a lower market capitalization but a powerful, near-term catalyst that could trigger exponential gains.
Part 3: The Analyst's Crystal Ball - Price Targets and Technical Tremors
Navigating the Bitcoin market in 2025 requires a steady hand and a tolerance for conflicting signals. While macro-environmental factors are painting a bullish picture, technical and on-chain analyses are flashing cautionary signs, creating a tense equilibrium between hope and fear.
The Bullish Case: A Confluence of Catalysts
The bulls have strong reasons for optimism. A key level on every trader's chart is $105,000. This price is seen as a critical "trend switch"; a decisive break and hold above this zone would signal the end of the recent consolidation and the beginning of a new, powerful phase of the bull market. This optimism is underpinned by powerful external forces.
First, the U.S. Federal Reserve has been signaling a potential interest rate cut as early as July. Historically, lower interest rates reduce the appeal of traditional yielding assets like bonds, pushing investors toward riskier, high-growth assets. This injection of liquidity into the financial system has often preceded significant rallies in Bitcoin, and the market is pricing in this possibility.
Second, a significant de-escalation of geopolitical tensions has bolstered market confidence. The announcement of a ceasefire between Israel and Iran caused an immediate and positive reaction in risk assets. Bitcoin surged past $105,000 on the news, demonstrating its sensitivity to global stability. During times of acute conflict, markets often experience a flight to safety, but when tensions ease, that capital flows back into assets like Bitcoin, which thrive on renewed risk appetite.
The Bearish Counterpoint: Echoes of the Past and On-Chain Warnings
Despite the bullish macro-outlook, clouds remain on the horizon. Some market commentators are warning that the current market is mirroring the patterns of 2021, suggesting that one "final crash" may be necessary to flush out leverage and establish a firm bottom before a sustainable move to new all-time highs.
This thesis is supported by specific technical models. Proponents of Elliott Wave Theory, a method of analysis that posits markets move in predictable, repetitive wave patterns, suggest a significant correction is due. Some Elliott Wave counts predict a corrective move down to the $94,000 level, which would represent a substantial pullback from current prices. Such a move would be seen as a healthy, albeit painful, corrective wave before a final, explosive impulse higher.
Adding weight to this cautious outlook is deep on-chain analysis. A close look at blockchain data pinpoints the $97,000 to $98,000 zone as the market's next true "pivot." This range represents a massive concentration of supply where a large volume of Bitcoin was previously acquired. This means a large cohort of investors has a cost basis in this zone. As the price approaches this level from below, it will likely meet significant selling pressure from investors looking to break even. A failure to decisively break through this wall of supply could trigger a sharp rejection and validate the bearish corrective scenarios.
The Derivatives Dilemma: A Market in Flux
Further complicating the picture is the state of the Bitcoin derivatives market. Reports indicate that futures buying activity has declined sharply, suggesting that the speculative fervor that often fuels rallies may be waning. This can be interpreted in two ways. The bearish view is that speculators are losing confidence, and the market lacks the momentum for a continued push higher. However, a more bullish interpretation is that the market is purging excessive leverage, creating a more stable foundation for a rally built on spot buying—the very kind of buying being done by institutions. This faltering derivatives activity, contrasted with strong institutional spot accumulation, could mean the current rally is in "stronger hands" than previous, more speculative-driven cycles.
Part 4: The Broader Ecosystem - A Story of Diverging Fates
The cross-currents shaping Bitcoin's trajectory are creating ripple effects across the entire crypto ecosystem, with the diverging fortunes of XRP and Solana serving as perfect case studies for the market's 2025 themes.
Beyond the Majors: The Speculative Fringe
As always, the crypto market maintains a speculative fringe. The emergence of assets like "BTC Bull Tokens" represents the high-leverage, high-risk plays that appear during bull markets. These instruments are designed to offer amplified returns on Bitcoin's price movements and attract the most risk-tolerant traders. Their existence underscores the full spectrum of the market—from sovereign wealth funds methodically buying Bitcoin for their treasuries to degens betting on leveraged tokens, the digital asset ecosystem remains a place of immense diversity and opportunity.
Conclusion: Bitcoin's Maturation in a Fractured Market
The year 2025 will be remembered as the year Bitcoin truly came of age as an institutional asset, firmly planting its flag and claiming one-third of the crypto investment landscape. This growing dominance, driven by the steady, strategic accumulation of the world's largest financial players, has provided a powerful anchor in a volatile market.
Yet, this newfound maturity has not tamed the market's wild spirit. It has instead created a great divide. While institutions build their Bitcoin fortress, retail investors are on the hunt for the next narrative-driven explosion, pouring capital into assets like XRP with the hope of front-running a transformative ETF approval.
The market is consequently balanced on a knife's edge. Bullish macroeconomic and geopolitical tailwinds are pushing for a breakout to new all-time highs beyond the pivotal $105,000 level. At the same time, technical and on-chain analyses warn of a potential final washout, a corrective crash to the mid-$90,000s that may be necessary to reset the market for a sustainable ascent.
Bitcoin's path forward will be carved by the resolution of these opposing forces. Can the quiet, persistent demand from institutions absorb the selling pressure from short-term traders and navigate the technical resistance zones? Or will the speculative fervor and corrective patterns that have defined its past cycles pull it down once more before it can climb higher? Whatever the outcome, 2025 has made one thing clear: Bitcoin is no longer just a speculative digital curiosity. It is a global macro asset at the heart of a complex and evolving financial ecosystem, and its journey is far from over.
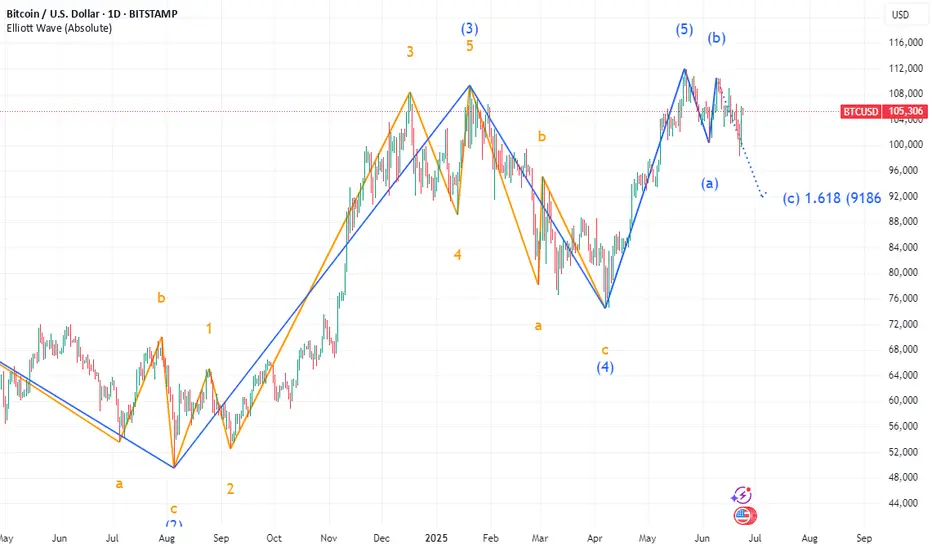
SXTUSDT Forming Falling WedgeSXTUSDT is currently forming a falling wedge pattern, a classic bullish reversal setup that often precedes significant upward price action. This formation indicates a tightening price range and declining volatility, typically signaling a breakout to the upside as selling pressure weakens. Technically, this setup becomes even more powerful when accompanied by increased volume near the breakout point — which is now becoming evident on SXTUSDT’s chart.
The wedge’s structure shows a series of lower highs and lower lows converging toward an apex. Once a confirmed breakout above the descending resistance occurs, the projected move could yield an impressive 140% to 150%+ gain from current levels. This projection aligns with historical wedge performance, where the move after breakout often mirrors the widest part of the wedge pattern. Such a scenario positions SXTUSDT as a strong candidate for short-term swing trades and longer-term speculative entries.
Investor interest in this project has been rising steadily, evidenced by increased discussion across trading communities and growing activity in order books. As the broader market sentiment shifts toward undervalued altcoins, SXTUSDT is likely to benefit from capital rotation. If momentum continues building, it could spark a breakout rally fueled by both technical and fundamental appeal.
Traders should monitor key breakout levels and look for confirmation via bullish candlestick formations and surging volume. SXTUSDT’s wedge breakout potential puts it in a favorable technical position to outperform in the coming sessions. Patience and precise entry could reward traders handsomely if the wedge pattern plays out as expected.
✅ Show your support by hitting the like button and
✅ Leaving a comment below! (What is You opinion about this Coin)
Your feedback and engagement keep me inspired to share more insightful market analysis with you!

Bitcoin - Looking To Buy Pullbacks In The Short TermM15 - Strong bullish move.
No opposite signs.
Currently it looks like a pullback is happening.
Expecting further continuation higher until the two Fibonacci support zones hold.
If you enjoy this idea, don’t forget to LIKE 👍, FOLLOW ✅, SHARE 🙌, and COMMENT ✍! Drop your thoughts and charts below to keep the discussion going. Your support helps keep this content free and reach more people! 🚀
--------------------------------------------------------------------------------------------------------------------

Bitcoin BTC Pullback Strategy: How I’m Planning My Next EntryI’m currently watching BTCUSDT 👀. Yesterday, we saw a bullish break of structure 🔼, and my bias is to follow that momentum moving forward 📈. Right now, price is overextended 📊, so I’m looking for a retracement into equilibrium, ideally around the 50–61.8% Fibonacci zone 📏.
If price pulls back into that range and holds above the bullish imbalance (discussed in the video) 🧱, I’ll be watching for a long opportunity 🎯. My targets are set at the previous highs and the Fibonacci extension levels 🔝.
⚠️ Disclaimer
This is not financial advice. Trading involves risk, and you should only trade with capital you can afford to lose. Always do your own analysis or consult a qualified financial advisor.

$BTC Breaks Out $110K in Sight?CRYPTOCAP:BTC has broken out of its descending channel and is now trading around $105K.
This breakout signals a potential trend reversal, with a projected move toward $111K.
Holding above the breakout zone could confirm further bullish momentum.
DYRO, NFA
