₿itcoin: PullbackBitcoin has experienced significant selling since Friday, briefly slipping below the $100,000 mark. We previously mentioned that a sharper pullback wouldn't surprise us. Whether prices will drop a bit further remains to be seen for the moment. Ultimately, we still expect Bitcoin to climb into the upper blue Target Zone (coordinates: $117,553 – $130,891) before a broader C-wave sell-off occurs, pushing the price down to the lower blue Target Zone (coordinates: $62,395 – $51,323). There, we anticipate the low of the larger orange wave a, which should mark the start of another corrective upward move. Afterward, we're preparing for the last downward leg of blue wave (ii). However, if Bitcoin directly surpasses the resistance at $130,891 – and thus our upper blue Target Zone – we'll locate it still in blue wave alt.(i) (30% probability).
📈 Over 190 precise analyses, clear entry points, and defined Target Zones - that's what we do.
Bitcoinlong

ACTUSDT Forming Classic Falling Wedge ACTUSDT is currently exhibiting a classic falling wedge pattern on the chart—a bullish reversal setup known for its high probability of a breakout to the upside. After a consistent downtrend, the price action has started to compress within converging trendlines, suggesting that selling pressure is diminishing. A breakout above the wedge's resistance line could trigger a sharp price surge. Technical traders often look to such formations for potential entries, especially when combined with growing volume and renewed market sentiment.
Volume analysis reveals a notable uptick in recent sessions, signaling that investors are beginning to accumulate ACTUSDT. This increased interest could be due to fundamental news or broader market momentum returning to altcoins. When volume expands near the apex of a falling wedge, it usually reinforces the validity of the pattern and strengthens the breakout potential. With this setup, the projected move points to a possible gain of 140% to 150%, aligning with previous key resistance levels that the price could retest post-breakout.
On a momentum front, indicators like RSI and MACD are starting to turn bullish, offering early signs of a reversal. The price is also holding above short-term support zones, suggesting the formation of a base. The combination of technical structure, volume dynamics, and improving sentiment makes ACTUSDT a strong contender for a breakout move in the near term. Such opportunities are especially attractive in trending markets where capital rotates quickly into coins showing strong chart setups.
Given this confluence of bullish signals, ACTUSDT could become a leading performer in the altcoin space over the coming weeks. Traders and investors are advised to keep a close watch for breakout confirmation and subsequent retest levels, which could offer optimal entry points for both short-term gains and medium-term swing setups.
✅ Show your support by hitting the like button and
✅ Leaving a comment below! (What is You opinion about this Coin)
Your feedback and engagement keep me inspired to share more insightful market analysis with you!

Bitcoin Hits PRZ — Is This the Perfect Short Entry?Bitcoin ( BINANCE:BTCUSDT ) has entered the Potential Reversal Zone (PRZ) after a strong bullish impulse , testing the confluence of Daily Resistance(3) .
In terms of Elliott Wave analysis , the market seems to have completed a complex WXY corrective structure , with the recent rally likely representing the final wave Y . This makes the current zone highly reactive for potential reversal .
I expect Bitcoin to retrace toward the CME Gap($105,075-$105,055) and possibly continue downward toward the Support zone($104,380-$103,060) and Cumulative Long Liquidation levels if the sellers regain momentum .
Cumulative Short Liquidation Leverage: $107,568-$106,601
Cumulative Long Liquidation Leverage: $105,360-$104,784
Cumulative Long Liquidation Leverage: $103,937-$103,217
Note: It is better to look for short positions at the Potential Reversal Zone (PRZ) or if Bitcoin touches $104,780 before reaching PRZ. That is why I chose to label this analysis as ''Short".
Note: If Bitcoin can touch $107,620 , there is a possibility of breaking the resistance lines and increasing further.
Please respect each other's ideas and express them politely if you agree or disagree.
Bitcoin Analyze (BTCUSDT), 1-hour time frame.
Be sure to follow the updated ideas.
Do not forget to put a Stop loss for your positions (For every position you want to open).
Please follow your strategy and updates; this is just my Idea, and I will gladly see your ideas in this post.
Please do not forget the ✅' like '✅ button 🙏😊 & Share it with your friends; thanks, and Trade safe.

₿itcoin: Holding steadySince our last update, Bitcoin has traded in a relatively stable range. As expected, there's still a strong case for the crypto leader to climb into the upper blue Target Zone between $117,553 and $130,891. However, a deeper pullback below the $100,000 mark remains a real possibility before that move unfolds. Regardless of the path it takes, we continue to expect Bitcoin to reach this upper zone, completing green wave B. From there, a corrective wave C—also in green—is likely to follow, driving the price down toward the lower blue Target Zone between $62,395 and $51,323. This move would mark the end of the broader orange wave a. For now, we’re watching for a potential b-wave recovery before the final leg lower toward the bottom of blue wave (ii) takes shape. That said, there's still a 30% chance that blue wave (i) isn’t done yet and could extend significantly above $130,891 before any meaningful correction begins.
📈 Over 190 precise analyses, clear entry points, and defined Target Zones - that's what we do.

BMTUSDT Forming Strong BullishBMTUSDT is demonstrating a strong bullish structure following its breakout from a descending wedge, which typically signals a reversal of trend. After consolidating for several weeks in a falling wedge pattern, the breakout to the upside—supported by increasing volume—marks a clear shift in momentum. Buyers are reclaiming dominance, and the price is now holding above a strong support zone highlighted in purple, which has acted as a solid accumulation area.
The chart shows a projected upward move with two target levels, suggesting potential gains of 30% in the near term and over 100% in the mid-term. These targets are realistic given the size of the breakout and the bullish price action. The pattern breakout is accompanied by bullish candles and consistent higher lows, adding credibility to the breakout setup. Technical traders watching this pair may interpret the current setup as a high-reward, low-risk opportunity.
What makes BMTUSDT especially interesting is the timing—it's breaking out while the broader market is showing signs of recovery and renewed interest in altcoins. As sentiment shifts across the crypto landscape, projects like BMT that show real-time technical strength tend to draw in both retail and algorithmic interest. Combined with healthy trading volume, this can fuel a rapid price climb toward the highlighted targets.
This setup places BMTUSDT on the radar for breakout traders and swing investors alike. With strong support levels, bullish breakout confirmation, and significant upside potential, BMTUSDT could offer one of the most promising mid-cap opportunities in the current market cycle.
✅ Show your support by hitting the like button and
✅ Leaving a comment below! (What is You opinion about this Coin)
Your feedback and engagement keep me inspired to share more insightful market analysis with you!

BTC BOTTOM $ - 100% Never Fails (2013 - Today)Bitcoin Weekly Chart Going Back To 10+ Years
We are looking at the BitStamp Green Support Line here that has Marked the bottom correctly before 100% of the time for each each bull cycle pump on bitcoin going 3/3 without fail.
We are now looking to see if we can go 4/4 and mark the new bottom buy with a quick wick down to the green support currently around 73K+ this week, but as each week closes the bitcoin bottom number will rise as the green support line rises over time.
Good luck. Let's see if the 4th time is also the charm.

ALTUSDT Forming Falling WedgeALTUSDT has recently completed a breakout from a well-formed falling wedge pattern, a strong bullish technical signal that often precedes significant upward momentum. The wedge breakout is backed by a noticeable spike in trading volume, adding credibility to the move and indicating growing market participation. This classic reversal pattern suggests that a major trend shift could be underway, and price projections indicate a potential gain in the range of 70% to 80%, aligning with historical performance of such breakouts.
What makes this setup more compelling is the structure of the wedge itself—tight, consistent, and with clear lower highs and lower lows, followed by a strong bullish candle cutting through resistance. This is a textbook example of a bullish breakout where the price decisively exits the consolidation zone and starts trending upward. With volume confirming the breakout, many traders see this as an early-stage rally signal with room to grow.
Investor sentiment around ALTUSDT is gaining strength, particularly on social platforms and trading communities. This surge in attention could fuel further buying pressure, particularly as the breakout becomes more visible to retail and technical traders. ALTUSDT has shown the ability to move sharply during bullish phases, and this breakout could signal the beginning of a new leg higher, especially if it maintains momentum over the next few daily closes.
With strong technical structure, increasing investor interest, and supportive volume, ALTUSDT is shaping up to be one of the stronger bullish breakout candidates in the current market environment. Traders looking for high-reward setups may find this an ideal entry point with a well-defined technical framework and attractive upside potential.
✅ Show your support by hitting the like button and
✅ Leaving a comment below! (What is You opinion about this Coin)
Your feedback and engagement keep me inspired to share more insightful market analysis with you!

BTC/USDT Long Trade Setup – 1H Chart AnalysisBTC/USDT Long Trade Setup – 1H Chart Analysis
BINANCE:BTCUSDT
Hello traders! Sharing a recent long entry I took on Bitcoin (BTC/USDT) based on price action and liquidity concepts. This trade is taken on the 1-hour timeframe and aligns with my strategy of combining liquidity sweeps, support zones, and market structure shifts.
---
🔍 Trade Overview:
Entry Price: 104,704 USDT
Stop Loss: 103,660 USDT
Take Profit (Target): 108,349 USDT
Risk-to-Reward Ratio (RRR): Approximately 1:3
---
🧠 Trade Idea Behind the Entry:
As you can see on the chart, BTC had been in a downtrend and recently made a strong move into a key liquidity zone. This zone had previously seen multiple touches and rejections, making it an area of interest for both buyers and sellers.
The price swept liquidity below the previous low (labelled as “Liquidity Sweep $$$”), grabbing stop losses of early buyers and triggering limit orders of smart money. This move into the liquidity zone was followed by a strong bullish reaction – a signal that buyers may be stepping in.
Additionally, the "Break of Structure" (BOS) confirms a potential shift in market direction. The reaction from the liquidity zone indicates that this level is holding as new support.
---
🛠️ Why I Took the Trade:
1. Liquidity Sweep: The wick that pierced the liquidity zone signals stop-hunting and accumulation. These moves often precede a strong reversal.
2. Demand Zone Reaction: After the sweep, the candle closed bullish inside the demand box. This shows buyer strength.
3. Risk Management: The stop loss is set just below the liquidity zone to protect from deeper sweeps while keeping the RR healthy.
4. High Probability Target: The target is placed near the next resistance level around 108,349, which also aligns with a clean imbalance that price may want to fill.
---
📊 Technical Confidence:
Confluence Factors:
✅ Liquidity sweep
✅ Demand zone reaction
✅ Market structure shift
✅ High RR
✅ No immediate resistance till target
This type of setup reflects smart money behavior – first pushing price below structure to grab liquidity and then reversing sharply. The bullish momentum after the sweep gave extra confirmation.
---
🧭 What I’m Watching Now:
I will continue monitoring how price reacts around the 105,500–106,000 range. If momentum continues with higher highs and higher lows, I may trail my stop loss to lock in profits.
---
Let me know what you think of this setup! Have you taken a similar trade or are you waiting for confirmation? Drop your thoughts or charts below 👇
Stay disciplined, manage your risk, and trust the process. 🚀
#Bitcoin #BTCUSD #PriceAction #LiquiditySweep #SmartMoney #CryptoTrading #TradingSetup #TechnicalAnalysis #TradeJournal

Market Overview
WHAT HAPPENED?
Strong sales resumed last week after a short period of growth. This was provoked by the escalation of the conflict in the Middle East.
After testing and fixing the $105,800-$104,500 zone (accumulated volumes), strong volume deviations appeared, which should be perceived as protection on the part of the buyer.
WHAT WILL HAPPEN: OR NOT?
At the moment, an attempt is being made to position the volumes accumulated in the range of $105,600-$104,700 in the direction of growth. Strong support has already been formed in the area of $104,000-$102,900 (abnormal volumes).
When the four-hour candle closes above the $106,400 mark, it’ll be possible to additionally consider the zone of accumulated volumes for buys (if there is a reaction from it).
The main scenario is a long position with targets up to the nearest resistance. In case of easing of geopolitical tensions, there remains the possibility of updating the ATH.
Alternative scenario: correction to the support zone of $101,600-$100,000 (volume anomalies). With this development, a prolonged rebound is possible.
Sell Zones:
$109,000–$110,000 (accumulated volume)
Buy Zones:
$105,600–$104,700 (accumulated volume)
$104,000–$102,900 (volume anomalies)
$101,600–$100,000 (significant volume anomalies)
$98,000–$97,200 (local support)
Level at $93,000
$91,500–$90,000 (strong buying imbalance)
IMPORTANT DATES
Macroeconomic developments this week:
• Tuesday, June 17, 03:00 (UTC) — publication of the Japanese interest rate decision;
• Tuesday, June 17, 12:30 (UTC) — publication of the core retail sales index for May in the United States, the volume of retail sales for May in the United States;
• Wednesday, June 18, 06:00 (UTC) — publication of the UK consumer price index compared to May last year;
• Wednesday, June 18, 9:00 (UTC) — publication of the consumer price index in the Eurozone compared to May last year;
• Wednesday, June 18, 12:30 (UTC) — publication of the number of initial applications for US unemployment benefits;
• Wednesday, June 18, 18:00 (UTC) — publication of FOMC economic forecasts, FOMC statement, US Federal Reserve interest rate decision;
• Wednesday, June 18, 18:30 (UTC) — US FOMC Press Conference;
• Thursday, June 19, 7:30 (UTC) — publication of the Q2 interest rate decision in Switzerland;
• Thursday, June 19, 8:00 (UTC) — press conference of the National Bank of Switzerland;
• Thursday, June 19, 11:00 (UTC) — publication of the June interest rate decision in the UK;
• Thursday, June 19, 12:30 (UTC) — publication of the number of initial applications for unemployment benefits in the United States;
• Friday, June 20, 12:30 (UTC) — publication of the Philadelphia Federal Reserve's index of manufacturing activity for June in the United States.
*This post is not a financial recommendation. Make decisions based on your own experience.
#analytics

Bitcoin Bounce & Breakout PlayChart Analysis:
🔹 Support Holding Strong:
BTC is respecting a key support area (~$105,600), which previously acted as resistance (marked by recent ATH).
🔹 EMA 70 (Blue Line):
Price is hovering above the EMA, adding bullish confirmation.
🔹 Bullish Projection Path:
The chart shows a projected bullish move toward the sell zone near $113,200 – $113,300, representing a potential 4.4% gain from the breakout.
🔹 Key Zones:
Support Zone: $105,600
Supply Zone: $100,500
Sell Zone (TP Zone): $113,200+
📌 Outlook:
If BTC breaks and holds above the resistance (~$107,000), a strong upward rally could follow. Entry near support or on breakout, with tight risk management, offers a favorable risk/reward.
✅ Entry Options:
Breakout Entry:
Trigger: Break and close above $107,200
Confirmation: Retest and hold above the breakout zone
Entry: $107,300 – $107,500
Support Bounce Entry:
Trigger: Pullback to support zone (~$105,600) with bullish reversal candle
Entry: $105,600 – $105,800
🎯 Target Zones (TP):
TP1: $110,400 (minor resistance)
TP2: $113,200 – $113,300 (major sell zone)
TP3 (aggressive): $114,000+
🔻 Stop Loss (SL):
For breakout entry: SL below $106,200
For bounce entry: SL below $105,200 or $104,800 (structure break)
📈 Risk–Reward Ratio:
Approx. 1:2.5 to 1:3+ depending on entry and target
🧠 Trade Management:
Move SL to breakeven after hitting TP1
Partial profit booking at TP1
Trail remaining with manual or dynamic SL (e.g., below EMA or recent low)
⚠️ Risk Notes:
Avoid chasing price without breakout confirmation
Watch for fakeouts and heavy selling near TP zones
Adjust position size based on your risk tolerance

BTC “Golden Cross” Looms, but Geopolitics Could Delay ItBitcoin’s “Golden Cross” Looms, but Geopolitical Shocks Could Delay the Breakout
Deep dive into price action, derivatives, on-chain data, and the tug-of-war between Middle-East risk and crypto bull-run momentum
________________________________________
Table of Contents
1. Executive Summary
2. Scene-Setter: BTC at $105 K in a World on Edge
3. Technical Spark: What a Golden Cross Really Means
4. Price Action: From $103 K Dip to $106.8 K Hurdle
5. Options Market: A Sudden Lurch Toward Puts
6. Macro Overhang: Why Israel–Iran Turmoil Matters to Bitcoin
7. On-Chain Pulse: 656 % Cycle Gain, Yet Supply Is Tighter Than 2021
8. Mining Fundamentals: Difficulty Eases, Margins Improve
9. Corporate Treasuries: The Quiet, Sticky Bid
10. Targets & Scenarios: $97 K Downside vs. $229 K Upside
11. Strategy Playbook for Traders & Investors
12. Conclusion: Delayed, Not Derailed
13. Disclaimers
________________________________________
1. Executive Summary
• Bitcoin (BTC) is trading in a tight $103 K–$108 K band, unable to confirm a breakout as Middle-East tensions push investors into hedging mode.
• A Golden Cross—the 50-day SMA crossing above the 200-day—could flash within 10 trading sessions, historically adding +37 % median upside over the subsequent 90 days.
• Options flow has flipped decisively toward puts, with the 25-delta skew hitting –10 %, its most bearish since the FTX collapse, signaling short-term anxiety even as long-term bets remain bullish.
• On-chain metrics (exchange balances at six-year lows, HODLer supply at all-time highs) reveal structural demand; Glassnode notes a 656 % cycle advance despite a trillion-dollar market cap.
• Analysts’ upside targets range from $140 K (Q3) to $270 K (October) and even $229 K based on the Golden Cross fractal. Yet a clean break of $104 K support opens room to $97 K first.
________________________________________
2. Scene-Setter: BTC at $105 K in a World on Edge
Bitcoin entered 2025 with a blistering rally—spot ETFs hoovered nearly 200 K coins in four months, miners sold aggressively into strength, and macro tailwinds (Fed easing, USD weakness) fueled risk appetite. Then two macro curveballs hit:
1. Sticky U.S. core inflation revived “higher-for-longer” rate fears.
2. Israel–Iran hostilities spooked global markets, sending Brent crude to $76 and sparking a dash for USD liquidity.
BTC, once heralded as “digital gold,” behaved like a high-beta tech stock: it slipped 7 % in 48 hours, tagging $103,200 before bargain hunters stepped in. As of this writing, price sits near $105,800—right on the 100-hour SMA. Whether we escape the range depends on which force proves stronger: geopolitical dread or the long-term structural bid.
________________________________________
3. Technical Spark: What a Golden Cross Really Means
A Golden Cross occurs when the 50-day simple moving average (SMA-50) crosses above the 200-day (SMA-200). In Bitcoin’s 14-year history, we have logged nine such events:
Year Days to Cross 90-Day Return 180-Day Return
2013 51 +88 % +202 %
2015 73 +34 % +67 %
2019 46 +193 % +262 %
2020 38 +77 % +112 %
2023 59 +29 % +48 %
Median 90-day gain: +37 %
Median drawdown post-cross: –12 %
We are ~$700 shy of triggering the cross (SMA-50 at $97.9 K, SMA-200 at $98.1 K and rising). Assuming volatility stays muted, the lines converge within two weeks, potentially firing a widely watched buy signal. But remember: the cross is lagging; smart traders anticipate, not react.
________________________________________
4. Price Action: From $103 K Dip to $106.8 K Hurdle
Key intraday levels (Kraken feed):
• Support 1: $104,000 – prior weekly low + bullish order-block
• Support 2: $101,200 – 0.786 Fib retrace of the Feb–Mar impulse
• Bear Pivot: $97,000 – 200-day EMA + high-confluence volume node
• Resistance 1: $106,800 – last week’s swing high; three failed probes
• Resistance 2: $108,500 – May monthly open
• Bull Pivot: $113,000 – neckline of the March distribution range
Monday’s bounce broke a declining trend-line from $110 K, printing a higher low—constructive, yet bulls require a daily close >$106.8 K to invalidate the short-term bearish structure.
________________________________________
5. Options Market: A Sudden Lurch Toward Puts
Deribit data (largest BTC options venue):
• Put/Call Ratio: 0.62 last Friday → 0.91 today
• 25-Delta Skew (1-month): –10 %, lowest since Nov-2022
• Max-Pain for April 26 expiry: $104 K (huge open interest)
Translation: traders rushed to buy protective puts as Iran war headlines crossed. Market-makers, short those puts, delta-hedged by shorting spot or perpetual futures, adding downward pressure—classic gamma feedback loop.
Yet term structure remains contango; June and September IVs price higher topside. Institutions appear to sell near-dated panic, accumulate long-dated calls—a bullish medium-term stance.
________________________________________
6. Macro Overhang: Why Israel–Iran Turmoil Matters to Bitcoin
1. Risk-Off Correlation: Despite “digital gold” narratives, BTC’s 30-day correlation with the Nasdaq-100 sits at 0.64; equities slide → crypto follows.
2. USD Liquidity Drain: War premium lifts oil, stoking inflation and forcing the Fed to delay cuts; higher real yields pressure non-yielding assets.
3. Regulatory Optics: Heightened national-security chatter emboldens lawmakers keen to scrutinize crypto, a perceived sanctions-evasion channel.
4. Regional Flows: The Middle-East hosts some of the largest sovereign-wealth pools; risk aversion could pause their crypto allocations.
5.
Hence, every missile headline becomes a volatility catalyst. Still, flash-risk events fade quickly if energy supply stays intact, offering windows for BTC to re-assert its secular trend.
________________________________________
7. On-Chain Pulse: 656 % Cycle Gain, Yet Supply Is Tighter Than 2021
Glassnode frames Bitcoin’s ongoing bull as “one of the most explosive relative to market cap gravity.” Highlights:
• Cycle Return: 656 % from the $14 K November-2022 bottom—impressive given the asset is now >$2 T in free-float value, dwarfing 2017’s sub-$100 B base.
• Exchange Balances: Just 2.02 M BTC on centralized venues—13-year low.
• Realized Price (short-term holders): $92,500—suggests marginal buyers remain well in profit.
• Entity-Adjusted Dormancy Flow: At 275 K BTC/day vs. 2021’s 550 K—implying HODLers are less willing to spend.
Put simply: even after a seven-fold rally, supply scarcity persists.
________________________________________
8. Mining Fundamentals: Difficulty Eases, Margins Improve
The April 20 adjustment saw difficulty dip 1.2 %, the first contraction since January. Why it matters:
• Post-Halving Breathing Room: Block subsidy fell to 1.5625 BTC; a difficulty rollback cushions miner profit margins, lowering forced selling risk.
• Hashrate Plateau: Network hashrate hovers at 640 EH/s, only 3 % off the ATH—miners remain confident.
• Transaction Fees: Average fee per block = 0.37 BTC, still elevated by historical standards thanks to BRC-20 activity.
Miners thus appear cash-flow stable, reducing downside pressure on spot markets compared to previous post-halving eras.
________________________________________
9. Corporate Treasuries: The Quiet, Sticky Bid
Since MicroStrategy cracked the dam, 68 public companies now hold BTC on balance sheets, totaling 412,000 coins (~$43 B). Recent newcomers:
Company Purchase Date BTC Added Avg Cost
SemiconX Feb-2025 2,500 $94,800
Nordic Logistics Mar-2025 800 $98,200
Atlantech Energy Apr-2025 1,200 $101,500
Traits of corporate treasuries:
• Long-Dated Liabilities: Align with Bitcoin’s four-year halving cadence.
• Low Turnover: None of the 68 have sold core holdings despite 80 % drawdowns in 2022.
• Regulatory Transparency: SEC filings broadcast purchases, inviting copycat demand.
This sticky bid stabilizes spot markets during macro squalls.
________________________________________
10. Targets & Scenarios: $97 K Downside vs. $229 K Upside
Bearish Path (30 % probability)
• Trigger: Israel–Iran broadens, Fed signals no cuts in 2025.
• Price Action: Break $104 K, bulls capitulate at $97 K (200-day).
• Depth: Could wick to $88–90 K (0.618 retrace) if macro gloom persists.
Base Case (50 % probability)
• Trigger: Skirmishes contained; oil cools, Fed cuts twice by December.
• Price Action: Golden Cross confirms, BTC grinds to $128 K by September.
• Highs: $140 K tap as ETF inflows resume.
Bullish Path (20 % probability)
• Trigger: Middle-East cease-fire + ETF FOMO round two + dovish Fed pivot.
• Fractals: Prior Golden-Cross extensions averaged +120 % at extreme.
• Price Action: $150 K by summer, $229 K (Fib 2.618 from 2022 low) by year-end.
• Blow-Off: $270 K October spike before the next cyclical bear begins.
________________________________________
11. Strategy Playbook for Traders & Investors
Horizon Bias Instruments Risk Management
Intraday (0–48 h) Range scalp $104–$107 K Perp futures (5× max), options gamma scalping Hard stop $103 K; position <1 % equity
Swing (2–8 wks) Buy pullbacks ahead of Golden Cross Spot, dated futures roll, 1-month $110 K calls Stop $97 K daily close; size 5–10 %
Position (3–6 mo) Accumulate for $140–150 K target Spot, June/Sept call spreads ($120/150) Hedge via 25 % put collar
Long-Term (1–4 yr) Maintain core stash; ignore noise Cold storage, DCA Re-balance only when price doubles
Optional hedge: Long Gold / Short BTC ratio spread as a geopolitical shock absorber; ratio 1.3 currently, mean-reverts to 1.1 post-crises.
________________________________________
12. Conclusion: Delayed, Not Derailed
Bitcoin stands at a crossroads: a textbook Golden Cross beckons, ETF inflows smolder, miners relax, and corporate treasuries drip-feed demand. Yet war headlines and a cautious options market act as sandbags on the balloon. History says macro shocks slow, not stop secular bull cycles. Unless Middle-East conflict strangles global liquidity or the Fed slams the brakes far harder than priced, BTC’s higher-time-frame structure remains bullish. Expect turbulence, embrace risk controls—but don’t mistake a weather delay for a busted engine.
________________________________________
13. Disclaimers
This article is for educational purposes only and does not constitute financial advice. Cryptocurrency investing involves substantial risk; never invest more than you can afford to lose.

JTOUSDT Forming Bullish WaveJTOUSDT is currently shaping a promising bullish wave pattern, signaling potential continuation of an upward trend in the coming days or weeks. This wave formation is often associated with renewed buying interest and signals that price action is building strong momentum for another leg higher. Coupled with a steady increase in trading volume, the technical structure suggests that the asset may soon experience a substantial breakout. Based on historical wave behavior and key support/resistance levels, an expected gain of 50% to 60% appears realistic.
Market interest around JTO has been growing, with investors closely watching its price behavior as it consolidates above recent lows. This consolidation phase is often a prelude to significant rallies, especially when backed by solid wave structure and volume confirmation. As more liquidity enters the market, JTOUSDT is positioned to attract both swing traders and long-term holders seeking medium-risk, high-reward opportunities.
From a technical perspective, the coin is forming higher lows while testing critical resistance zones. If it manages to clear those levels with conviction, price targets could range between the upper Fibonacci extensions and prior distribution zones. The growing market chatter and improving sentiment around the JTO project further support the bullish thesis.
Keep an eye on upcoming market catalysts and macro trends, as they could amplify the bullish momentum already forming on the JTOUSDT chart. With a disciplined approach, this could become one of the standout performers in the mid-cap altcoin segment in the near term.
✅ Show your support by hitting the like button and
✅ Leaving a comment below! (What is You opinion about this Coin)
Your feedback and engagement keep me inspired to share more insightful market analysis with you!

THEUSDT Forming Falling Wedge BullishTHEUSDT is showcasing a strong technical breakout from a falling wedge pattern, a formation widely regarded as bullish in the world of crypto trading. This structure typically signals the end of a downtrend and the potential start of a strong upward movement. With price action now breaching the wedge’s upper resistance line and confirming bullish momentum, this breakout opens up the possibility for an explosive rally. Current projections point to a potential gain of 90% to 100%+, making it one of the more attractive setups among altcoins.
The volume is also confirming the breakout, suggesting that traders and investors are actively entering positions. This increase in participation often fuels further upward movement, especially when combined with a technically significant chart pattern like this. THEUSDT is not only displaying strength on the technical side, but also showing promising signals from investor sentiment, with more eyes turning toward this project across social platforms.
Price targets for this setup are derived from the height of the wedge and historical resistance zones. As seen in the chart, the upside potential could push THEUSDT toward the $0.50–$0.65 range, where previous liquidity zones may come into play. With altcoins heating up and capital rotating into high-upside plays, THEUSDT’s setup offers an excellent risk-to-reward profile at this stage.
Traders should monitor volume continuation and possible retests of the breakout zone as confirmation. With the broader market recovering and interest returning to promising altcoins, THEUSDT stands out as a potential leader in the next bullish wave.
✅ Show your support by hitting the like button and
✅ Leaving a comment below! (What is You opinion about this Coin)
Your feedback and engagement keep me inspired to share more insightful market analysis with you!

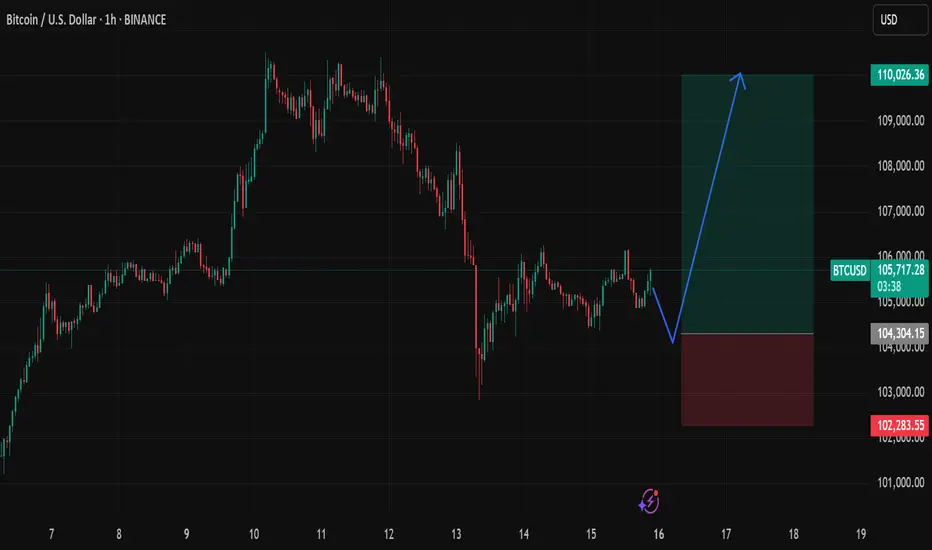
Waiting for a short-term BTC buy — easy setup, clean trade.No need for words — just follow the arrow and check the risk/reward.
I'm starting a signal room soon, but for now, it's all free. Watch and decide for yourself.
There is another Bearish BPR zone below the current price.BTC/USDT Market Update – Clear, Detailed, and Easy to Understand (Even for Beginners)
Let’s take a look at what’s happening with Bitcoin (BTC/USDT) right now explained in a way that even someone new to trading can follow along and understand.
Recently, Bitcoin hit a new high it was climbing up steadily. But then, due to negative global news related to war, the market took a hit and started dropping sharply.
Currently, BTC is trading at a (BPR) this is a technical area that often acts as a strong resistance zone, where the price tends to face rejection and reverse.
👉 Right now, Bitcoin is struggling to move higher and appears to be getting rejected from this BPR level.
But here’s where it gets more interesting:
🔻 There is another Bearish BPR zone below the current price, and the market has already touched that zone once before bouncing upward.
So what's the current situation?
📍 If Bitcoin is able to break above the current Bearish BPR (the level where it’s trading now) — it would be a bullish sign, and the market may start rising again.
📍 However, if BTC fails to break this resistance level, then we could see another strong move to the downside, possibly heading back to lower support zones.
🚨 Key Takeaway:
This level — the one BTC is currently interacting with — is very important.
📌 Traders should keep a close eye on it.
📌 Let the market reveal its direction before making any decisions.
Remember:
⚠️ This is not financial advice. Always Do Your Own Research (DYOR).

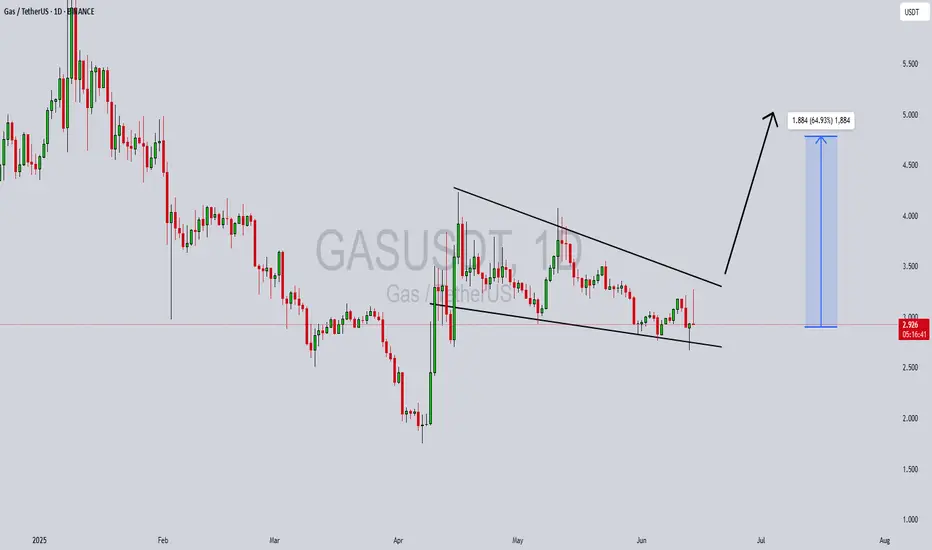
GASUSDT Forming Strong Bullish ReversalGASUSDT is currently presenting a classic falling wedge pattern, a historically strong bullish reversal signal in technical analysis. This structure often precedes significant upward breakouts, especially when accompanied by increasing volume — which we’re seeing here. The price action suggests accumulation is underway, and with investor sentiment turning optimistic, a move to the upside appears increasingly likely. The expected gain ranges from 10% to 50%, with solid risk-reward potential for swing traders and mid-term holders.
Volume analysis confirms a healthy increase in interest, which often precedes momentum-driven rallies in crypto pairs like GASUSDT. The falling wedge has formed after a sustained downtrend, and now with a breakout on the horizon, the bullish case is further supported. GAS, the utility token for the NEO blockchain, remains a key asset in smart contract execution, and renewed activity on the NEO network could add fundamental strength to this technical setup.
From a macro perspective, GASUSDT is gaining traction as investors look to capitalize on undervalued altcoins with real utility and strong development backing. The project’s underlying use case — fueling transactions and resources on the NEO blockchain — continues to hold relevance in the broader smart contract ecosystem. As blockchain infrastructure plays come back into focus, GAS may benefit from both a technical breakout and a fundamental narrative shift.
In summary, GASUSDT is aligning both technically and fundamentally for a bullish phase. The falling wedge breakout potential, rising volume, and ecosystem utility create a compelling opportunity for investors looking to gain exposure to a medium-cap crypto with solid upside potential.
✅ Show your support by hitting the like button and
✅ Leaving a comment below! (What is You opinion about this Coin)
Your feedback and engagement keep me inspired to share more insightful market analysis with you!
BITCOIN BIASWe saw price broke a resistance structure followed by an inducement. Currently anticipating a reacting back to either breaker block or order block for a potential entry to go LONG.

BTC/USDT Analysis: Unproductive Selling Pressure
Hello everyone! This is a daily analysis from a trader-analyst at CryptoRobotics.
Yesterday, Bitcoin once again tested the sell zone at $110,000–$110,600 (profit-taking by a large player) and moved into another correction.
Looking at the current accumulation, we’ve noticed strong market selling pressure that so far hasn't led to any significant result. The seller’s momentum is weak, so most likely we’ll see another upward impulse and a test of the all-time high (ATH).
Buy Zones:
$105,800–$104,500 (accumulated volumes),
$101,600–$100,000 (zone of previous pushing volumes + current buyer defense),
$98,000–$97,200 (local support),
Level at $93,000,
$91,500–$90,000 (strong buying imbalance).
This publication is not financial advice.

BTC alternative scenarioThis Scenario is Possible,not a big fan of it but if I get a reaction on the level will go for a buy with small risk
levels highlighted
AUSDT Forming Bullish ReversalAUSDT is showing early signs of a bullish reversal, supported by increasing volume and strong recovery candlesticks after a steep decline. The chart suggests a consolidation phase has completed, and the asset is preparing for a potential continuation to the upside. Although this setup may not be as aggressive as others, the market structure implies that a healthy gain of 20% to 30%+ could be realistic in the short term. Traders looking for a balanced risk-reward scenario may find this pair appealing.
What stands out about AUSDT is the strong buying interest that has recently emerged, with the price bouncing back from its lows on notable volume. This could be an indication of accumulation by smart money or early positioning before a breakout. If this momentum continues, the price may establish a steady uptrend with a series of higher highs and higher lows, signaling continued bullish sentiment.
As the broader market conditions stabilize and liquidity flows back into promising altcoins, AUSDT could benefit from increased visibility and investor interest. While the expected gain isn't extreme, the gradual upward movement makes this an attractive play for swing traders and investors who prefer steadier, technically sound setups.
With market momentum shifting and technical indicators aligning for a breakout, AUSDT is worth watching in the coming days. Price action will likely respect the projected levels outlined on the chart, making it a timely candidate for a short-to-mid-term bullish setup.
✅ Show your support by hitting the like button and
✅ Leaving a comment below! (What is You opinion about this Coin)
Your feedback and engagement keep me inspired to share more insightful market analysis with you!

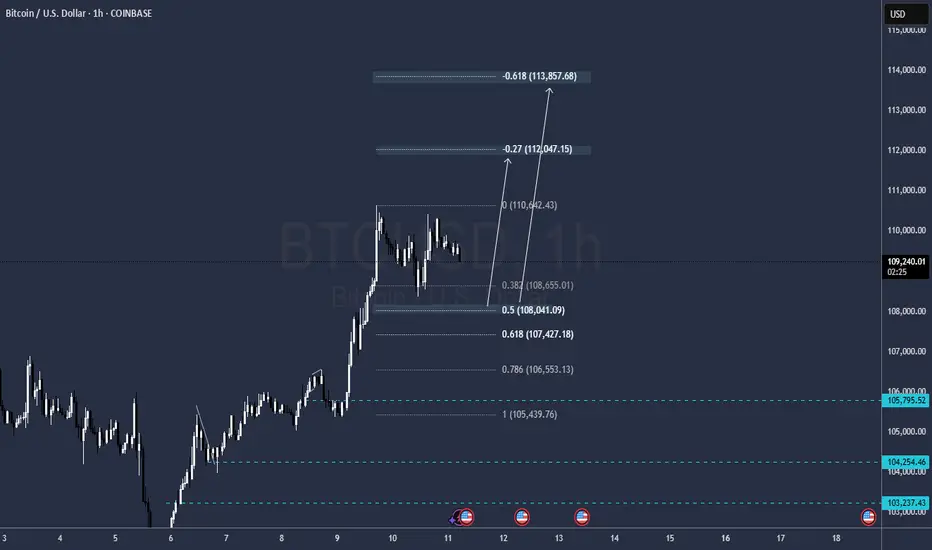
Do technical signals show Bitcoin’s path to $130K? Do technical signals show Bitcoin’s path to $130K?
Bitcoin briefly pushed above $110,000 for the second time this month, before pulling back slightly to trade around $109,500. The market consolidating just below the 61.8% Fibonacci extension level could be suggesting strong resistance is being tested near current levels.
Bitcoin remains within reach of its all-time high at $111,965, set on May 22.
The latest upward move may have been supported by comments from U.S. Commerce Secretary Howard Lutnick, who said trade talks with China in London were progressing well and likely to extend for a third day.
CNBC analyst Todd Gordon expects a breakout toward $130,000 according to his weekly chart analysis. According to our chart, A breakout above 111,897 could open the path to the 78.6% extension around $122,093, followed by the 100% extension target at $135,081

Full Cycle BTC Trendline Mid-2023 to Bull 2025Trendline stretching from mid-2023 lows through the entire bull structure into 2025.
Unbroken since inception
Touched 3+ times
Currently being retested from above
BTC is retesting the primary uptrend
Price dipped below it in April → false breakdown
May-June recovery has reclaimed it
Now sitting right at the trendline, testing it as resistance-turned-support
This is the ultimate decision zone
A daily or weekly close above $110K confirms the trend resumed
Rejection here → opens the door for retrace to $98K–$100K

Altcoin Cycle - Cycle bottoms spottedAs I demonstrated on this picture. I believe I identified the cycle bottoms and marking a new cycle low. With the BITSTAMP:BTCUSD price rising now and CRYPTOCAP:BTC.D about to meet hard resistance levels, I believe this will increase the propability of a start of the altcoin cycle. Also known as the Altcoin season.
CRYPTOCAP:OTHERS
CRYPTOCAP:OTHERS.D
COINBASE:ETHUSD
BINANCE:SOLUSD
INDEX:BTCUSD
BINANCE:BTCUSD
