Bitcoin "Crash" 2025Bitcoin started a more significant correction recently, which is scaring many people, and there is already a lot of talk about the beginning of the Bear market.
In my view, the upward trend is still intact, and this could very well be a healthy correction to prepare for a more significant rise in the coming months.
We have an important support level at $75K which has confluence with the 3D SMMA which has already proven to be strong in the past, I think there will be some reaction and that could very well be the end of this correction, but as long as the price manages to stay above $70K I will remain bullish and looking for Longs.
It is important to note that the Fear and Greed indicator is at 21, with Bitcoin at $84K.
Bitcoinlong

Bitcoin Technicals & FundamentalsBitcoin/US Dollar (BTC/USD)
Price Action Observations:
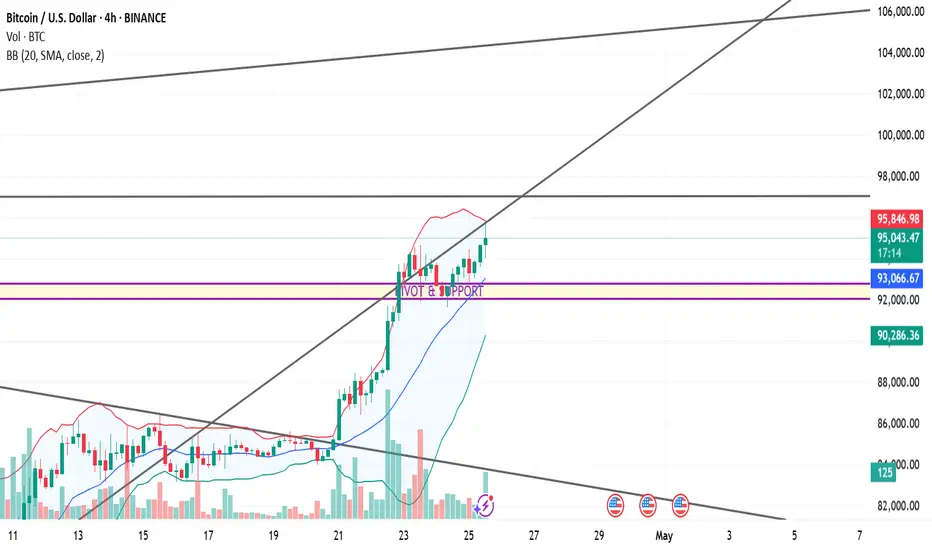
Trend: Strong bullish trend — price is above the middle Bollinger Band and riding the upper band.
Current Price: ~$95,410 (as of the chart time).
Immediate resistance near the upper Bollinger Band (~$95,921).
A major horizontal resistance is at around $98,000 (thick black line).
Local pivot/support zone marked around $92,400 – $93,100 (purple horizontal lines).
20-SMA (middle BB) acts as dynamic support (~$93,085).
Stronger support around $90,200 (lower BB).
Volume increasing on the bullish candles after the breakout around the 21st-22nd April.
Higher volume on green candles suggests genuine buying interest — not just a low-volume rally.
Bollinger Bands: Bands are expanding — classic signal for a volatile move.
Price is walking the upper band → continuation pattern as long as price doesn't break below the 20-SMA.
Trendlines: Ascending trendline beneath the current price → confirming higher lows.
There is a larger upper channel line sloping upwards targeting ~$105,000–$106,000.
Bias: Strong Bullish
Above 92,400–93,100 pivot zone = bullish structure maintained.
Immediate target: $98,000
Stretch target: $100,000 - $105,000 (upper channel resistance)
Invalidation: If price closes below ~$92,000 (break below pivot + mid-BB).
Fundamental Analysis (as of April 25, 2025):
If US Dollar (DXY) is weakening, it favors Bitcoin.
Fed policies — if there’s talk of rate cuts or holding rates steady, Bitcoin rallies.
Halving hype: Bitcoin halving happened earlier in 2024. Historically, it leads to a delayed but strong rally about 12-18 months later — we are now entering that "parabolic" zone.
ETF Inflows: BTC ETFs launched earlier have been drawing huge institutional interest.
Supply Shock: Fewer Bitcoins available on exchanges post-halving = price pressure upwards.
Global uncertainty (recession fears, wars, bank failures) = safe-haven demand for BTC.
Bitcoin being seen as "digital gold" strengthens its position.
My Final View:
Bitcoin remains in a strong bullish structure technically and fundamentally.
As long as it holds above ~$92,000–$93,000 zone, expect moves toward $98,000–$100,000+. A deeper retrace to $90,200 could still maintain the bull trend, but below that would signal weakness.
A High Possibility 59K in next couple of weeks and up only!I think this can repeat as last sept-October. first to 59K and then 80K.

Bitcoin (BTC) $95K Target? ETF Inflows & Supply Shock Key Signal
Bitcoin Flashes Bullish Signals: Record ETF Flows and Supply Shock Fuel $95K Target Hopes
Bitcoin, the original cryptocurrency, is demonstrating renewed vigor, capturing investor attention with a confluence of bullish indicators. After a period of consolidation and sideways movement following its all-time high earlier this year, recent data suggests underlying strength is building. Significant inflows into U.S. spot Bitcoin ETFs, a tightening supply on exchanges, strong relative performance against traditional markets, and key technical levels being tested are painting a picture that has analysts eyeing the next major psychological and technical hurdle: $95,000.
ETF Demand Roars Back: A Sign of Renewed Institutional Appetite
One of the most significant developments fueling recent optimism is the resurgence of demand for U.S.-based spot Bitcoin Exchange Traded Funds (ETFs). Launched in January 2024, these products marked a watershed moment, providing traditional investors with regulated and accessible exposure to Bitcoin. After an initial explosive launch, inflows moderated. However, recent weeks have seen a dramatic turnaround.
Reports indicate that these ETFs recently experienced their largest single-day net inflows since their early days in January, signaling a powerful return of institutional and potentially broader retail interest. This influx of capital into regulated vehicles is crucial. It represents sticky, long-term demand rather than just short-term speculative trading. Each dollar flowing into these ETFs effectively removes Bitcoin from the readily available market supply, contributing to a potential supply squeeze.
This sustained demand has also propelled Bitcoin's overall market capitalization significantly. While direct comparisons fluctuate daily and depend on methodology (e.g., including gold, different equity classes), Bitcoin's market cap has grown to rival that of major global corporations and even some traditional asset classes. Its ascent up the ranks of the world's largest assets underscores its growing acceptance and integration into the broader financial landscape. While claiming a specific rank like "5th largest" can be debated based on what's included, there's no denying Bitcoin is now a multi-trillion dollar asset class demanding attention.
The Supply Squeeze: Coins Vanish from Exchanges
Complementing the demand surge is a notable trend on the supply side: Bitcoin reserves held on cryptocurrency exchanges are dwindling rapidly. Data reveals that the amount of BTC available for immediate sale on major trading platforms has plummeted to levels not seen since November 2018. This marks a multi-year low, indicating a strong preference among holders to move their coins into self-custody or long-term storage solutions, rather than keeping them poised for sale.
What's driving this exodus from exchanges? Analysts point to several factors, including the aforementioned ETF accumulation, where authorized participants acquire Bitcoin on the open market to meet ETF share creation demand. Furthermore, there's growing anecdotal and on-chain evidence suggesting accumulation by long-term holders ("HODLers") and potentially public companies adding Bitcoin to their balance sheets. While large-scale corporate buying sprees like MicroStrategy's haven't been widely replicated across the board, the cumulative effect of sustained institutional buying (via ETFs) and dedicated HODLers consistently pulling supply off exchanges creates a powerful dynamic.
Lower exchange reserves typically correlate with reduced selling pressure. When less Bitcoin is readily available to be sold, even moderate increases in demand can have an outsized impact on price. This scarcity factor is a core tenet of Bitcoin's value proposition, underpinned by its fixed supply cap of 21 million coins, and the current trend highlights this dynamic in action.
Relative Strength: The "Cleanest Shirt in the Dirty Laundry"
Bitcoin's recent performance also stands out when compared to traditional financial markets. Over the past 30 days (as per the provided context), Bitcoin has posted significant gains (e.g., +7.68%), while major equity indices like the S&P 500 and the tech-heavy Nasdaq have experienced notable pullbacks (e.g., -6.79% and -8.14%, respectively).
This divergence has led some commentators to describe Bitcoin as the "cleanest shirt in the dirty laundry pile." In times of macroeconomic uncertainty, geopolitical tension, or wavering confidence in traditional financial systems, Bitcoin can attract capital seeking alternatives or hedges. While its correlation with risk assets like tech stocks has often been high, periods of decoupling, like the one observed recently, suggest investors may increasingly view Bitcoin through a different lens – perhaps as a non-sovereign store of value or a bet on future technological disruption, rather than just another high-beta risk asset. This relative outperformance can attract momentum traders and further bolster positive sentiment.
Technical Hurdles: The Road to $95K
From a technical analysis perspective, Bitcoin's price action is generating significant discussion. One key metric analysts watch is the "realized price," particularly for short-term holders (investors who acquired BTC relatively recently). When the market price surpasses the average acquisition cost of these recent buyers, it can signal a shift in market psychology. Those who bought recently are now in profit, potentially reducing sell pressure and encouraging further buying. Bitcoin recently surpassed this level, leading to speculation about whether this marks the beginning of a sustained rally or potentially sets up a "double top" scenario – a bearish pattern where an asset fails twice to break above a certain resistance level.
Analysts are closely watching specific price levels. There appears to be a consensus around a key resistance zone that, if decisively reclaimed and held, could signal that "all bets are off" for the bears, potentially opening the door for a significant upward move. Conversely, failure to break through these levels, or a strong rejection from them, could lead to a pullback, validating the warnings from more cautious analysts.
The $95,000 mark looms large as the next major psychological and potential technical resistance area should the current momentum continue and key lower resistance levels be overcome. Reaching this target would likely require a confluence of the factors already discussed: continued strong ETF inflows, further depletion of exchange supply, supportive macroeconomic conditions (or continued relative strength despite macro headwinds), and a decisive break through established technical resistance zones.
What Triggers the Breakout?
Achieving a breakout towards $95,000 isn't guaranteed and likely requires several catalysts:
1. Sustained ETF Demand: Continued, consistent net inflows into spot Bitcoin ETFs are paramount to absorb supply and signal ongoing institutional conviction.
2. Supply Shock Intensification: If exchange reserves continue to fall sharply, the scarcity narrative strengthens, potentially triggering FOMO (Fear Of Missing Out) buying.
3. Macroeconomic Shifts: A dovish pivot from central banks, renewed inflation fears driving demand for hard assets, or further instability in traditional markets could push more capital towards Bitcoin.
4. Technical Confirmation: A convincing break and hold above currently watched resistance levels would give technical traders confidence and potentially trigger algorithmic buying.
5. Positive Regulatory Developments: While the ETFs were a major step, further regulatory clarity or positive developments globally could reduce perceived risk.
Conclusion: Optimism Tempered with Caution
The current Bitcoin landscape presents a compelling bullish case. Resurgent ETF demand, dwindling exchange supply creating a scarcity effect, and strong relative performance against traditional assets paint an optimistic picture. Technical indicators, such as surpassing the realized price of recent buyers, add fuel to the fire, bringing targets like $95,000 into the conversation.
However, caution remains warranted. Bitcoin is notoriously volatile, and technical resistance levels often prove formidable. The risk of a "double top" or rejection at key levels is real, and regulatory headwinds or negative macroeconomic shifts could quickly alter sentiment. While the confluence of positive factors is undeniable and the path towards $95,000 seems plausible given the current dynamics, investors will be keenly watching whether ETF flows remain strong, supply continues to tighten, and crucial technical levels can be decisively overcome. The interplay between institutional adoption, HODLer conviction, and market technicals will ultimately determine if Bitcoin can conquer its next major milestone.

BTC/USDT Analysis: Following the Scenario
Hello everyone! This is CryptoRobotics' trader-analyst with your daily market breakdown.
Yesterday, Bitcoin came just short of testing the $95,000–$96,700 resistance zone (accumulated volumes) and began to pull back. Most likely, we will see more significant selling pressure once this zone is directly tested.
At the moment, we’ve tested the $92,000–$90,000 buy zone (strong buying imbalance) and are already seeing a reaction from it. The main expectation is the continuation of the long position and a test of the mentioned resistance zones. This is supported by the relatively weak nature of the pullback, absorption of market selling pressure on cumulative delta, and the presence of strong support.
Sell Zones:
$95,000–$96,700 (accumulated volumes)
$97,500–$98,400 (aggressive pushing volumes)
$107,000–$109,000 (volume anomalies)
Buy Zones:
$92,000–$90,000 (strong buying imbalance)
$88,100–$87,000 (market sell absorption)
$85,500–$84,000 (accumulated volumes)
$82,700–$81,400 (high volume area)
Level at $74,800
$69,000–$60,600 (accumulated volumes)
This publication does not constitute financial advice.

Has BTC Turned The CornerThursday 24th April 2025
Monthly Index Chart
I've been watching this and at the start of the month the current TD Green 1 candle was a TD Red 2 which was bearish which has now turned bullish!
We are still in the channel so we are still overall in a bullish trend.
The support line at $72k has held.
This could be a sign it might be the right time to get back in and start accumulating again. Buy dips with extreme prejudice. Time to be in like Flynn.
The 9 Month MA has held as support.
Money flow is decreasing, to the zero line, but may turn.
BTC ETF inflows are curling up where as at the start of this month there was massive selling the first 10 days.
Hashrate continue to climb but no buy signal or miner capitulation since July 2024.
MACD is still climbing.
VZO PZO still in a firm bull trend.
CCI has cooled off but looks like it wants to curl back up.
Overall I am still bullish and it appears BTC has turned a corner.
Keep sailing the high seas crypto pirates.
Snake Plissken signing out.

Forget Tariffs: Why Bitcoin Cares More About ETFs Than EarningsBitcoin's Great Decoupling: Why It Ignores Tariffs and Earnings, Fueled by Fundamentals and ETF Billions
In the complex tapestry of global finance, assets typically dance to the tune of macroeconomic news, central bank policies, corporate earnings reports, and geopolitical tensions like trade tariffs. Stocks rise on strong profits, bonds react to interest rate shifts, and currencies fluctuate with trade balances. Bitcoin, however, increasingly appears to be charting its own course, seemingly indifferent to the traditional market drivers that dictate the movements of legacy assets. This phenomenon, often termed "decoupling," isn't just a statistical anomaly; it's rooted in Bitcoin's fundamental nature and is gaining significant validation through the burgeoning success of US-listed Bitcoin Exchange Traded Funds (ETFs).
The core argument, as highlighted in recent market commentary, is compelling: Bitcoin's value proposition isn't tied to quarterly earnings calls, CEO performance, or the potential impact of import tariffs. It has no central bank adjusting its supply or setting its interest rate. Instead, its perceived value stems from a unique set of characteristics: verifiable digital scarcity capped at 21 million coins, a decentralized network resistant to single points of failure or control, and an emerging role as a neutral, global reserve asset in an increasingly politicized and fragmented world.
Fundamentals Over Fleeting News Cycles
Traditional assets are intrinsically linked to the health of economies and corporations. A weak earnings report can send a stock tumbling, while fears of a trade war can ripple through entire sectors. Bitcoin exists outside this framework. Its "earnings" are the security and finality provided by its blockchain; its "management" is the distributed network of miners and nodes enforcing consensus rules; its "monetary policy" is embedded in its immutable code.
This inherent separation means that while traditional markets might gyrate based on the latest Federal Reserve announcement or geopolitical flare-up, Bitcoin's trajectory is often more influenced by factors specific to its own ecosystem: adoption rates, network upgrades, regulatory clarity (or lack thereof), halving events that reduce new supply issuance, and, crucially, capital flows into vehicles that provide access to it.
The narrative suggests Bitcoin is maturing into something akin to a digital version of gold – an asset valued for its scarcity and neutrality, acting as a potential hedge against inflation, currency debasement, and systemic risks within the traditional financial system. In a world grappling with high debt levels, persistent inflation, and geopolitical instability (like the mentioned US trade war volatility), the appeal of a non-sovereign, mathematically scarce asset grows.
ETF Inflows: A Roaring Stamp of Approval
The most potent evidence supporting this decoupling narrative and Bitcoin's growing acceptance comes from the recent performance of US spot Bitcoin ETFs. Launched earlier in the year, these products represented a watershed moment, providing regulated, accessible exposure for institutional and retail investors alike through traditional brokerage accounts.
Recent data underscores their impact. On April 21st, these ETFs collectively witnessed their largest single-day net inflows since the initial launch frenzy in January, pulling in a remarkable $381.3 million. This surge in demand, with notable contributions like the $116.1 million flowing into the RK 21Shares Bitcoin ETF (ARKB), coincided directly with significant positive price action. Bitcoin decisively broke through previous resistance levels, reclaiming the $91,000 mark after a seven-week consolidation period.
These inflows are more than just numbers; they represent a tangible shift in capital allocation. They signal growing institutional comfort and strategic positioning in Bitcoin. Unlike speculative futures-driven rallies, inflows into spot ETFs reflect direct demand for the underlying asset, potentially building a more stable foundation for price appreciation. This influx suggests investors aren't just chasing momentum but are making longer-term allocations, viewing Bitcoin as a legitimate component of a diversified portfolio, independent of its correlation (or lack thereof) to other asset classes.
Price Action, Leverage, and the Path Ahead
The technical picture for Bitcoin has brightened considerably alongside these fundamental drivers. The recent surge saw Bitcoin break key bearish structures, establishing a higher low that many traders see as a potential launchpad for challenging previous all-time highs. The reclaiming of the $91,000 level was a significant psychological victory for bulls, reinforcing the positive sentiment fueled by the ETF flows. Market participants are now eyeing levels like the yearly open around $93,000 as the next major hurdle.
However, caution remains warranted. Analysts note that recent price surges have often been accompanied by significant leverage in the derivatives market. While leverage can amplify gains and accelerate upward moves, it also increases volatility and the risk of sharp liquidations if the market turns. The critical question is whether the consistent spot buying, particularly through ETFs, can absorb selling pressure and provide the underlying support needed to sustain these higher price levels. A rally built predominantly on leverage without corresponding spot demand is often viewed as less stable.
The comparison to gold's comeback potential amidst trade tensions is intriguing, but Bitcoin still needs to prove its resilience. While it has demonstrated periods of acting as a safe-haven asset, its correlation to risk assets like tech stocks can reappear, especially during broad market liquidity crises. The "decoupling" is not absolute, but rather a dominant trend driven by its unique value proposition gaining traction.
Conclusion: A Maturing Asset Forging Its Own Path
Bitcoin's recent performance, marked by significant ETF inflows and a price surge seemingly disconnected from traditional market anxieties like tariffs and earnings reports, lends strong support to the decoupling narrative. Its fundamental characteristics – scarcity, decentralization, and neutrality – are increasingly resonating in a complex global environment. The success of spot Bitcoin ETFs provides a regulated gateway for broader adoption and serves as tangible proof of growing institutional and retail demand, validating Bitcoin's role as an emerging reserve asset.
While challenges remain, including inherent volatility, regulatory uncertainties, and the need for spot demand to underpin leverage-driven moves, the trend is undeniable. Bitcoin is increasingly trading based on its own unique supply/demand dynamics and its perceived role in the future financial landscape, rather than simply mirroring the movements of traditional markets. It doesn't care about Q3 earnings or new import duties because its value proposition exists on a different plane. As capital continues to flow in via accessible vehicles like ETFs, recognizing its distinct properties, Bitcoin's journey towards becoming a truly independent, globally significant asset class continues, one block at a time.

Bitcoin Will Soon Follow GOLD!!!Bitcoin has just hit the $87,000 mark, breaking out of a classical bullish continuation pattern. This breakout is significant and indicates strong bullish momentum that could lead to further upside. If this momentum continues, Bitcoin has the potential to not only reclaim its previous all-time high but also push beyond into price discovery mode.
Interestingly, this move comes right after Gold printed a new all-time high. Historically, Gold has often led major macro cycles, with Bitcoin following closely behind. This pattern seems to be playing out once again. As investors rotate capital and seek safe havens or inflation hedges, Bitcoin stands to benefit as the digital equivalent of Gold. If history repeats, Bitcoin could be on the verge of its next major rally.
From a technical standpoint, the breakout is supported by increasing volume and bullish momentum indicators such as RSI and MACD. The key support now lies around the $85K– GETTEX:87K zone, which previously acted as resistance. If price holds above this level, the next targets to watch are $90K and the psychological $100K mark.
That said, proper risk management is crucial. The market is moving fast, and while the setup is bullish, it’s important to have a well-defined stop-loss strategy in place. Avoid chasing price—wait for clean retests or consolidations if you missed the initial breakout. Momentum may be in the bulls’ favor, but discipline keeps you in the game.
Bitcoin has made its move. Gold has shown the way. If the historical correlation holds true, Bitcoin may be just getting started. Stay focused and manage your risk wisely.
BTC/USDT Analysis – Confirmed Bullish Trend
Hello everyone! This is CryptoRobotics' trader-analyst with your daily market analysis.
Yesterday, Bitcoin continued accumulating around our marked level of $87,000 without dropping below it.
Today, we broke the key high of $88,800 and are now seeing a surge in volume.
Our main scenario remains a continuation of the uptrend toward the next sell zone or until we encounter abnormally strong market or limit sell pressure (a sharp volume spike followed by a failure to hold above, or a technical trend break).
At this stage, it's important to secure a position above $90,500 — in that case, the current volume spike may act as support, providing a good opportunity to join the long side.
If not, we expect a return to the $88,000 area.
Sell Zones:
$95,000–$96,700 (accumulated volume),
$97,500–$98,400 (initiative pushing volumes),
$107,000–$109,000 (volume anomalies).
Buy Zones:
$90,300–$89,500 (potential pushing volume zone),
$88,100–$87,000 (absorption of market selling),
$85,500–$84,000 (accumulated volume),
$82,700–$81,400 (high-volume area),
Level at $74,800,
$69,000–$60,600 (accumulated volume).
This publication is not financial advice.

Bitcoin & the Resistance...who will win?Its early 2025 any Bitcoins hashrate is hovering around 1000 EH/S! The computational power is becoming staggering. Has anyone considered the sci-fi world we currently live in and how that might affect BTC in the future? I like the version of the new matrix where a truly decentralized, pro human AI program is released on the bitcoin network to grow...lol
The future and perps markets determine bitcoins price now. There are fewer coins in circulation so everything is leveraged. Be mindful of massive head fakes but like the $96200.00 area for resistance. Might be a nice area to short for a 5x leveraged scalp...
Not financial advice and crypto has unique risks that usually end of you losing funds. Have fun and learn.

BTC/USD: Hero's Quest to the Boss Treasure BTC/USD: Hero's Quest to the Boss Treasure
Price Action Deep Dive:
BTC/USD has formed a powerful SPAWN POINT breakout on the 4H timeframe, characterized by three consecutive blue candles with minimal wicks, indicating strong buyer control
Prior to the breakout, we observed a period of tight consolidation (level 15-20 grinding phase) where price was building energy for the current upward thrust
The breakout volume significantly exceeds previous candle volumes, confirming legitimate player interest in this upward move
Recent price structure shows higher lows and higher highs, establishing a clear uptrend path toward our target zones
Current candle formation suggests momentum continuation rather than exhaustion, with minimal upper wicks indicating buyers absorbing all selling pressure
Market Structure Context:
The breakout has successfully cleared the previous resistance zone (ELITE LvL 2 HP: 2), transforming it into support for future pullbacks
The Treasure Hunter color shift preceded this move, acting as an early warning signal for observant traders
Major support trendline from previous lows remains intact, providing a "regeneration shield" for any temporary retreats
Each pullback has been increasingly shallow, demonstrating growing reluctance from sellers to engage the hero's advance
The most recent consolidation formed a bull flag pattern before the continuation, classic "power-up charging" price action
With our Hero at Level 159 with full health and the Wizard's Journey already 53% complete, all technical indicators align for continued progress toward BOSS TREASURE around $94,000-$95,000, though we should remain vigilant for temporary pullbacks to the HEALTH POTION zone around $84,000.

Market overview
WHAT HAPPENED?
Last week we reached a significant sell area. At the moment, there were strong volume anomalies from the seller. Our main scenario was a correction. But by the middle of the week, after a prolonged flat, the seller began to weaken noticeably. Attempts to update the local minimum didn’t bring results. The scenario was rearranged in the direction of long-range movement.
WHAT WILL HAPPEN: OR NOT?
We’ve already updated the local maximum on an increased volume.
The main priority is long. After updating the $88,800 extreme, the road to $95,000 will be opened. At the same time, the price of $87,000 will act as a support level for a decline. At the moment, strong buyer activity is recorded on it.
Sell Zones:
$95,000–$96,700 (accumulated volume),
$97,500–$98,400 (initiative volume pushing upward),
$107,000–$109,000 (volume anomalies).
Buy Zones:
$85,500–$84,000 (accumulated volume),
$82,700–$81,400 (high-volume area),
Level at $74,800,
$69,000–$60,600 (accumulated volume).
IMPORTANT DATES
The macroeconomic events this week:
• Wednesday, April 23, 13:45 (UTC) — publication of business activity indices in the US manufacturing and services sectors for April;
• Wednesday, April 23, 14:00 (UTC) — publication of data on new home sales in the United States for March;
• Thursday, April 24, 12:30 (UTC) — publication of the number of initial applications for unemployment benefits in the United States;
• Thursday, April 24, 14:00 (UTC) — publication of sales in the secondary housing market in the United States for March.
*This post is not a financial recommendation. Make decisions based on your own experience.
#analytics

Happening NOW, breakout on Daily, 4hour and 60min timeframesUsing simple trend lines, a buy signal has happened on the Daily, 4-hour and 1-hour charts.
I'm using the candle bodies for my trend lines.

Bitcoin Is Entering Into The New ImpulseHello, Skyrexians!
We hope you remember our previous BINANCE:BTCUSDT analysis where we told you that Bitcoin will not go significantly lower than $77k. Now price is already at $85k and people now can't understand what is happening. We can see a lot of charts where traders are calling for bear market and further deep dive.
On the daily time frame we can see the clear picture. At $110k the previous impulse has been finished. Bearish divergence on the Awesome Oscillator and two red dots on the Bullish/Bearish Reversal Bar Indicator were the sign of large correction ABC. Now it has been finished with the confirmation with opposite signals. Moreover, wave C has been finished inside the Fibonacci target area. We are 90% sure now that Bitcoin is going to ATH now and this time it can happen with the altcoins growth.
Best regards,
Skyrexio Team
___________________________________________________________
Please, boost this article and subscribe our page if you like analysis!

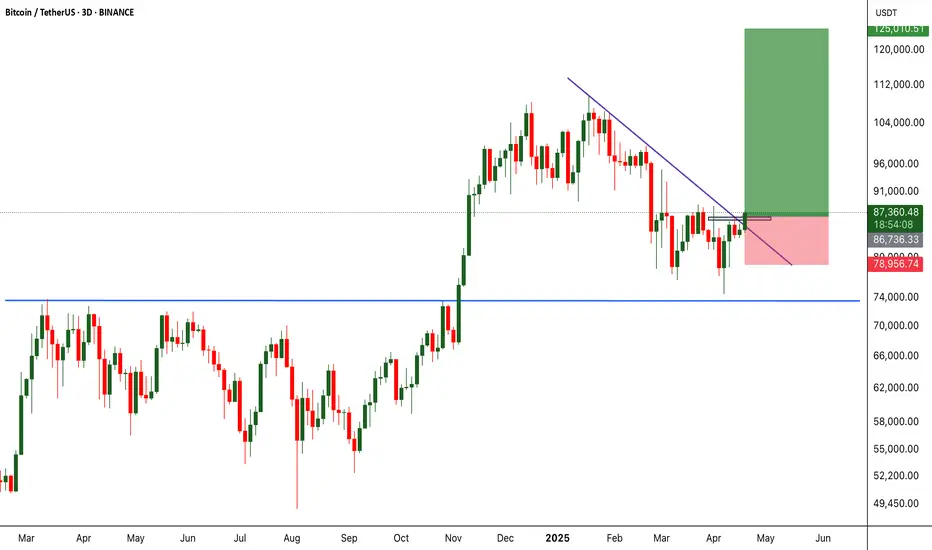
[BTC/USDT] Wave (4) Completed? Road to $140K Begins HereBitcoin is consolidating just above key support after a textbook correction. The first chart shows a completed Falling Wedge breakout from Wave ④, while the second chart lays out macro Fibonacci targets for Wave (5).
Chart 1 (Daily): Local Breakout Setup
• Falling wedge breakout above 83.9K–84.3K
• Completed structure: Wave ③ → ④ → Potential Wave ⑤
• Invalidation: Below 73.8K or worst-case 69.5K
• Bullish continuation requires break & close above 86K
Chart 2 (Weekly): Macro Target Projections
Using Fibonacci extension from Wave (3), BTC shows:
• 0.618 Target = $114,983
• 1.000 Target = $140,033
• 1.618 Target = $180,560
If current support holds, Bitcoin could be entering a massive Wave (5) cycle with upside potential towards $140K–$180K. Reclaiming levels like $92.5K, $101K, and $106K will confirm the bullish structure.
What’s your Wave 5 target?
#Bitcoin #BTC #BTCUSDT #CryptoAnalysis #ElliottWave #Fibonacci #CryptoTA

BTC/USDT Analysis – The Climax Is Near
Hello everyone! This is the trader-analyst from CryptoRobotics, and here is your daily analysis.
The Bitcoin scenario remains mostly unchanged as we continue to move sideways. Buyers have not stepped in yet, but movement toward the upper boundary of the range is still the priority. This is indicated by the absorption of market selling, seen through the cumulative delta.
We are currently being squeezed into a very narrow range, so we can expect a strong breakout in either direction soon.
Sell Zones:
$95,000–$96,700 (accumulated volume),
$97,500–$98,400 (initiative volume pushing upward),
$107,000–$109,000 (volume anomalies).
Buy Zones:
$82,700–$81,400 (high-volume area),
Level at $74,800,
$69,000–$60,600 (accumulated volume).
What do you think — which direction will the current range break?
Share your opinion in the comments — it’s always interesting to compare views!
*This publication is not financial advice.

BITCOIN WEEKLY ANALYSIS - April 18th, 2025BTC/USD is currently hovering just below a major descending trendline and key horizontal resistance near the 91,500 level. 🧱
🔍 What We’re Watching:
- Price has tested the downtrend line multiple times — the structure is weakening.
- A breakout above 87,500 could trigger a strong bullish move.
- Until then, "Wait for the Breakout" remains the strategy. No confirmed long entries yet.
📉 Current Price: $84,500
📈 Breakout Confirmation: Clean close above resistance zone + volume spike = 🔥🔥 potential rally.
🧠 Pro Tip: False breakouts are common. Watch for confirmation — not just a wick!
Stay sharp, stay patient. Breakouts give the best reward-risk trades! 💹

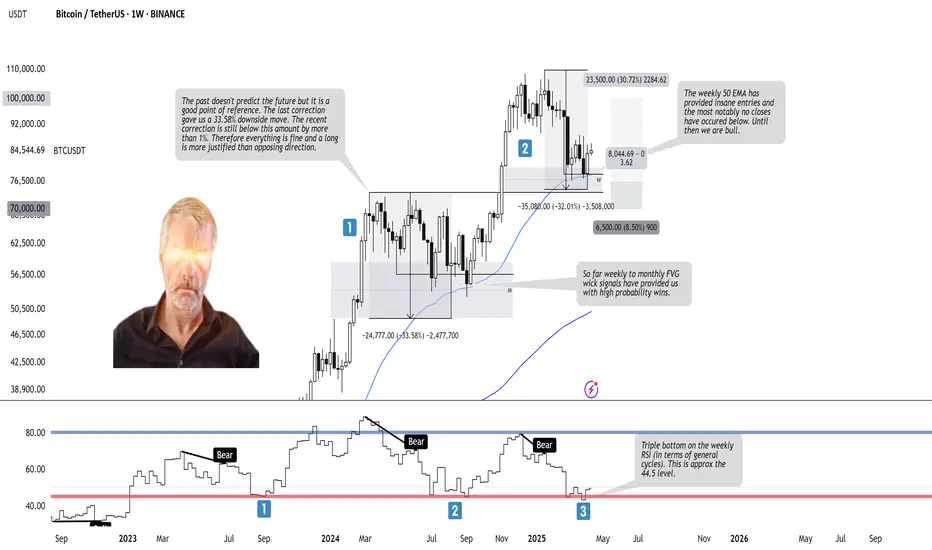
BTCUSDT - Trade Log BTCUSDT – Weekly Bullish Outlook
Weekly Context: Price has held the weekly Fair Value Gap and bounced off the 50 EMA, with clean wick rejections signaling strong buyer demand. The recent pullback (~32% from ATH) remains within historical correction bounds, and the tiny current retrace (<1%) suggests low downside risk. A triple bottom on the weekly RSI cycle around 40 further supports a bullish reversal.
Trade Plan (Long):
– Entry: Add longs near the weekly FVG / 50 EMA (around 75–87k).
– Stop: Place just below the FVG low (≈70k), risking ~5% of account.
– Target: First at 100k (psychological level), then previous ATH region for a 1:3+ RRR.
Bullish Catalysts:
• Weekly 50 EMA has only closed below twice—support intact.
• Weekly FVG wick signals have historically delivered high-probability bounces.
• Triple bottom on weekly RSI signals major capitulation is complete.
• Macro backdrop (equities & gold) remains positive for BTC.
Stay alert for any decisive weekly close below the EMA—until then, the bulls remain in control. 🚀
$BTC forming a range, getting tight w lower than average volumeCRYPTOCAP:BTC forming a range and getting tight with lower than average volume, under a rising 150/200 MA (could be resistance). Shorter term MAs looking to cross 10/20. Will keep my eyes on NASDAQ:IBIT and CBOE:BITX if this range breaks in either direction

BTC Falling Wedge .Displaying a Falling Wedge pattern, there will be some downside to come, but after that, we will see a push-up to the north.
SUPPORT AT $73,805
$111K TP

Bitcoin is heading into its final low before bull market?Bitcoin got rejected at the 1-Day Cycle top and is now pulling back toward the 1-Day Cycle lows.
While most investors are getting bored and slowly shifting their attention elsewhere, crypto is quietly consolidating and gearing up for a BIG move...
Will we break above $100K, or are we heading into a recession and full-on bear market mode?
Next week will be a decisive one for the entire crypto market this year.
If Bitcoin manages to hold above $77,000 as the 1-Day Cycle hits Day 20, we could be on the verge of a run toward $100K. But if we drop below the previous 1-Day Cycle low, trouble’s coming.
Confused? Just check out this chart.
It’s easy to lay out both the bullish and bearish cases—but it’s a whole different game to quantify, commit to a position, and wait for the more probable outcome to play out.
Which scenario is more likely?
In short: the green one . Here’s why:
The 2-Week Cycle has spent over 4 weeks below 20, completely crushing bullish sentiment.
The 1-Week Cycle has been below 20 for over 2 months—the longest stretch in the past 5 years.
The 3-Day Cycle hasn’t fully reset, but reversed to the upside last week due to positive price action.
We’re on Day 46 of the 60-Day Cycle, and price has been holding up well. We’ve tested the $80K zone a couple of times, and Bitcoin still seems eager to push higher.
For the first time in a while, there are more bears than bulls (according to Polymarket).
On that note—check the Polymarket predictions

Long trade opportunity is coming Bitcoin price is starting to look interesting for a long trade opportunity.
Currently Bitcoin is in the range bound between 75,000 approx and 89,500 aprox (blue rectangular box in the chart).
EMA 200 is horizontally running through in the middle of the range and EMA 21, 55 and 200 are starting to get bunched up together. I really like this set up because when this happens, it is often followed by a strong directional move. All you need for now is patience, which is the hardest thing to do.
I will open a long position if the following conditions are met:
1) Daily MACD and RSI will move into the bull zone and they are clearly pointing to the upside.
2)The price will move and close above the descending trendline.
3) EMAs are going to start to spread out and line up properly (EMA 21>55>200 for long)
For whatever reasons, if I feel I need to be more cautious, I might wait for the price to move and close above 93,000 (above orange rectangular box area) because it is a high liquidity area and I think a lot of price manipulation might happen.

Bitcoin going back to 97k ? Follow up on my last idea.
Bitcoin will probably return to the 95/97 k
Stop loss: 69.5 K
Take profit: Around 95/96k
